

GBP/JPY Price Forecast: Buyers defend 216.50 as bullish trend continues
- GBP/JPY trades in a narrow range as fragile market sentiment keeps traders cautious.
- Traders avoid chasing GBP/JPY higher as the risk of intervention by Tokyo remains elevated.
- Firm momentum and a positive MACD reinforce the cross’s bullish technical structure.
GBP/JPY trades in a narrow range on Tuesday as market sentiment remains fragile amid escalating tensions between the US and Iran, which are driving Oil prices higher once again. At the time of writing, the cross trades around 217.10 as the Japanese Yen (JPY) remains broadly weak.

Higher Oil prices are weighing on the Yen as Japan relies heavily on imported energy. At the same time, the inflationary impact of rising energy costs is reinforcing expectations that major central banks, including the Bank of England (BoE), may need to raise interest rates.
The BoJ remains on a tightening path but continues to lag behind its global peers, with wide interest rate gaps giving the British Pound (GBP) an advantage over the Yen and keeping GBP/JPY tilted to the upside.
Still, traders remain cautious about chasing GBP/JPY higher amid the growing risk of intervention by Japanese authorities as USD/JPY hovers near 40-year highs above 160.
Technical analysis: 4-hour chart
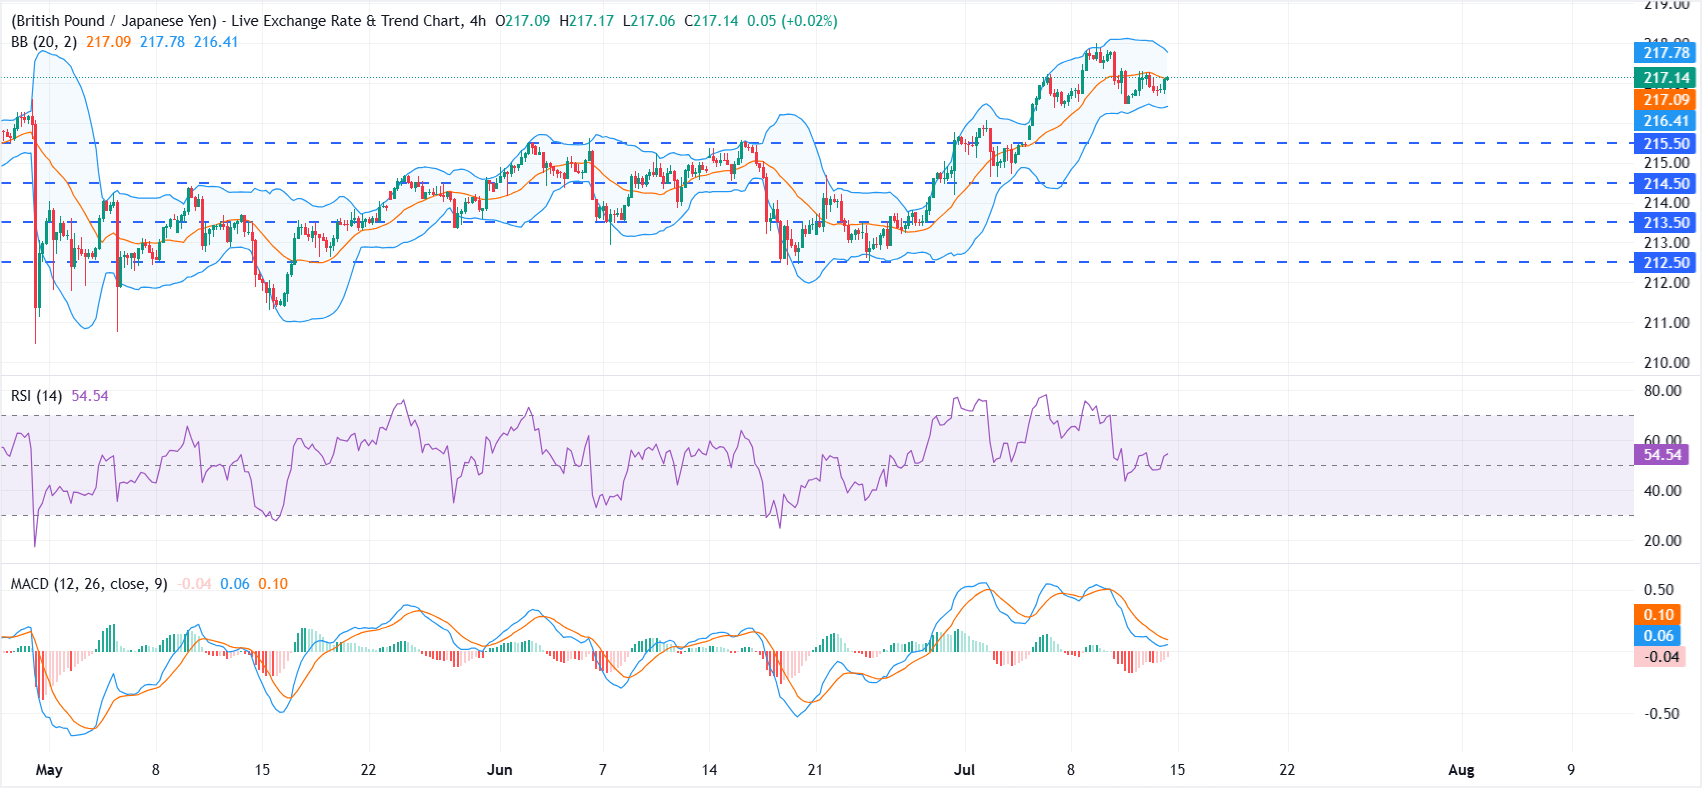
On the four-hour chart, GBP/JPY is retesting immediate resistance at the Bollinger Bands’ middle band near 217.09 while holding comfortably above the lower band at 216.41.
Momentum is moderating from recent overbought extremes, with the Relative Strength Index (RSI) near 54, while the Moving Average Convergence Divergence (MACD) indicator stays slightly negative, hinting at a slower but still constructive upside phase rather than a strongly impulsive rally.
On the upside, a clear break above the Bollinger Bands’ middle band would expose the upper band at 217.77. On the downside, initial support lies at the lower band at 216.41. A deeper pullback could expose the horizontal support levels at 215.50, 214.50, 213.50 and 212.50.
Technical analysis: Daily chart
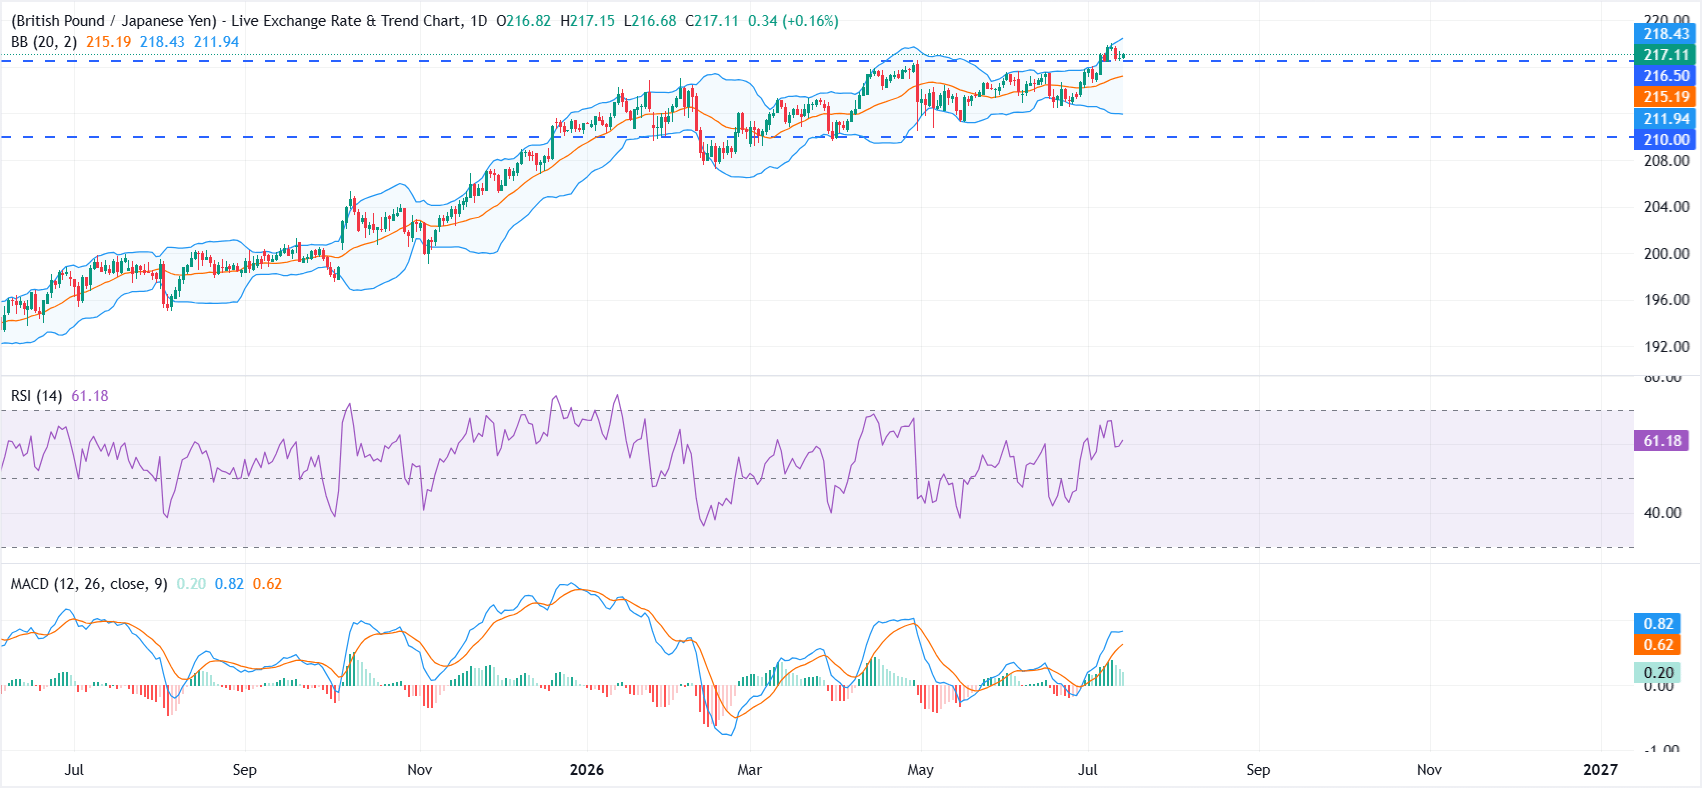
On the daily chart, GBP/JPY maintains a bullish structure, forming a series of higher highs and higher lows. The cross trades above the Bollinger Bands’ middle band at 215.19 and holds above the nearby horizontal support at 216.50, keeping the broader upside bias intact.
The Relative Strength Index (RSI) stands at 61, reflecting firm positive momentum without entering overbought territory, while the Moving Average Convergence Divergence (MACD) remains positive, suggesting that buyers retain control.
On the upside, immediate resistance is seen at the upper Bollinger Band near 218.43, where gains could face some resistance. On the downside, initial support lies at 216.50, followed by the middle Bollinger Band at 215.19. A break below these levels could expose the lower Bollinger Band at 211.94, ahead of the horizontal support at 210.
(The technical analysis of this story was written with the help of an AI tool. Know more.)
Japanese Yen Price Today
The table below shows the percentage change of Japanese Yen (JPY) against listed major currencies today. Japanese Yen was the strongest against the US Dollar.
| USD | EUR | GBP | JPY | CAD | AUD | NZD | CHF | |
|---|---|---|---|---|---|---|---|---|
| USD | -0.21% | -0.28% | -0.16% | -0.34% | -0.36% | -0.88% | -0.40% | |
| EUR | 0.21% | -0.07% | 0.06% | -0.13% | -0.15% | -0.66% | -0.18% | |
| GBP | 0.28% | 0.07% | 0.13% | -0.05% | -0.06% | -0.59% | -0.12% | |
| JPY | 0.16% | -0.06% | -0.13% | -0.18% | -0.22% | -0.74% | -0.27% | |
| CAD | 0.34% | 0.13% | 0.05% | 0.18% | -0.04% | -0.54% | -0.07% | |
| AUD | 0.36% | 0.15% | 0.06% | 0.22% | 0.04% | -0.52% | -0.04% | |
| NZD | 0.88% | 0.66% | 0.59% | 0.74% | 0.54% | 0.52% | 0.48% | |
| CHF | 0.40% | 0.18% | 0.12% | 0.27% | 0.07% | 0.04% | -0.48% |
The heat map shows percentage changes of major currencies against each other. The base currency is picked from the left column, while the quote currency is picked from the top row. For example, if you pick the Japanese Yen from the left column and move along the horizontal line to the US Dollar, the percentage change displayed in the box will represent JPY (base)/USD (quote).














