
News & AnalysisCareer

Stronger US inflation figures on Tuesday sent Bitcoin (BTC) down to $72,727, with the cryptocurrency remaining subdued around $73,800 on Wednesday. A further weakening in institutional demand saw BTC spot exchange-traded funds (ETFs) register withdrawals of $95 million on Tuesday, their fourth consecutive day of outflows. A K33 Research report also points to a growing risk of sharp BTC price swings as derivatives-market leverage accumulates, calling for caution among traders.

Tuesday’s closely watched US Consumer Price Index (CPI) release showed headline inflation rising 0.4% in October, exceeding the market forecast of 0.3%. Excluding volatile food and energy prices, core CPI increased 0.3%. That matched September’s rise but was above the expected 0.2%.
Annual inflation readings were absent from the release because monthly data for October 2025 were unavailable following the government shutdown from 1 October 2025 to 12 November 2025.
Risk appetite is being dampened by the above-forecast US CPI readings. At the same time, mounting expectations of additional monetary tightening by the Federal Reserve (Fed) are lending support to the US Dollar (USD) and US Treasuries.
Concerns over a potential December interest-rate increase by the Federal Reserve (Fed) have intensified following Tuesday’s inflation release. According to Fed Governor Christopher Waller, the stronger-than-expected 0.3% core CPI reading could lead him to consider a larger increase of 50 basis points (bps) at the 8–9 December policy meeting. He warned that opting for only 25 bps could jeopardise the Fed’s credibility.
Keeping policy restrictive remains necessary to bring inflation back to 2%, Philadelphia Fed President Anna Paulson said. Dallas Fed President Lorie Logan, meanwhile, suggested that interest rates may have to rise more quickly than previously envisaged.
With the 10-year Treasury yield climbing above 5%, this hawkish policy stance is lifting both yields and the USD, putting pressure on risk assets including Bitcoin.
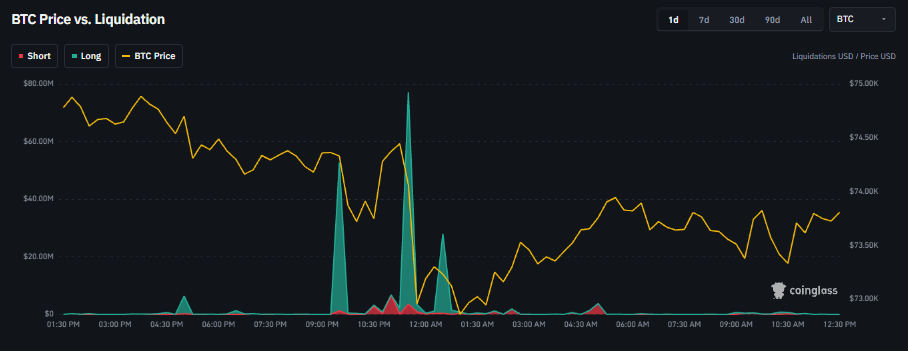
Following the above-forecast US CPI release, BTC fell sharply on Tuesday to $72,727, its lowest level since 20 August. The CoinGlass liquidation chart below illustrates the move.
Liquidations spread across the cryptocurrency market as prices dropped, predominantly wiping out leveraged long positions and underscoring the extent of bullish positioning.
Further sharp swings remain a significant risk for the leading cryptocurrency, with leverage still accumulating in derivatives markets.
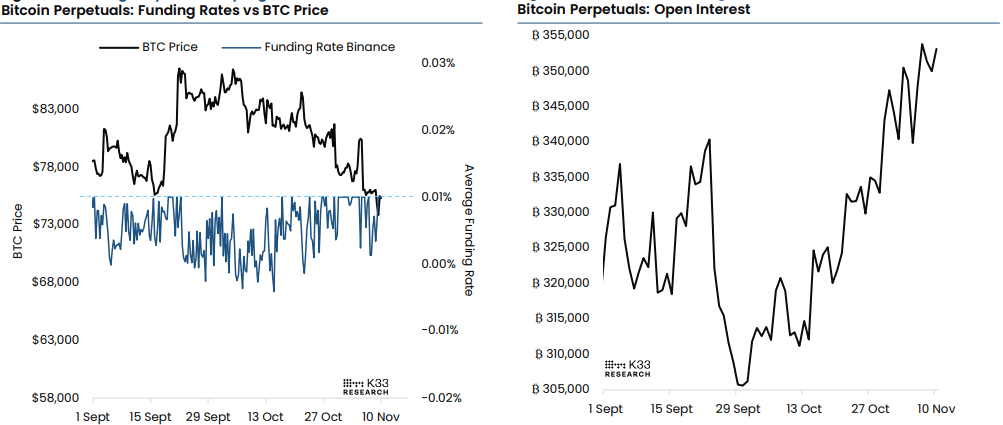
BTC perpetual futures open interest (OI) totals 353,000 BTC, according to K33 Research, placing it in the 99th percentile of readings over the last two years. Over the past week, annualised funding rates have averaged 8.4%. This points to continued demand for long positions as BTC approaches key support levels.
The analyst concluded: “Historically, similarly elevated open interest has coincided with price extremes and periods of substantial volatility, often preceding sharp reversals. While elevated leverage provided fuel for upside moves in June and August, current positioning appears less directional, leaving considerable scope for volatility in either direction. A breakdown could trigger substantial long liquidations, while a recovery could fuel short covering, amplifying price moves as leveraged positions unwind,”
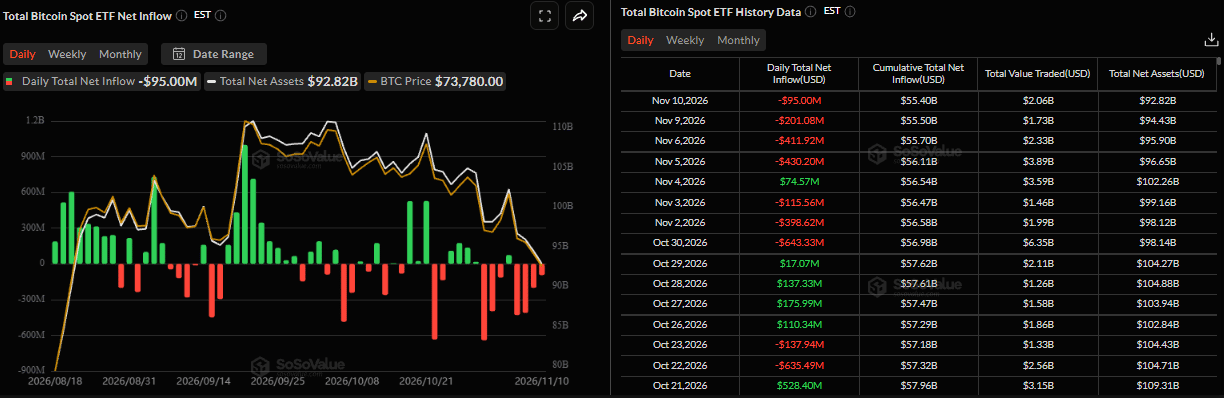
Net withdrawals from BTC spot ETFs amounted to $95 million on Tuesday, SoSoValue data show, taking the run of outflows that began last week to four consecutive days. The figures reflect a further weakening of institutional appetite for Bitcoin so far this week. Should withdrawals persist and gather pace through the remainder of the week, BTC could face additional pressure and a deeper price correction.
Developments on the diplomatic front could lend BTC some short-term support. Following Tuesday’s meeting of G7 foreign ministers in Paris, US Secretary of State Marco Rubio said the economic campaign against Iran had inflicted sufficient damage that major combat operations were not currently needed.
US President Donald Trump also sought to ease fears of escalation after the midterm elections. He told reporters that fresh US strikes on Iran were "highly unlikely", pointing to positive momentum in negotiations aimed at ending the Middle East conflict. Iran, meanwhile, called on the US to satisfy its demands under a plan to reopen the Strait of Hormuz.
These developments encourage hopes of a diplomatic breakthrough that could end the US-Iran war. By easing concerns over geopolitical risks, they could provide Bitcoin with support in the near term.
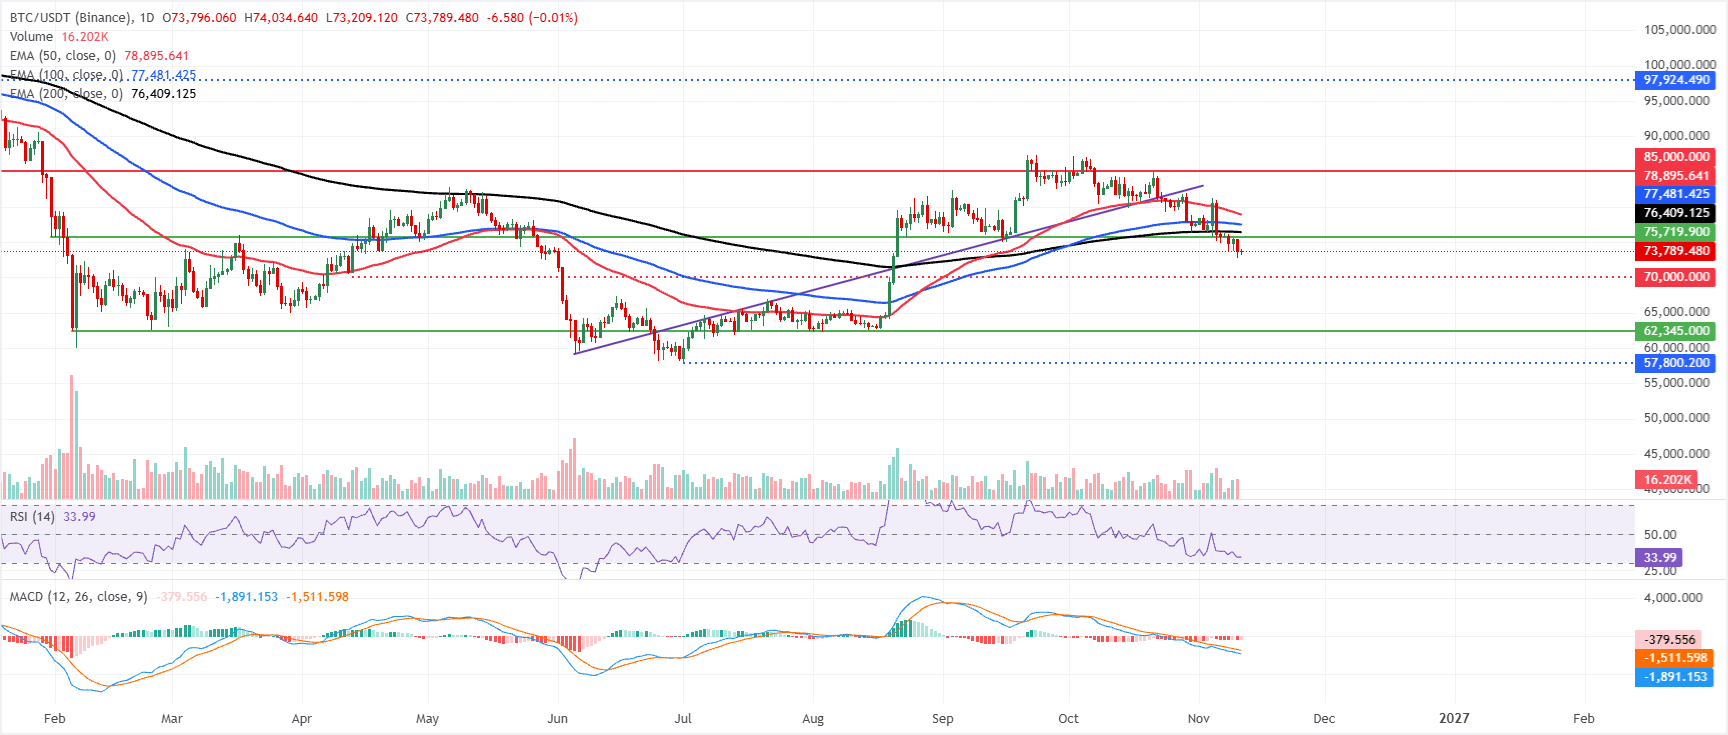
At the time of writing on Wednesday, Bitcoin stands at $73,789, with its bearish correction continuing. The price remains beneath the 50-day, 100-day and 200-day exponential moving averages (EMAs), which are grouped between roughly $76,400 and $78,900.
The technical picture points to selling into rallies. On the daily chart, the Relative Strength Index (RSI) sits near 33, just above oversold territory, while the Moving Average Convergence Divergence (MACD) histogram stays below zero. Together, these indicators underline continued downward pressure despite stretched conditions over the short term.
The first upside hurdle is the 200-day EMA at around $76,409. Beyond that lie the 100-day EMA near $77,481 and the 50-day EMA around $78,895. This tightly packed supply zone would need to be regained by bulls to temper the bearish bias. Further up, horizontal resistance around $85,000 presents a more substantial obstacle: a daily close above it would be needed to indicate a more lasting return to a positive medium-term trend.
With no nearby support identified on the chart, a breach of current levels would point BTC towards the psychological support area around $70,000 before it stabilises.
(The technical analysis of this story was written with the help of an AI tool. Know more.)
Designed to function as money, Bitcoin is a virtual currency and the largest cryptocurrency by market capitalisation. No single person, group or entity can control this payment method, removing the need for third-party involvement in financial transactions.
The term altcoin covers cryptocurrencies other than Bitcoin. Some also exclude Ethereum from the category, on the grounds that these two cryptocurrencies are the sources of forks. On that basis, Litecoin would be the first altcoin: it was forked from the Bitcoin protocol and is therefore an “improved” version of it.
A stablecoin is a cryptocurrency intended to maintain a steady price, backed by a reserve of the asset it represents. Its value is tied to a commodity or financial instrument, such as the US Dollar (USD), while an algorithm or demand governs its supply. Stablecoins primarily serve as a way for investors to move into and out of cryptocurrency trading and investment. They also offer a means of storing value, given the volatility generally associated with cryptocurrencies.
The ratio between Bitcoin’s market capitalisation and the combined market capitalisation of all cryptocurrencies is known as Bitcoin dominance. It offers a clear indication of investor interest in Bitcoin. BTC dominance is typically high ahead of and during a bull run, as investors favour a relatively stable cryptocurrency with a large market capitalisation, such as Bitcoin. When BTC dominance declines, it usually signals that investors are transferring capital and/or profits into altcoins in pursuit of greater returns. This shift generally sparks a surge in altcoin rallies.










The information provided on this website is of a general nature only and does not constitute personal financial advice. Before acting on any information on this website, you should consider the suitability of the information in relation to your objectives, financial situation and needs. Investing in CFDs and FX Margin Contracts carries significant risks and is not suitable for all investors. You may lose more than your initial deposit. You do not own, or have, any interest in the underlying asset. We recommend that you seek independent advice and ensure you fully understand the risks involved before trading. It is important that you read and consider the disclosure document before you acquire any product listed on the website. The information and advertisements offered on this website are not intended for use by any person in any country or jurisdiction where such use would be contrary to local laws and regulations. The Products and Services offered on this website are not intended for residents of the United States, Malaysia and Thailand.
TMGM is authorized and regulated in various jurisdictions.
Trademax Australia Limited, trading as TMGM, is regulated by the Australian Securities and Investments Commission (ASIC), AFSL no. 436416 and is located at Level 28, One International Tower, 100 Barangaroo Avenue, 2000 Sydney, NSW Australia.
Email: support@tmgm.com.au
Trademax Global Limited, trading as TMGM, is authorized and regulated by the Vanuatu Financial Services Commission (VFSC), registration number 40356 and registered at 1276, Kumul Highway, Port Vila, Vanuatu, Republic of Vanuatu.
Email: support@tmgm.com
Trademax Global Markets (SE) Limited, trading as TMGM, is authorized and regulated by the Financial Services Authority (FSA) of Seychelles, with license number SD224. The company is registered at Office No 13, Providence Estate ABIS Centre, Mahe, Seychelles.
Email: support@tmgm.com
Trademax Global Markets (International) Pty Ltd, trading as TMGM, is authorized and regulated by the Financial Services Commission, Mauritius (FSC) with license no. GB22201012, and registered at 33, Edith Cavell Street C/o IQ EQ Fund Services (Mauritius) Ltd Port Louis, 11324 Mauritius.
Email: support@tmgm.com
Copyright © TMGM. All rights reserved


