


Best Gold ETF in India in 2026 Ranked by Our Liquidity First Weighted Score
To clear things up for most users, when people talk about gold SIP fund, gold mutual funds, and gold savings fund, they are likely talking about Gold ETF, but if they say gold equity fund, that’s gold stocks (usually mining stocks). Note that gold SIP can mean anything since sip means Systematic Investment Plan and does not specify the instrument.
Here are the top 5 Gold ETF in India in 2026 ranked by Liquidity, Expense Ratio, AUM, Consistency and Gold ETF Returns used in the ranking.
Ranking logic used: Liquidity first, then expense ratio, then AUM, then consistency, then one year returns. This aligns with how ETF trading costs show up in real execution, because higher volume tends to mean a tighter bid ask spread.
Overview of the Top Gold ETF in India by Weighted Score
The top 5 gold ETFs in India are ranked using a weighted score that prioritizes liquidity, followed by expense ratio, AUM, consistency and one year returns.
This gives a more practical assessment of each ETF because the score reflects factors that affect actual trading and holding outcomes, not just recent performance.
Top 5 Gold Mutual Funds in India Ranked by TMGM Weighted Scoring System
Data Source: NSE price and volume data, AMFI, AMC factsheets and public fund databases (Apr to May 2026). TMGM weighted score uses a proprietary liquidity first model.
Nippon Gold ETF (GOLDBEES)
Nippon Gold ETF ranks first in the weighted score system because it has the strongest liquidity and the largest AUM among the top 5 gold ETFs in India. Its trading volume of 141,941,218 is far ahead of the other ETFs, which gives it a major advantage in execution quality.
The fund has an expense ratio of 0.8%, which is the highest among the top 5. However, the weighted score ranks liquidity first because it allows quick selling together with better spread.
Its AUM of ₹48,953.2 crore also supports its position as the strongest all round option in the ranking. A larger AUM can indicate broader investor participation, stronger market presence and better fund scale.
Its consistency score, measured by standard deviation, is 54.92, which is competitive within the group. Its one year return is 88.44%, slightly lower than some peers, but the ranking does not treat the highest return as the only deciding factor.
Why it ranks first
Liquidity: Nippon Gold ETF has the highest trading volume in the top 5, making it the strongest ETF for investors who care about execution quality.
AUM: It has the largest AUM in the ranked group, giving it the strongest fund size profile.
Cost: Its 0.8% expense ratio is higher than peers, so cost sensitive long term investors should compare this carefully.
Best suited for: Investors who want the most liquid gold ETF in the list and are willing to accept a higher expense ratio for stronger trading depth.
SBI Gold ETF
SBI Gold ETF ranks second because it offers a balanced profile across liquidity, fund size, expense ratio and returns. Its trading volume of 30,968,398 is much lower than Nippon Gold ETF, but it is still one of the stronger liquidity profiles in the top 5.
The fund has an expense ratio of 0.7%, which is lower than Nippon Gold ETF but higher than Kotak, ICICI Prudential and HDFC Gold ETF. This places SBI Gold ETF in the middle of the cost range.
Its AUM of ₹21,471.7 crore makes it one of the larger funds in the list. This gives SBI Gold ETF a strong fund size base, although it does not match Nippon Gold ETF in scale.
The ETF has a consistency score of 55.96 and a one year return of 88.6%. Its return is close to Nippon Gold ETF, while its expense ratio is slightly lower.
Why it ranks second
Liquidity: SBI Gold ETF has strong trading volume, although it is far below Nippon Gold ETF.
AUM: Its AUM is large enough to support a strong market presence among Indian gold ETFs.
Cost: Its 0.7% expense ratio is more competitive than Nippon Gold ETF but not the lowest in the top 5.
Best suited for: Investors who want a large, established gold ETF with balanced liquidity, fund size and cost.
Kotak Gold ETF
Kotak Gold ETF ranks third because it combines a lower expense ratio with reasonable AUM and competitive one year returns. Its trading volume of 8,520,264 is weaker than Nippon, SBI and ICICI Prudential, which affects its weighted score because liquidity receives the highest priority.
The fund has an expense ratio of 0.55%, making it more cost efficient than Nippon and SBI. This can make Kotak Gold ETF more appealing for investors who want lower annual fund costs while still staying within a large gold ETF option.
Its AUM of ₹12,814.1 crore gives it a solid fund size base, although it is smaller than Nippon, SBI and ICICI Prudential. Its consistency score is 55.76, which is close to SBI and slightly weaker than Nippon and HDFC.
Kotak Gold ETF has a one year return of 89.32%, which is among the higher returns in the top 5. However, the weighted score keeps it below SBI because its liquidity and AUM are lower.
Why it ranks third
Liquidity: Kotak Gold ETF has moderate liquidity compared with the higher ranked ETFs.
Cost: Its 0.55% expense ratio is one of its strongest advantages.
AUM: Its AUM is solid, but not as large as Nippon, SBI or ICICI Prudential.
Best suited for: Investors who want a lower cost gold ETF with reasonable scale and competitive recent performance.
ICICI Prudential Gold ETF
ICICI Prudential Gold ETF ranks fourth even though it has the lowest expense ratio and the highest one year return in the top 5. This shows why the weighted score does not rank gold ETFs based on return alone.
The fund has a trading volume of 22,159,198, which gives it stronger liquidity than Kotak and HDFC. It also has an expense ratio of 0.5%, making it one of the lowest cost ETFs in the ranked list.
Its AUM of ₹22,512.3 crore is also strong and slightly higher than SBI Gold ETF. From a cost and fund size perspective, ICICI Prudential Gold ETF has a strong profile.
The main weakness is its consistency score of 57.04, which is the weakest among the top 5. Since lower standard deviation is better for consistency, this reduces its ranking even though its one year return of 89.36% is the highest in the group.
Why it ranks fourth
Liquidity: ICICI Prudential Gold ETF has strong trading volume, ranking ahead of Kotak and HDFC on liquidity.
Cost: Its 0.5% expense ratio is one of the lowest in the top 5.
AUM: Its AUM is strong and supports its position as a major gold ETF option.
Best suited for: Investors who prioritize low expense ratio, strong AUM and recent returns, but still want to compare consistency before choosing.
HDFC Gold Exchange Traded Fund
HDFC Gold Exchange Traded Fund ranks fifth in the weighted score system. Its main strengths are low cost and better consistency, but its lower liquidity keeps it behind the other gold ETFs in the top 5.
The fund has a trading volume of 4,204,498, which is the lowest among the ranked ETFs. Since liquidity receives the highest weight, this has a direct impact on its final ranking.
Its expense ratio of 0.5% makes it one of the lowest cost options in the top 5. This can appeal to investors who plan to hold their gold ETF exposure for a longer period and want to reduce annual fund cost.
Its AUM of ₹11,873.3 crore is also the lowest in the top 5, although it remains a sizable fund. Its strongest data point is consistency, with a standard deviation of 55.45, the best among the ranked ETFs. Its one year return is 89.32%, matching Kotak Gold ETF in the table.
Why it ranks fifth
Liquidity: HDFC Gold ETF has the lowest trading volume among the top 5, which reduces its weighted score.
Cost: Its 0.5% expense ratio is a clear strength for cost conscious investors.
Consistency: It has the best consistency score among the top 5 based on standard deviation.
Best suited for: Investors who value low cost and consistency more than high trading volume.
Honorable Mentions
While the weighted list highlights balanced performers, some investors might prefer choices with specific considerations like Highest Liquidity or Lowest Cost across all ETFs. Here are 2 examples below:
Highest Liquidity (Scalping/Intraday): Tata Gold ETF. With a volume of 259,442,713, it vastly outperforms peers in execution capability, ensuring tight bid-ask spreads. It also boasts the best consistency with a Standard Deviation of 12.71.
Lowest Cost (Long-Term Holding): Zerodha Gold ETF (GOLDCASE). The 0.30% expense ratio minimizes the "cost drag" on your portfolio over multi-year horizons.
Pro Tip: Do not strictly chase the highest "1 Yr Returns." Since all gold ETFs track physical gold prices, slight deviations in returns often indicate higher Tracking Error rather than superior fund management.
How to Use TMGM Weighted Score Best Gold ETF Table
It is a decision matrix that guides your decision.
1. Weighted Score
The Weighted Score is a composite metric derived from our proprietary algorithm. It balances Liquidity (40% weight), Expense Ratio (30%), and Consistency (30%).
How to read it: If you want a low maintenance choice and you do not want to think about spreads, costs, or tracking quality, pick an ETF with a strong overall score profile (e.g., HDFC or ICICI Prudential). These tend to be the most balanced on liquidity, expenses, and tracking stability.
2. Volume vs. AUM (The ‘Size’ Trap)
Novice investors look at AUM; professional traders look at Volume.
The Trap: A fund can have massive AUM (assets) but low daily volume if most holders are inactive.
The Read: If you plan to deploy capital exceeding ₹5 Lakhs in a single trade, ignore the "Rank" and look strictly at the Volume column. You need deep order books (like Nippon or Tata) to ensure your buy order doesn't artificially spike the price (Slippage).
3. Consistency (Standard Deviation)
This column reveals the "nervousness" of the ETF.
The Read: Lower standard deviation usually means steadier tracking with less noise. Higher values can indicate more tracking variation from cash drag, creation redemption frictions, or less stable liquidity.
Our Action Plan for Beginners: Execution Strategy
Once you have analyzed the table, choose your ETF based on your holding period.
Note: Do not mix these strategies.
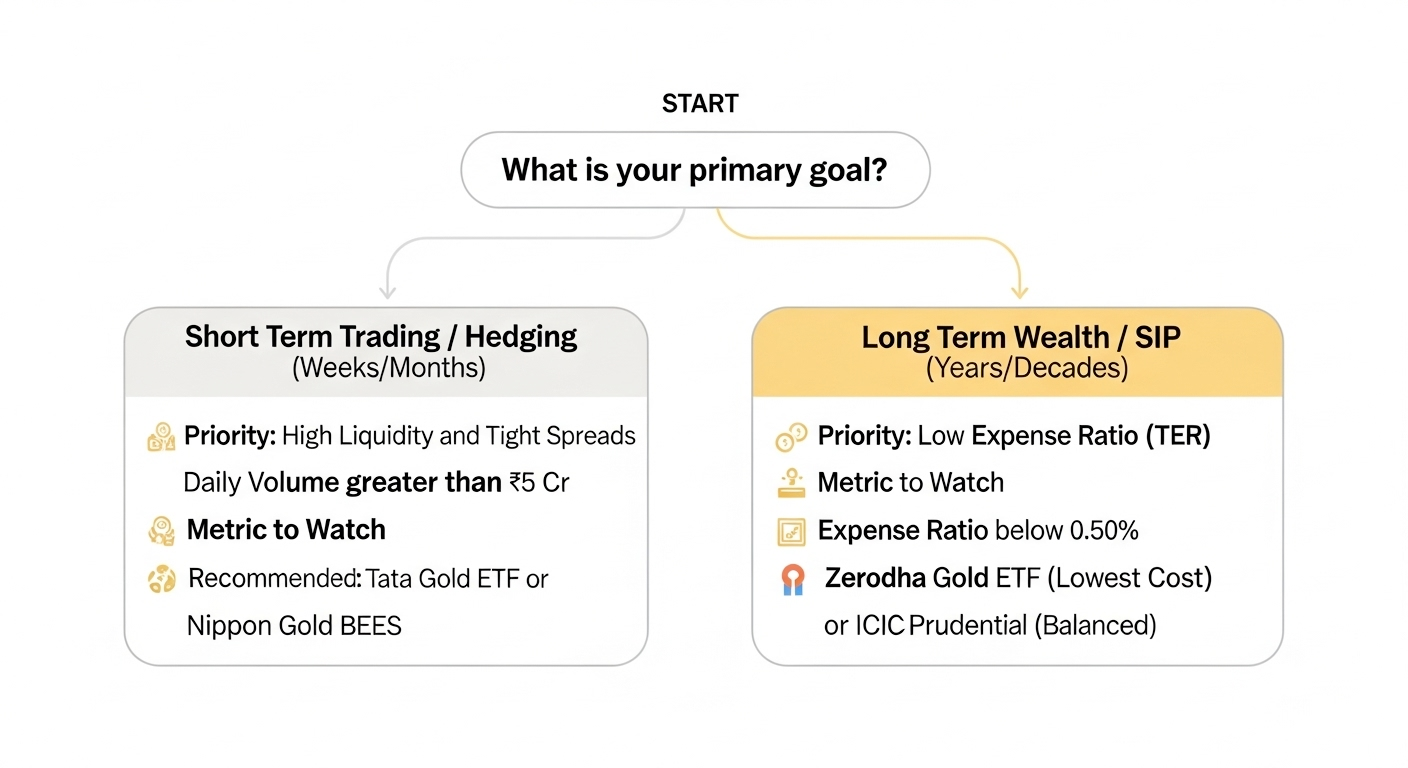
Figure 1: Goal based framework for choosing a gold ETF using two screening metrics, liquidity via daily trading volume and cost via expense ratio, with example funds for each use case.
Path A: The Tactical Trader (Weeks to Months)
Goal: Capture short-term gold price rallies or hedge equity portfolio volatility.
Priority: Liquidity. You need to enter and exit instantly without losing 0.5% to wide bid-ask spreads.
The Pick: Nippon Gold ETF (GOLDBEES) or Tata Gold ETF.
More Explanation: These 2 ETFs have the largest trading volume, so that when you need to sell quickly, your order will get filled fast with the large number of participants in the market.
The Move: Execute orders during peak market hours (11:00 AM – 2:00 PM) to ensure maximum liquidity overlap.
Path B: The Strategic Accumulator (Years to Decades)
Goal: Wealth preservation and compounding.
Priority: Expense Ratio. You are marrying the fund; divorce costs (exit loads) and maintenance (expense ratios) matter most.
The Pick: Zerodha Gold ETF (for lowest cost) or ICICI Prudential (for balanced performance).
The Move: Ignore daily volume fluctuations. Use a Systematic Investment Plan (SIP) or buy on dips. The 0.30% - 0.50% annual savings will compound significantly over 10+ years.
Important: Never use a "Market Order" when buying ETFs with lower volumes (Rank 3-5). Always use a "Limit Order" placed slightly above the best bid to avoid getting filled at a bad price due to momentary illiquidity.
How to Choose the Best Gold ETF? Important Considerations
Determining which gold scheme is best requires a fundamental understanding of what a gold etf is, how it works and its risks to make an informed decision before investing. The following factors are ranked by order of importance for a sophisticated investor.
1. Liquidity (Trading Volume)
Liquidity is the paramount metric. It dictates your ability to enter or exit a position at the current NAV (Net Asset Value) without slippage.
The Metric: Daily Average Trading Volume.
Why it matters: In volatile markets, low-volume ETFs suffer from wide bid-ask spreads. You might see a price of ₹6000 but only find buyers at ₹5980. Nippon Gold ETF and Tata Gold ETF have large liquidity pockets (huge trading volume), hence providing sufficient depth to absorb large orders without price distortion.
2. Expense Ratio (Total Expense Ratio - TER)
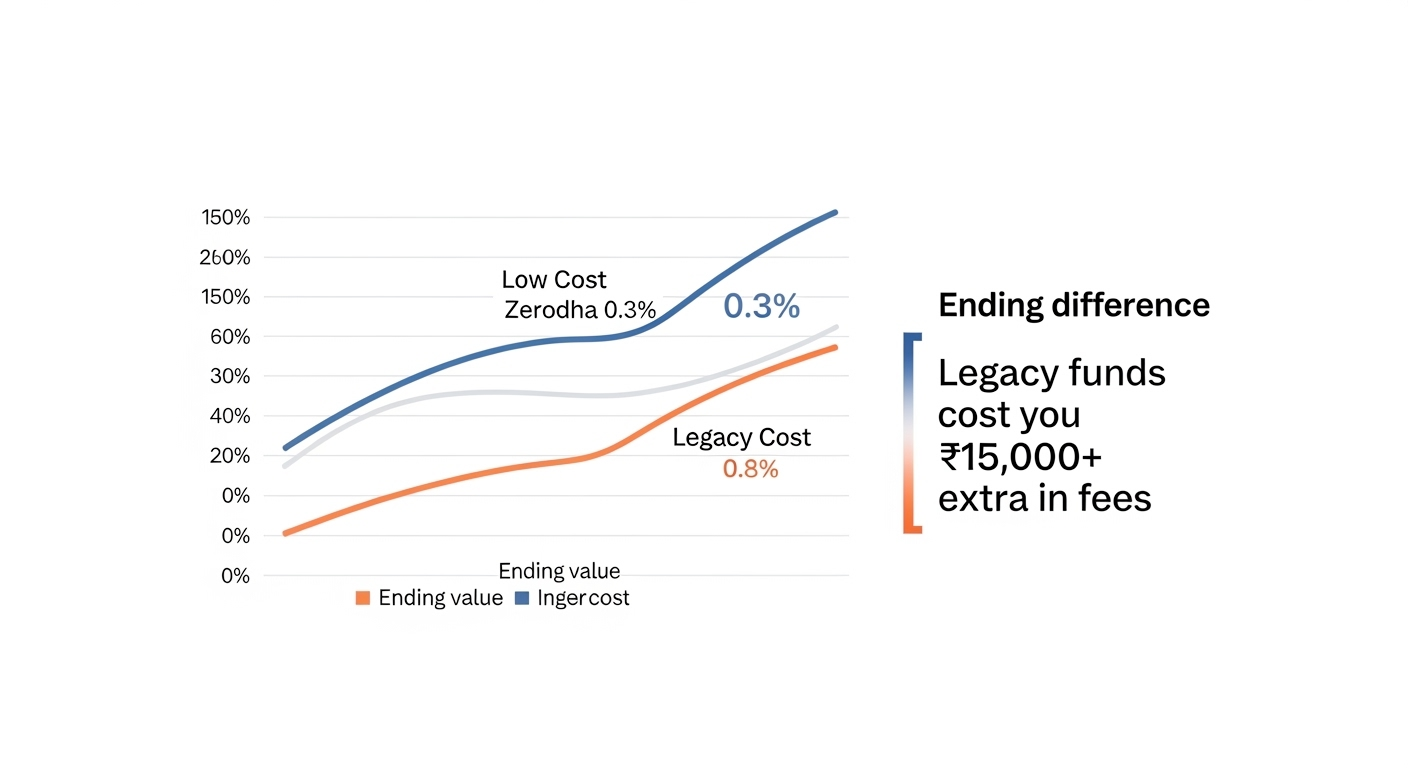
Figure 2: Cost drag illustration showing how a lower expense ratio can compound to a higher ending value, with the final gap highlighting the estimated extra fees from higher cost funds.
The TER is the annual fee deducted from the fund’s assets.
The Metric: Percentage per annum.
Analysis: Over a 10-year period, a 0.5% difference in TER can erode significant capital due to compounding. Zerodha (0.30%) and ICICI (0.5%) are superior to legacy funds charging 0.8% or more.
3. Assets Under Management (AUM)
While not a direct performance metric, AUM indicates survivability.
The Threshold: Funds with AUM > ₹1,000 Cr are generally safe from closure or merger risks. High AUM also typically correlates with better liquidity with Authorized Participants (APs).
4. Consistency (Tracking Fidelity)
This measures how closely the ETF follows the benchmark spot gold price.
The Metric: Standard Deviation of Returns.
Analysis: A lower standard deviation (like Tata’s 12.71) implies the fund manager is efficiently managing cash drag and inflows/outflows, resulting in precise tracking.
5) One year returns (lowest priority)
One year returns mainly reflect the gold price regime, so it is easy to overfit on a hot year. Use it as context, not the deciding factor, unless two ETFs are near identical on liquidity and cost.
6) Tracking Error (The Hidden Cost)
While Expense Ratio is explicit, Tracking Error is an implicit cost that can erode capital. It measures the standard deviation of the difference between the ETF's returns and the actual domestic spot price of gold.
The Reality: No ETF tracks the benchmark perfectly due to cash holdings (for redemptions) and accrued expenses.
The Strategy: Do not just look for "high returns." A Gold ETF outperforming physical gold is just as alarming as one underperforming it, as it indicates a breakdown in the fund's replication strategy. Always prioritize the lowest tracking error, as this proves the fund manager is efficiently managing inflows and outflows without cash drag.
Pro Tip: High volume often solves high tracking error. ETFs with deep liquidity allow Authorized Participants to arbitrage price differences faster, keeping the ETF price glued to the spot price.
Fees and Tax Reality for Gold ETFs in India
Fees you actually pay
Your total cost is Expense Ratio + Trading Friction. Trading friction is mostly the bid ask spread and market impact, which tends to be lower in high volume ETFs.
The Purity Standard: According to SEBI's regulations for Gold ETFs, funds must value their underlying gold based on 0.995 fineness (99.5% purity). This ensures that the asset quality is identical across all schemes, leaving tracking error as the only differentiator.
Tax treatment
Tax Reality Post-July 2024: As per the Finance (No. 2) Act, 2024, listed Gold ETFs held for more than 12 months are now classified as Long Term Capital Assets taxed at 12.5% (flat), replacing the old 36-month requirement.
Across recent explainers, gold ETF gains are commonly presented as short term taxed at your slab if sold within 12 months, and long term taxed at a flat rate after 12 months, without indexation in those summaries. Always check the latest rule set before publishing hard numbers.
Gold CFDs as a simpler trading alternative for active traders
For short to medium term traders/investors, Gold CFDs are often superior to ETFs. They remove management fees, allow you to trade price movements in either direction, and provide easy access to leverage.
Gold CFD Cost
With a gold CFD, you do not pay an ETF expense ratio. Your costs are usually priced directly into the trade:
• Spread and slippage: The cost shows up as the bid ask spread and slippage, but with TMGM’s Tier 1 Liquidity Provider and NY4 Servers, we guarantee 0.0 pip spread, and the best possible pricing in the whole CFD industry.
• Commission: Many brokers charge a separate commission, however, TMGM’s Classic Account guarantees 0 commission on your trades, and we have specially curated Islamic Account for Shariah Compliance as well.
• Overnight financing: If you hold positions overnight, you typically pay (or receive) a daily financing charge, which can become the main cost for longer holding periods.
Why some traders prefer CFDs over ETFs
• Profit in both directions: You can go long if you expect gold to rise, or short if you expect it to fall, without borrowing units.
• Lower entry barrier with leverage: You can control a larger notional position with a smaller margin deposit. This can amplify gains, but it also amplifies losses.
• Fast execution: You can open and close positions quickly without needing to compare multiple ETF schemes, tracking differences, or fund level fee structures.
Bottom Line
If you are trading for weeks or months, a gold CFD can be a strong alternative because it is built for active execution, supports both long and short positions, and makes your costs easier to see at the trade level rather than embedded in fund expenses. If you are investing for years, gold ETFs reward simplicity: pick high liquidity and a low expense ratio to reduce hidden spread costs and long run tracking drag.
Use this rule of thumb:
Trading or tactical hedging (weeks to months): prioritise volume first and use Nippon Gold ETF (GOLDBEES) or the highest liquidity option in your dataset like Tata Gold ETF, then execute with limit orders during peak hours.
Long term allocation (years): prioritise expense ratio first and consider Zerodha GOLDCASE for lowest cost, or ICICI Prudential Gold ETF if you want a more balanced profile.
Whatever you choose, treat any ETF that wins mainly because of “high 1 year returns” with suspicion. In gold ETFs, unusual return gaps often point to tracking frictions, not superior management.
FAQ for Best Gold ETF in India
Which gold ETF is best in India?
The best choice is usually the ETF with the highest consistent trading volume and a tighter typical bid ask spread, because volume and assets are linked to execution cost. (Source: Financial Planning Association)
Which gold scheme is best: Gold ETF or SGB?
If you prioritise easy entry and exit on exchange, gold ETFs usually fit better. If you prioritise a different holding structure and are comfortable with different liquidity mechanics, SGBs can be considered as a separate category.
What matters more: expense ratio or one year returns for the best gold ETF?
Expense ratio matters more for long term holding because it compounds as tracking drag, while one year returns mostly reflect the gold cycle. Use returns only after you have filtered for liquidity and costs. (Source: Lazard Asset Management)
Which Gold SIP is best?
The best Gold SIP is usually a SIP in a gold mutual fund or a gold fund of fund that invests in gold ETFs with low expense ratio, strong tracking efficiency, and consistent fund house credibility. A Gold ETF itself is bought through a demat and trading account, so investors usually cannot set up a traditional SIP in the ETF directly unless their broker supports scheduled ETF purchases.


