


Key Takeaways
01. A valid flag pattern has 3 core parts: the flagpole, the counter trend channel, and the breakout.
02. A bull flag forms in an uptrend, while a bear flag forms in a downtrend.
03. Most traders approach the setup with either a breakout entry or a retest entry.
04. The pattern works best in liquid, trending markets.
Types and Structure of Flag Patterns
The two main versions of Flag Patterns are the bullish flag and the bearish flag.
Bullish Flag
A bullish flag forms after a sharp upward move. Price then pulls back or drifts sideways inside a narrow channel before breaking upward again, which signals that buyers are still controlling the trend.
Bearish Flag
A bearish flag forms after a strong downward move. Price then rebounds modestly inside a rising or flat channel before breaking lower, which signals that sellers are still controlling the trend.
What Are the Core Components of a Flag Pattern and How Does It Work?
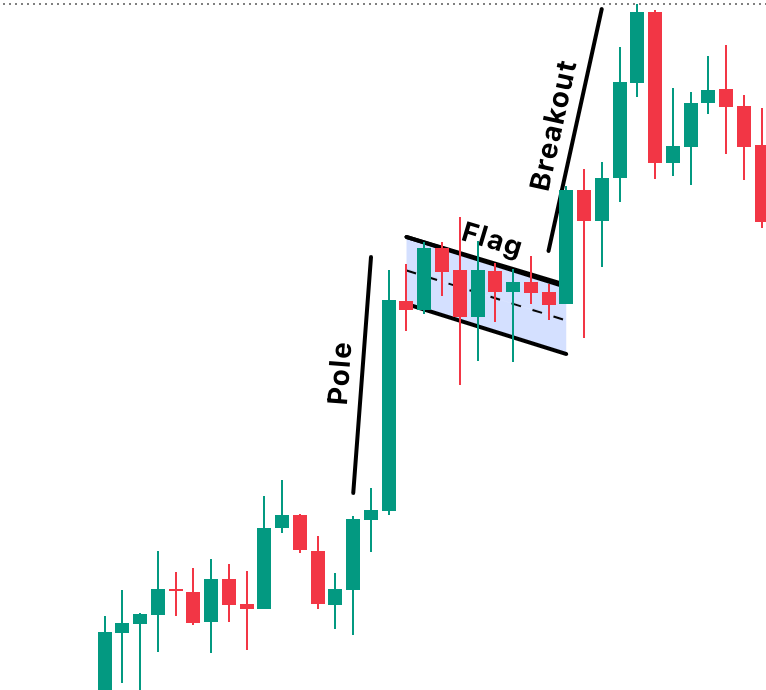
A flag pattern has 3 core components: the flagpole, the flag, and the breakout.
It works as a continuation setup where the price first makes a strong directional move, then pauses in a tight counter trend channel, and finally resumes the original trend when the breakout confirms momentum recovery.
1. Flagpole
The flagpole is the sharp impulse move that starts the setup. It should be clear, directional, and ideally supported by strong participation, because weak or choppy moves reduce the reliability of the pattern.
2. Flag
The flag is the consolidation phase. In a valid setup, price stays inside two roughly parallel trendlines that slope slightly against the earlier move.
3. Breakout
The breakout is the confirmation point. In a bull flag, price breaks above the upper boundary, and in a bear flag, price breaks below the lower boundary, ideally with stronger volume than during consolidation.
Important: If the consolidation starts converging instead of staying roughly parallel, reassess it as a pennant rather than a flag.
The internal mechanism is simple: early traders lock in profits after the first impulse, price cools, and the market tests whether the opposite side has enough strength to reverse the move. If that counter move stays controlled and the breakout returns in the original direction, the market is showing that the prior trend still has sponsorship.
Flag Pattern Trading Strategy
A trader first needs context, not just shape. The best flag setups appear in markets with a clear trend, clean structure, and enough volume to make the breakout meaningful rather than random noise.
Strategy and Approach
Map the structure clearly. Draw the flagpole, then define the consolidation channel with trendlines. If the channel is messy, too wide, or lacks a clear prior impulse, skip the setup.
Choose the entry style. Aggressive traders enter on the breakout close, while conservative traders wait for a retest of the broken boundary. Both approaches depend on confirmation from price behavior and volume.
Place the stop loss logically. For a bull flag, the stop usually sits below the lower side of the flag or the recent swing low. For a bear flag, it usually sits above the upper side of the flag or the recent swing high.
Project the target from the flagpole. Traders can use the height of the flagpole as the potential price move, or use the stop loss distance to target a 2R risk to reward ratio.
Use confirmation tools, not clutter. Volume is the main confirmation tool. Using higher time frame trend direction, a 20 EMA, or ATR based stop placement can improve execution quality.
Pro Tip: The cleanest flag trades usually happen when the breakout direction matches the higher time frame trend and volume expands on the trigger candle.
Real Life Example of Flag Pattern Trading
This BTCUSD chart shows a clear bull flag pattern. On 8 May 2025, BTCUSD printed a strong bullish candle that formed the flagpole. Price then consolidated from 10 May to 17 May inside a short downward sloping channel, which formed the flag.
The setup was confirmed when BTCUSD broke above the flag resistance. Price then retested the breakout area before pushing higher again, showing how a bull flag can develop in stages: strong impulse, controlled consolidation, breakout, retest, and continuation.
Common Beginner Mistakes when Trading Flag Pattern
Entering before confirmation. Many traders anticipate the breakout and get trapped when price stays inside the pattern.
Ignoring volume behavior. Falling participation during the flag and stronger participation on the break help validate the setup.
Forcing the pattern. If the structure is too long, too wide, or stops looking parallel, it may no longer be a flag.
These mistakes explain why some traders think flags do not work, when the real problem is usually poor pattern selection or weak execution rather than the concept itself.
Flag Pattern vs Pennant Pattern
A flag pattern and a pennant pattern are both continuation setups, but they are not identical. A flag consolidates inside roughly parallel lines, while a pennant consolidates inside converging lines that resemble a small symmetrical triangle.
This distinction matters because the structure changes how traders draw boundaries, judge breakout timing, and classify the setup. If a trader mistakes a pennant for a flag, the pattern may still be tradable, but the entry logic and visual confirmation are no longer being read correctly.
FAQ for Flag Pattern Trading
Is a flag pattern bullish or bearish?
It can be either. A bull flag forms during an uptrend and breaks upward, while a bear flag forms during a downtrend and breaks downward.
What invalidates a flag pattern?
A missing or weak flagpole, a messy channel, a breakout without convincing confirmation, or a consolidation that stretches too long can all reduce validity. In some cases, the structure stops being a flag and starts behaving more like a rectangle or triangle.
Do flag patterns work on all time frames?
Traders use them across multiple time frames, from intraday charts to longer swing charts, because the logic is based on trend, pause, and breakout. Even so, cleaner trends and more liquid conditions usually produce better quality setups.


