

Trading
Explore a wide range of markets with competitive pricing, deep liquidity, and advanced trading tools.
Learn More 
Platform
Trade seamlessly with TMGM's powerful platform, built for speed, precision, and a superior trading experience.
Learn More Trading Platform
Academy
Learn the fundamentals of trading with beginner-friendly resources, including guides, webinars, and market insights.
Learn More News & Analysis
Get real-time market updates and expert analysis to stay ahead of trading opportunities
Learn More News & Analysis
About
Learn what sets TMGM apart — our global presence, regulatory strength, and commitment to innovation in trading.
Learn More Why Choose TMGM
Sponsorship
Silver Price Forecast: XAG/USD falls like house of cards on Fed’s hawkish narrative
- Silver price dives over 4% to near $61 due to elevated US Treasury Yields.
- The Fed is highly anticipated to hike interest rates again this year.
- This week, the US NFP data will be the key trigger for global markets.
Silver price (XAG/USD) is down 4.3% to near $61.50 during the European trading session on Monday. The white metal nosedives as elevated United States (US) Treasury Yields have diminished its appeal.
At press time, 10-year US Treasury Yields are close to its 19-year high of 5.23% posted on Friday.
Higher oil prices due to persistent disruption in the global energy supply amid Middle East conflicts and the increased possibility of more interest rate hikes by the Federal Reserve (Fed) in the near term have prompted US Treasury Yields.
US data resilience lifts Yields as Fed tightening narrative builds
Analysts at Deutsche Bank highlight that, alongside recent energy moves, “another factor lifting bond yields yesterday was the ongoing resilience in the economic data.” They point to US weekly initial jobless claims, which came in at “just 197k in the week ending September 19 (vs. 200k expected),” underscoring the strength of the labour market. Deutsche Bank notes that this release is “one of the timeliest indicators we get on the state of the labour market,” and that it has pushed “the 4-week moving average (which Fed Chair Warsh has previously cited) down to 202.25k.” In their view, these developments “played into the current narrative that the US economy is growing strongly, which in turn would give the Fed the space to keep hiking rates.”
Currently, the CME FedWatch tool shows an almost 68% chance that the Fed will hike interest rates again in the October policy meeting.
Next trigger is US NFP
This week, the strength of hawkish Fed expectations will be tested by the US Nonfarm Payrolls (NFP) data for September, which will be released on Friday. The US NFP report will likely show that the economy created 100K fresh jobs, lower than 162K in August.
Silver Technical Analysis
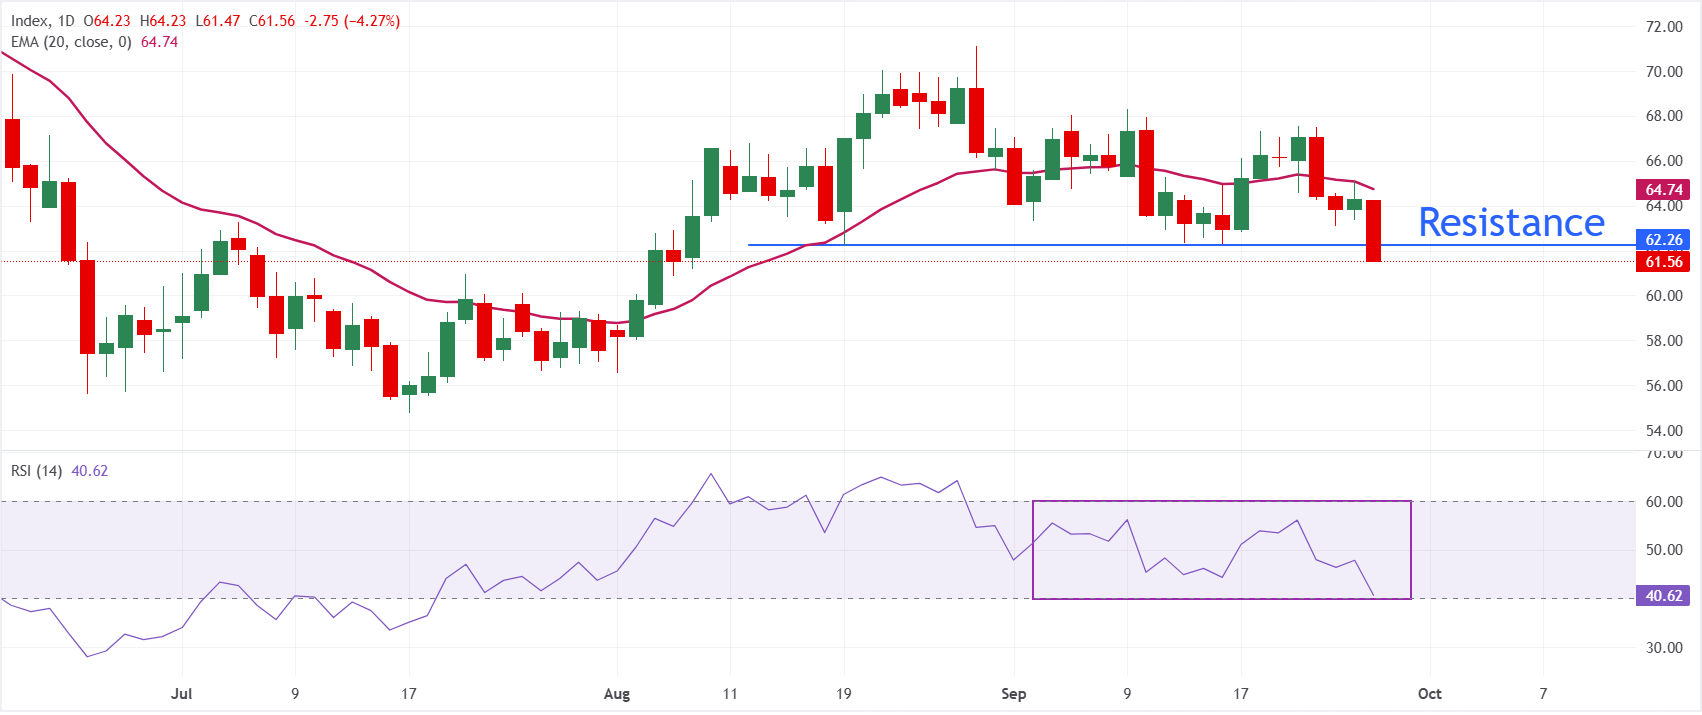
In the daily chart, XAG/USD trades at $61.50, keeping a bearish near-term bias as it holds below the 20-day exponential moving average (EMA) at $64.74. The pair has retreated from recent highs and remains capped by this short-term trend indicator, while the Relative Strength Index (RSI) at 40.61 stays below the neutral 50 line, hinting at lingering downside pressure rather than an oversold extreme.
On the topside, immediate resistance is located at $62.26, followed by the 20-day EMA at $64.74, and a daily close above this barrier would be needed to ease the current bearish tone. On the downside, the white metal could extend its decline towards $60.00
(The technical analysis of this story was written with the help of an AI tool. Know more.)
Silver FAQs
Silver is a precious metal highly traded among investors. It has been historically used as a store of value and a medium of exchange. Although less popular than Gold, traders may turn to Silver to diversify their investment portfolio, for its intrinsic value or as a potential hedge during high-inflation periods. Investors can buy physical Silver, in coins or in bars, or trade it through vehicles such as Exchange Traded Funds, which track its price on international markets.
Silver prices can move due to a wide range of factors. Geopolitical instability or fears of a deep recession can make Silver price escalate due to its safe-haven status, although to a lesser extent than Gold's. As a yieldless asset, Silver tends to rise with lower interest rates. Its moves also depend on how the US Dollar (USD) behaves as the asset is priced in dollars (XAG/USD). A strong Dollar tends to keep the price of Silver at bay, whereas a weaker Dollar is likely to propel prices up. Other factors such as investment demand, mining supply – Silver is much more abundant than Gold – and recycling rates can also affect prices.
Silver is widely used in industry, particularly in sectors such as electronics or solar energy, as it has one of the highest electric conductivity of all metals – more than Copper and Gold. A surge in demand can increase prices, while a decline tends to lower them. Dynamics in the US, Chinese and Indian economies can also contribute to price swings: for the US and particularly China, their big industrial sectors use Silver in various processes; in India, consumers’ demand for the precious metal for jewellery also plays a key role in setting prices.
Silver prices tend to follow Gold's moves. When Gold prices rise, Silver typically follows suit, as their status as safe-haven assets is similar. The Gold/Silver ratio, which shows the number of ounces of Silver needed to equal the value of one ounce of Gold, may help to determine the relative valuation between both metals. Some investors may consider a high ratio as an indicator that Silver is undervalued, or Gold is overvalued. On the contrary, a low ratio might suggest that Gold is undervalued relative to Silver.
POPULAR ARTICLES
1New Zealand Dollar gains despite hawkish Fed tone, Middle East tensions2EUR/USD: Inflation-driven stabilisation hopes – ING3EUR/GBP Price Forecast: Fails at 0.8610 amid higher Oil prices, BoE hawkishness4Australian Dollar: Hawkish RBA hike expectations – ING5USD/CAD Price Forecast: Holds gains above 1.4150, while technicals flag overbought risk6Indonesian Rupiah: Rate support erodes as outflows resume – MUFG7Forex Today: Gold slumps below $4,200 on hawkish Fed outlook, Mideast tensions8Silver Price Forecast: XAG/USD falls like house of cards on Fed’s hawkish narrative9Euro: Rate uncertainty and energy costs weigh – HSBC
LIVE QUOTES


ALL ABOUT FOREX
What Is an Islamic Account in Forex?
Best Indicators for Forex Trading and How to Use Them
The Top 10 Most Traded Currency Pairs in the World
What are the Major Forex Pairs? 7 Major Currency Pairs in the World
5 Best Forex Trading Apps In India In 2026
Top 15 Weakest Currencies in the World
Best Time to Trade Forex
Forex Trading Regulations in India
How to Start Forex Trading in India: A Guide for Beginners
Get Started!
Sign up and access the Global Markets in less than 3 minutes

Connect With Us












The information provided on this website is of a general nature only and does not constitute personal financial advice. Before acting on any information on this website, you should consider the suitability of the information in relation to your objectives, financial situation and needs. Investing in CFDs and FX Margin Contracts carries significant risks and is not suitable for all investors. You may lose more than your initial deposit. You do not own, or have, any interest in the underlying asset. We recommend that you seek independent advice and ensure you fully understand the risks involved before trading. It is important that you read and consider the disclosure document before you acquire any product listed on the website. The information and advertisements offered on this website are not intended for use by any person in any country or jurisdiction where such use would be contrary to local laws and regulations. The Products and Services offered on this website are not intended for residents of the United States, Malaysia and Thailand.
TMGM is authorized and regulated in various jurisdictions.
Trademax Australia Limited, trading as TMGM, is regulated by the Australian Securities and Investments Commission (ASIC), AFSL no. 436416 and is located at Level 28, One International Tower, 100 Barangaroo Avenue, 2000 Sydney, NSW Australia.
Email: support@tmgm.com.au
Trademax Global Limited, trading as TMGM, is authorized and regulated by the Vanuatu Financial Services Commission (VFSC), registration number 40356 and registered at 1276, Kumul Highway, Port Vila, Vanuatu, Republic of Vanuatu.
Email: support@tmgm.com
Trademax Global Markets (SE) Limited, trading as TMGM, is authorized and regulated by the Financial Services Authority (FSA) of Seychelles, with license number SD224. The company is registered at Office No 13, Providence Estate ABIS Centre, Mahe, Seychelles.
Email: support@tmgm.com
Trademax Global Markets (International) Pty Ltd, trading as TMGM, is authorized and regulated by the Financial Services Commission, Mauritius (FSC) with license no. GB22201012, and registered at 33, Edith Cavell Street C/o IQ EQ Fund Services (Mauritius) Ltd Port Louis, 11324 Mauritius.
Email: support@tmgm.com
Copyright © TMGM. All rights reserved