

Trading
Explore a wide range of markets with competitive pricing, deep liquidity, and advanced trading tools.
Learn More 
Platform
Trade seamlessly with TMGM's powerful platform, built for speed, precision, and a superior trading experience.
Learn More Trading Platform
Academy
Learn the fundamentals of trading with beginner-friendly resources, including guides, webinars, and market insights.
Learn More News & Analysis
Get real-time market updates and expert analysis to stay ahead of trading opportunities
Learn More News & Analysis
About
Learn what sets TMGM apart — our global presence, regulatory strength, and commitment to innovation in trading.
Learn More Why Choose TMGM
Sponsorship
US Dollar Index Price Forecast: Further gains towards 104.00 appear likely
- The US Dollar gains ground as traders weigh the prospect of a 50 bps rate increase by the Fed.
- Friday’s release of US PPI figures for October remains in focus for investors.
- The prevailing uptrend supports additional gains towards 104.00.
The US Dollar (USD) leads its major currency peers on Thursday, barring the Japanese Yen (JPY). Its strength reflects concerns that the Federal Reserve (Fed) may step up its ongoing monetary tightening cycle to curb persistently high inflationary pressures.
How Is the US Dollar Performing Today?
Today’s percentage moves in the US Dollar (USD) against the major currencies listed are presented below. The Australian Dollar recorded the largest loss against the US Dollar.
| USD | EUR | GBP | JPY | CAD | AUD | NZD | CHF | |
|---|---|---|---|---|---|---|---|---|
| USD | 0.12% | 0.14% | -0.02% | 0.05% | 0.25% | 0.19% | -0.01% | |
| EUR | -0.12% | 0.03% | -0.14% | -0.07% | 0.13% | 0.08% | -0.13% | |
| GBP | -0.14% | -0.03% | -0.15% | -0.10% | 0.10% | 0.06% | -0.16% | |
| JPY | 0.02% | 0.14% | 0.15% | 0.05% | 0.25% | 0.20% | -0.01% | |
| CAD | -0.05% | 0.07% | 0.10% | -0.05% | 0.20% | 0.15% | -0.06% | |
| AUD | -0.25% | -0.13% | -0.10% | -0.25% | -0.20% | -0.03% | -0.27% | |
| NZD | -0.19% | -0.08% | -0.06% | -0.20% | -0.15% | 0.03% | -0.19% | |
| CHF | 0.01% | 0.13% | 0.16% | 0.01% | 0.06% | 0.27% | 0.19% |
Percentage movements between major currencies are displayed in the heat map. Select the base currency in the left-hand column and the quote currency in the top row. For instance, choosing the US Dollar on the left and following that row across to the Japanese Yen gives the percentage change for USD (base)/JPY (quote) in the corresponding cell.

A new 18-month peak of 103.08 is recorded during the session by the US Dollar Index (DXY), which tracks the Greenback against six major currencies.
Although the prospect of a larger Fed interest rate increase at the December meeting remains remote, it has provided substantial support to the United States (US) currency.
Do Waller’s remarks put a 50bp Fed hike back in focus?
Fed Governor Christopher Waller’s comments before the inflation release, rather than the figures themselves, have prompted the latest shift in market thinking, according to analysts at MUFG/BTMU. As they put it, “on this occasion the market rethink is to consider the prospect of a 50bp hike,” with that option “only now being considered because of Waller’s comments prior to the CPI report rather than the CPI report itself.” In their assessment, his suggestion that “a stronger CPI print may warrant a 50bp hike” has “sparked a debate over whether Waller had knowledge of the CPI print.”
Rates markets have been quick to reflect this reassessment, MUFG/BTMU say, noting “the OIS market now partially pricing the risk of a 50bp hike on 9th December.” A quicker policy adjustment is supported by Waller’s argument, they add, as he “makes the point that the sticky inflation and energy risks warrant the reversal of the 75bps of cuts and hence why wait two meetings to do that,” strengthening the rationale for moving faster.
Despite this, MUFG/BTMU maintain that “we remain sceptical of the need to hike by 50bps at this stage and suspect the majority will see the better risk-reward in going by 25bps.” Ahead of the FOMC meeting, they note there is “still another payrolls report (but no further CPI prints, although it’s the day after) before the FOMC meeting,” while warning that “a strong print plus a rebound in crude oil after the recent sharp drop would be one scenario of a possible more aggressive hike.”
Attention in financial markets now turns to Friday’s publication of the US Producer Price Index (PPI) figures for October.
Can the US Dollar Index Extend Its Technical Advance?
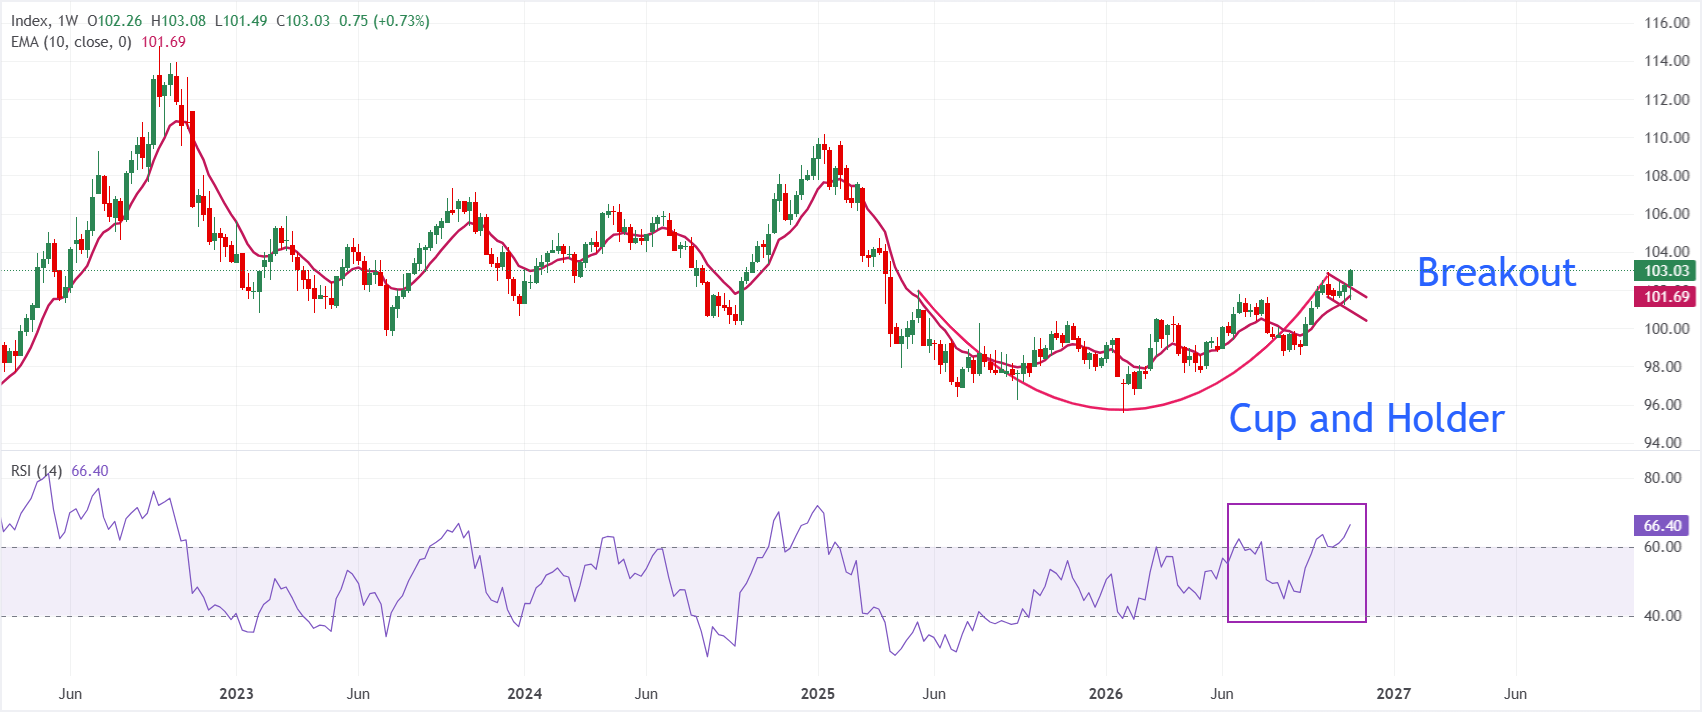
Dollar Index Spot is quoted at 103.02 on the weekly chart as the bullish breakout from the Cup and Holder formation extends. With the pair comfortably above both the 10-week Exponential Moving Average (EMA) at 101.69 and the previous channel ceiling near 102.07, the underlying support structure appears firm.
Strong upward momentum is reflected in the RSI (14) reading of 66.36, though the indicator is nearing overbought territory. The advance therefore remains constructive, but further gains could lose pace if buying pressure becomes overstretched.
The former channel ceiling near 102.07 offers the first downside support, ahead of the 10-week EMA at 101.69 and the earlier consolidation zone around 101.64. If the pullback deepens, the channel’s lower edge near 100.84 would likely come into focus, where buyers could try to regain control and maintain the broader bullish bias. Further upside could take the index towards 103.54, the high recorded on 7 April 2025, before 104.00.
(The technical analysis of this story was written with the help of an AI tool. Know more.)
Economic Data in Focus
Producer Price Index: Month-on-Month (MoM)
Published by the Bureau of Labor statistics, Department of Labor, the Producer Price Index tracks average price changes in US primary markets for commodity producers across all stages of processing. Market participants closely monitor PPI movements as a gauge of commodity inflation. A higher reading is generally regarded as positive (or bullish) for the USD, while a lower reading is considered negative (or bearish).
Learn more.Upcoming release: Fri 13 Nov 2026 13:30
Release frequency: Every month
Market consensus: 0.4%
Previous reading: 1.3%
Data source: US Bureau of Labor Statistics
POPULAR ARTICLES
1New Zealand Dollar depreciates as hawkish Fed rate hike bets lift US Dollar2British Pound holds steady following UK GDP; Yen draws support from intervention risks3S&P 500: How did the tech rally counter the post-CPI sell-off? – Deutsche Bank4US Dollar Index: Why Does Fed Pricing Favour Renewed Strength? – Deutsche Bank5After strong UK GDP figures, Euro holds broadly steady against British Pound6Why does the British Pound remain under pressure despite strong UK GDP and industrial output data?7Forex Today: Gold slips below $4,000 as US Dollar Index reaches new 19-month high8Australian Dollar sinks further below 0.6850 to lowest since January as USD remains bullish9US Dollar Index Price Forecast: Further gains towards 104.00 appear likely


Get Started!
Sign up and access the Global Markets in less than 3 minutes

Connect With Us












The information provided on this website is of a general nature only and does not constitute personal financial advice. Before acting on any information on this website, you should consider the suitability of the information in relation to your objectives, financial situation and needs. Investing in CFDs and FX Margin Contracts carries significant risks and is not suitable for all investors. You may lose more than your initial deposit. You do not own, or have, any interest in the underlying asset. We recommend that you seek independent advice and ensure you fully understand the risks involved before trading. It is important that you read and consider the disclosure document before you acquire any product listed on the website. The information and advertisements offered on this website are not intended for use by any person in any country or jurisdiction where such use would be contrary to local laws and regulations. The Products and Services offered on this website are not intended for residents of the United States, Malaysia and Thailand.
TMGM is authorized and regulated in various jurisdictions.
Trademax Australia Limited, trading as TMGM, is regulated by the Australian Securities and Investments Commission (ASIC), AFSL no. 436416 and is located at Level 28, One International Tower, 100 Barangaroo Avenue, 2000 Sydney, NSW Australia.
Email: support@tmgm.com.au
Trademax Global Limited, trading as TMGM, is authorized and regulated by the Vanuatu Financial Services Commission (VFSC), registration number 40356 and registered at 1276, Kumul Highway, Port Vila, Vanuatu, Republic of Vanuatu.
Email: support@tmgm.com
Trademax Global Markets (SE) Limited, trading as TMGM, is authorized and regulated by the Financial Services Authority (FSA) of Seychelles, with license number SD224. The company is registered at Office No 13, Providence Estate ABIS Centre, Mahe, Seychelles.
Email: support@tmgm.com
Trademax Global Markets (International) Pty Ltd, trading as TMGM, is authorized and regulated by the Financial Services Commission, Mauritius (FSC) with license no. GB22201012, and registered at 33, Edith Cavell Street C/o IQ EQ Fund Services (Mauritius) Ltd Port Louis, 11324 Mauritius.
Email: support@tmgm.com
Copyright © TMGM. All rights reserved