

Trading
Explore a wide range of markets with competitive pricing, deep liquidity, and advanced trading tools.
Learn More 
Platform
Trade seamlessly with TMGM's powerful platform, built for speed, precision, and a superior trading experience.
Learn More Trading Platform
Academy
Learn the fundamentals of trading with beginner-friendly resources, including guides, webinars, and market insights.
Learn More News & Analysis
Get real-time market updates and expert analysis to stay ahead of trading opportunities
Learn More News & Analysis
About
Learn what sets TMGM apart — our global presence, regulatory strength, and commitment to innovation in trading.
Learn More Why Choose TMGM
Sponsorship
US CPI beats estimates: XAG/USD retreats | Silver Price Forecast
- An upside surprise in US inflation boosts the US Dollar and Treasury yields, weighing on Silver.
- Expectations for additional interest rate increases firm following hawkish remarks from Fed officials.
- Below its 21-day, 100-day and 200-day SMAs, XAG/USD retains a bearish bias.
XAG/USD is trading near $51.23 at the time of writing. Silver is down 3.97% on the day, facing heavy selling on Tuesday after stronger-than-expected US inflation drove the US Dollar (USD) and US Treasury yields higher.
October's US Consumer Price Index (CPI) increased 0.4% month on month, exceeding the 0.3% forecast but slowing from September's 0.6% rise. Excluding food and energy, core CPI advanced 0.3%. That matched September's increase and surpassed expectations of 0.2%.

Pressure also came from Dallas Fed President Lorie Logan, who said the Federal Reserve (Fed) needs “at least two more 25-basis-point (bps) rate increases” and that it “may be possible to move more rapidly this winter.” Ahead of the data release, Fed Governor Christopher Waller said December may require a half-point rate increase if October core CPI registers “around 0.3% or higher.”
Traders now assign an 89.2% probability to a 25-bps December rate increase, against a 10.8% chance of a larger 50-bps move, according to the CME FedWatch Tool. Further Fed tightening is still expected, weighing on Silver as higher rates increase the opportunity cost of holding assets that pay no yield. The metal's appeal to investors is also diminished by rising US Treasury yields and a firmer US Dollar.
XAG/USD technical outlook
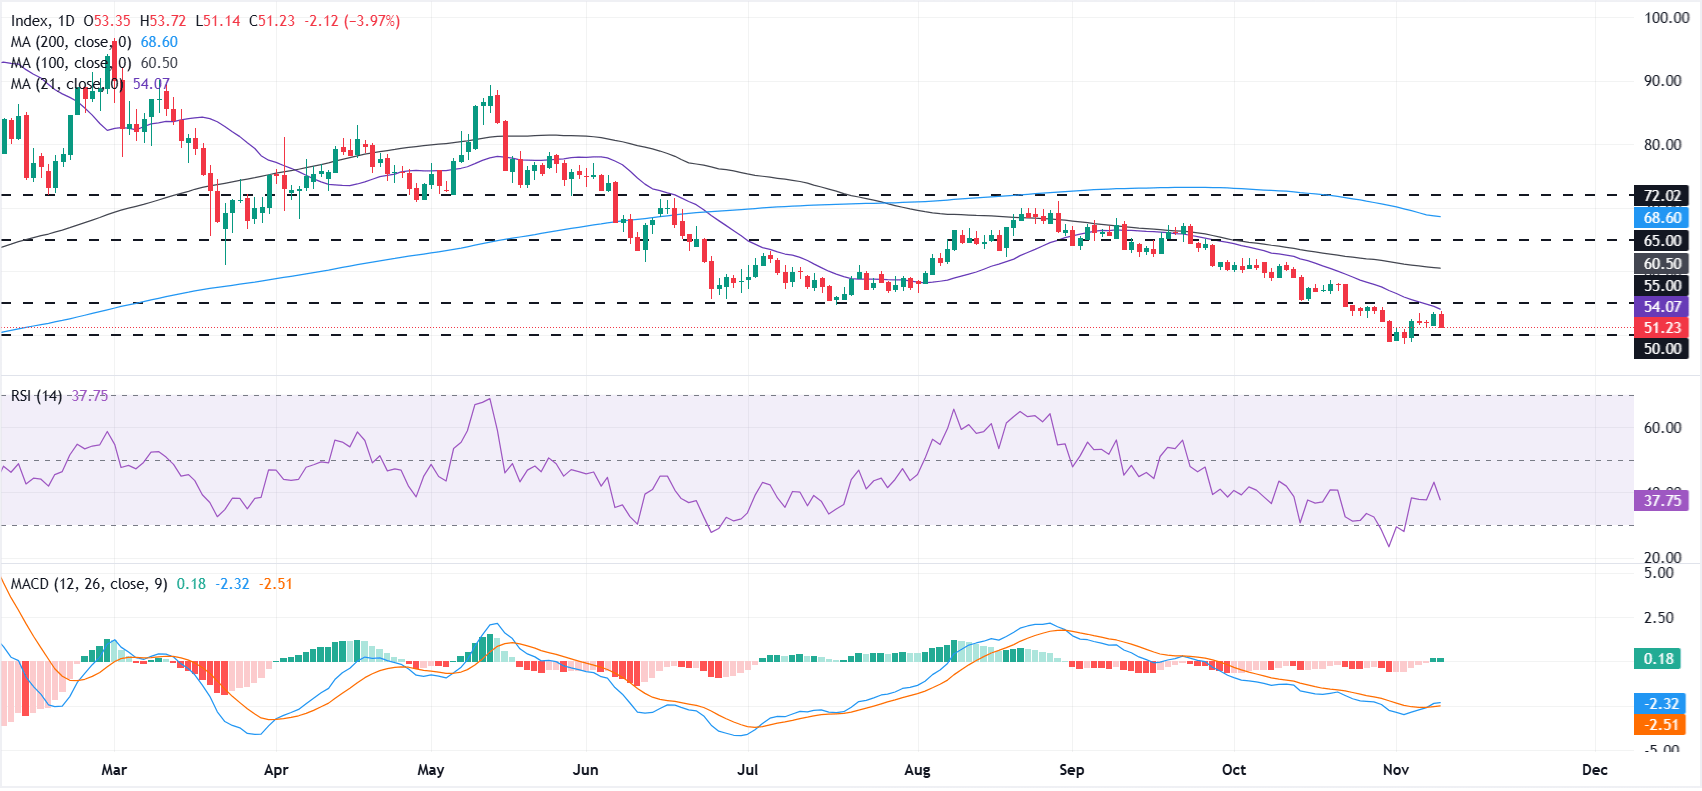
Trading below the 21-day, 100-day and 200-day simple moving averages (SMAs), XAG/USD retains a distinctly bearish daily chart structure. At around 38, the Relative Strength Index (RSI) continues to signal weakness. The Moving Average Convergence Divergence (MACD), however, has edged into positive territory. This suggests a tentative stabilisation attempt, not a confirmed bullish reversal.
The horizontal level near $50 provides the nearest downside support, ahead of the year-to-date low at $48.62. Losses could deepen if that low gives way.
The 21-day SMA near $54 marks the first upside hurdle, with horizontal resistance at $55 next. Higher up, the 100-day SMA at $60.50 and horizontal resistance at $65 stand ahead of the longer-term 200-day SMA near $68.60. Together, these levels form a broad overhead supply zone. A recovery through that zone would be needed to alleviate the prevailing bearish pressure.
(The technical analysis of this story was written with the help of an AI tool. Know more.)
US Dollar: Today's Currency Performance
The US Dollar recorded its strongest performance against the Australian Dollar today. The table below details the percentage moves in the US Dollar (USD) against the major currencies listed.
| USD | EUR | GBP | JPY | CAD | AUD | NZD | CHF | |
|---|---|---|---|---|---|---|---|---|
| USD | 0.64% | 0.87% | 0.57% | 0.54% | 1.16% | 0.79% | 0.86% | |
| EUR | -0.64% | 0.22% | -0.05% | -0.09% | 0.51% | 0.15% | 0.22% | |
| GBP | -0.87% | -0.22% | -0.30% | -0.31% | 0.29% | -0.08% | -0.00% | |
| JPY | -0.57% | 0.05% | 0.30% | -0.04% | 0.57% | 0.20% | 0.28% | |
| CAD | -0.54% | 0.09% | 0.31% | 0.04% | 0.61% | 0.24% | 0.31% | |
| AUD | -1.16% | -0.51% | -0.29% | -0.57% | -0.61% | -0.37% | -0.29% | |
| NZD | -0.79% | -0.15% | 0.08% | -0.20% | -0.24% | 0.37% | 0.08% | |
| CHF | -0.86% | -0.22% | 0.00% | -0.28% | -0.31% | 0.29% | -0.08% |
Percentage movements between the major currencies are displayed in the heat map. Select the base currency in the left-hand column and the quote currency in the top row. For instance, selecting the US Dollar on the left and following its row across to the Japanese Yen gives the percentage change for USD (base)/JPY (quote) in the corresponding cell.
POPULAR ARTICLES
1Forex Today: German Inflation and ECB Commentary Take Centre Stage2$4,000 approaches as gold plunges and hot US inflation pushes Treasury yields above 5%3US CPI beats estimates: XAG/USD retreats | Silver Price Forecast4Above-forecast US CPI weighs on Japanese Yen as Fed officials favour further rate hikes5Two more hikes expected by Fed’s Logan, who flags faster winter tightening6October US Inflation Rise: Bitcoin vs Gold Outlook as BTC and XAU retreat7December ECB rate hike obvious despite energy relief, says Nagel8Below 1.34: British Pound slides as hot CPI raises prospect of 50-bps Fed hike9US CPI bolsters hawkish Fed outlook, weighing on Canadian Dollar


Get Started!
Sign up and access the Global Markets in less than 3 minutes

Connect With Us












The information provided on this website is of a general nature only and does not constitute personal financial advice. Before acting on any information on this website, you should consider the suitability of the information in relation to your objectives, financial situation and needs. Investing in CFDs and FX Margin Contracts carries significant risks and is not suitable for all investors. You may lose more than your initial deposit. You do not own, or have, any interest in the underlying asset. We recommend that you seek independent advice and ensure you fully understand the risks involved before trading. It is important that you read and consider the disclosure document before you acquire any product listed on the website. The information and advertisements offered on this website are not intended for use by any person in any country or jurisdiction where such use would be contrary to local laws and regulations. The Products and Services offered on this website are not intended for residents of the United States, Malaysia and Thailand.
TMGM is authorized and regulated in various jurisdictions.
Trademax Australia Limited, trading as TMGM, is regulated by the Australian Securities and Investments Commission (ASIC), AFSL no. 436416 and is located at Level 28, One International Tower, 100 Barangaroo Avenue, 2000 Sydney, NSW Australia.
Email: support@tmgm.com.au
Trademax Global Limited, trading as TMGM, is authorized and regulated by the Vanuatu Financial Services Commission (VFSC), registration number 40356 and registered at 1276, Kumul Highway, Port Vila, Vanuatu, Republic of Vanuatu.
Email: support@tmgm.com
Trademax Global Markets (SE) Limited, trading as TMGM, is authorized and regulated by the Financial Services Authority (FSA) of Seychelles, with license number SD224. The company is registered at Office No 13, Providence Estate ABIS Centre, Mahe, Seychelles.
Email: support@tmgm.com
Trademax Global Markets (International) Pty Ltd, trading as TMGM, is authorized and regulated by the Financial Services Commission, Mauritius (FSC) with license no. GB22201012, and registered at 33, Edith Cavell Street C/o IQ EQ Fund Services (Mauritius) Ltd Port Louis, 11324 Mauritius.
Email: support@tmgm.com
Copyright © TMGM. All rights reserved