

USD/JPY Price Forecast: Clashes at 159.00, retreats to 50-day SMA
- SD/JPY holds above 50-day SMA, but upside remains capped.
- RSI slopes toward 50, signaling sellers are gaining traction.
- Break below 158.78 exposes 158.14 and 157.59 support levels.
USD/JPY edges lower during the North American session, sponsored by geopolitical headlines, which weighed on the US Dollar. In the meantime, fears of a possible intervention of Japanese authorities in the FX markets underpinned the Japanese Yen. The pair trades at 158.91, down 0.19%.
USD/JPY Price Forecast: Technical outlook
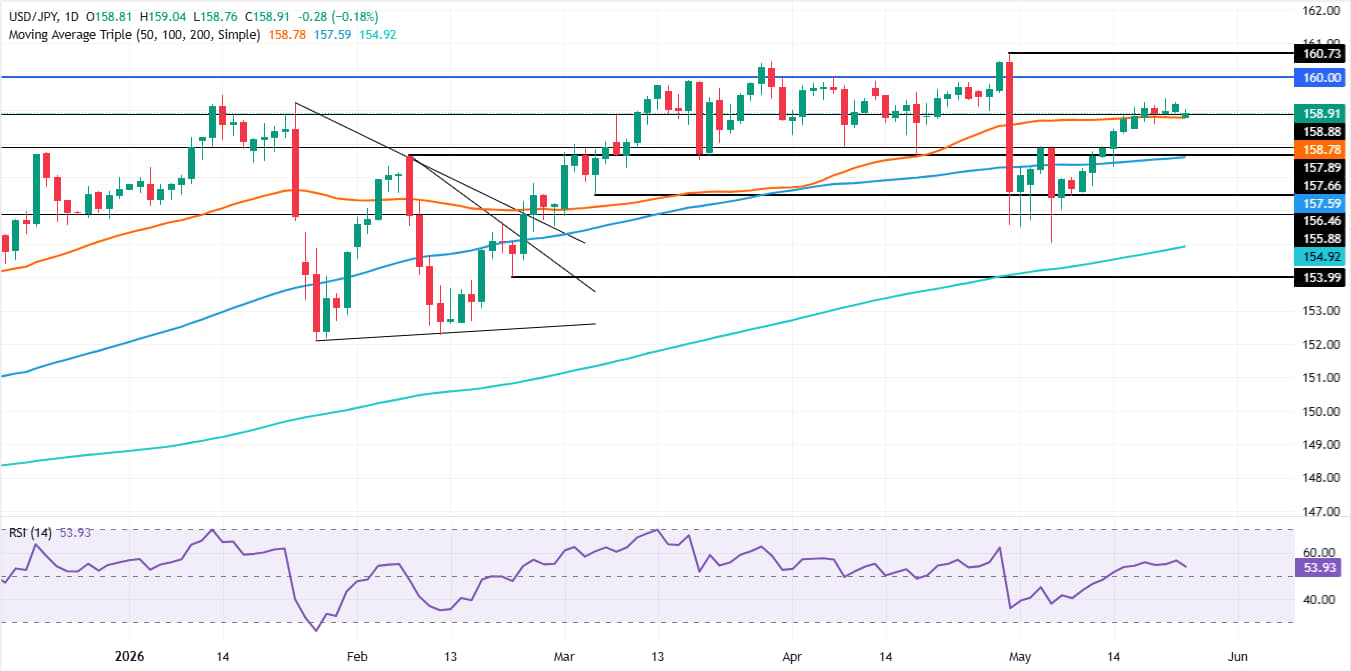
From a technical perspective, USD/JPY is consolidating above the 50-day Simple Moving Average (SMA) at 158.78, with buyers pushing the exchange rate towards the intervention zone around 159.00-160.00.

If that area is hurdled, the next area of interest would be the year-to-date (YTD) at 160.73, followed by the 161.00 figure.
Although momentum remains bullish, as indicated by the Relative Strength Index (RSI), further downside is expected as the slope approaches the 50-neutral level, an indication that sellers are gaining steam.
Downwards, the USD/JPY first support would be the 50-day SMA at 158.78, followed by the 20-day SMA at 158.14. A breach of the latter will expose the 100-day SMA at 157.59, followed by the May 14 daily low of 157.31. Below this area, look for the 157.00 mark.
USD/JPY Price Chart – Daily
Japanese Yen Price Today
The table below shows the percentage change of Japanese Yen (JPY) against listed major currencies today. Japanese Yen was the strongest against the US Dollar.
| USD | EUR | GBP | JPY | CAD | AUD | NZD | CHF | |
|---|---|---|---|---|---|---|---|---|
| USD | -0.35% | -0.55% | -0.19% | -0.14% | -0.67% | -0.40% | -0.27% | |
| EUR | 0.35% | -0.22% | 0.15% | 0.18% | -0.34% | -0.03% | 0.07% | |
| GBP | 0.55% | 0.22% | 0.39% | 0.41% | -0.13% | 0.19% | 0.27% | |
| JPY | 0.19% | -0.15% | -0.39% | 0.04% | -0.52% | -0.24% | -0.14% | |
| CAD | 0.14% | -0.18% | -0.41% | -0.04% | -0.54% | -0.26% | -0.16% | |
| AUD | 0.67% | 0.34% | 0.13% | 0.52% | 0.54% | 0.29% | 0.39% | |
| NZD | 0.40% | 0.03% | -0.19% | 0.24% | 0.26% | -0.29% | 0.10% | |
| CHF | 0.27% | -0.07% | -0.27% | 0.14% | 0.16% | -0.39% | -0.10% |
The heat map shows percentage changes of major currencies against each other. The base currency is picked from the left column, while the quote currency is picked from the top row. For example, if you pick the Japanese Yen from the left column and move along the horizontal line to the US Dollar, the percentage change displayed in the box will represent JPY (base)/USD (quote).














