

Trading
Esplora una vasta gamma di mercati con prezzi competitivi, elevata liquidità e strumenti di trading avanzati.
Scopri di più 
Piattaforma
Fai trading senza problemi con la potente piattaforma di TMGM, fatta apposta per essere veloce, precisa e per darti un'esperienza di trading fantastica.
Scopri di più Piattaforma di trading
Strumenti di trading
Academy
Impara le basi del trading con le risorse per principianti, tra cui guide, webinar e approfondimenti sul mercato.
Scopri di più Notizie e analisi
Ricevi aggiornamenti sul mercato in tempo reale e analisi di esperti per cogliere le opportunità di trading
Scopri di più Notizie e analisi
Chi siamo
Scopri cosa rende TMGM speciale: la nostra presenza globale, la nostra forza normativa e il nostro impegno per l'innovazione nel trading.
Scopri di più Perché scegliere TMGM
Sponsorizzazioni
USD/CHF Price Forecast: Daily chart favours bulls despite mixed momentum signals
- USD/CHF rebounds as US Dollar strength keeps the Swiss Franc under pressure.
- The technical outlook remains bullish above the 50-, 100- and 200-day SMAs.
- The RSI signals positive momentum, while a slightly negative MACD suggests some loss of upside strength.
USD/CHF starts the week on a positive note, snapping a two-day losing streak as broad US Dollar (USD) strength and a wide interest rate differential between the Federal Reserve (Fed) and the Swiss National Bank (SNB) keep the Swiss Franc (CHF) under persistent selling pressure. At the time of writing, the pair trades around 0.8333, hovering near levels last seen in May 2025.

The US Dollar Index (DXY), which tracks the Greenback against six major currencies, trades around 102.45, holding close to last week’s peak of 102.53, its highest level since April 2025.
Traders now look ahead to September’s US Consumer Price Index (CPI) report on Wednesday, followed by the Producer Price Index (PPI) on Thursday. With no major Swiss economic releases scheduled this week, USD/CHF is likely to remain largely driven by US Dollar dynamics and shifting expectations surrounding the Fed’s interest rate outlook.
Technical analysis
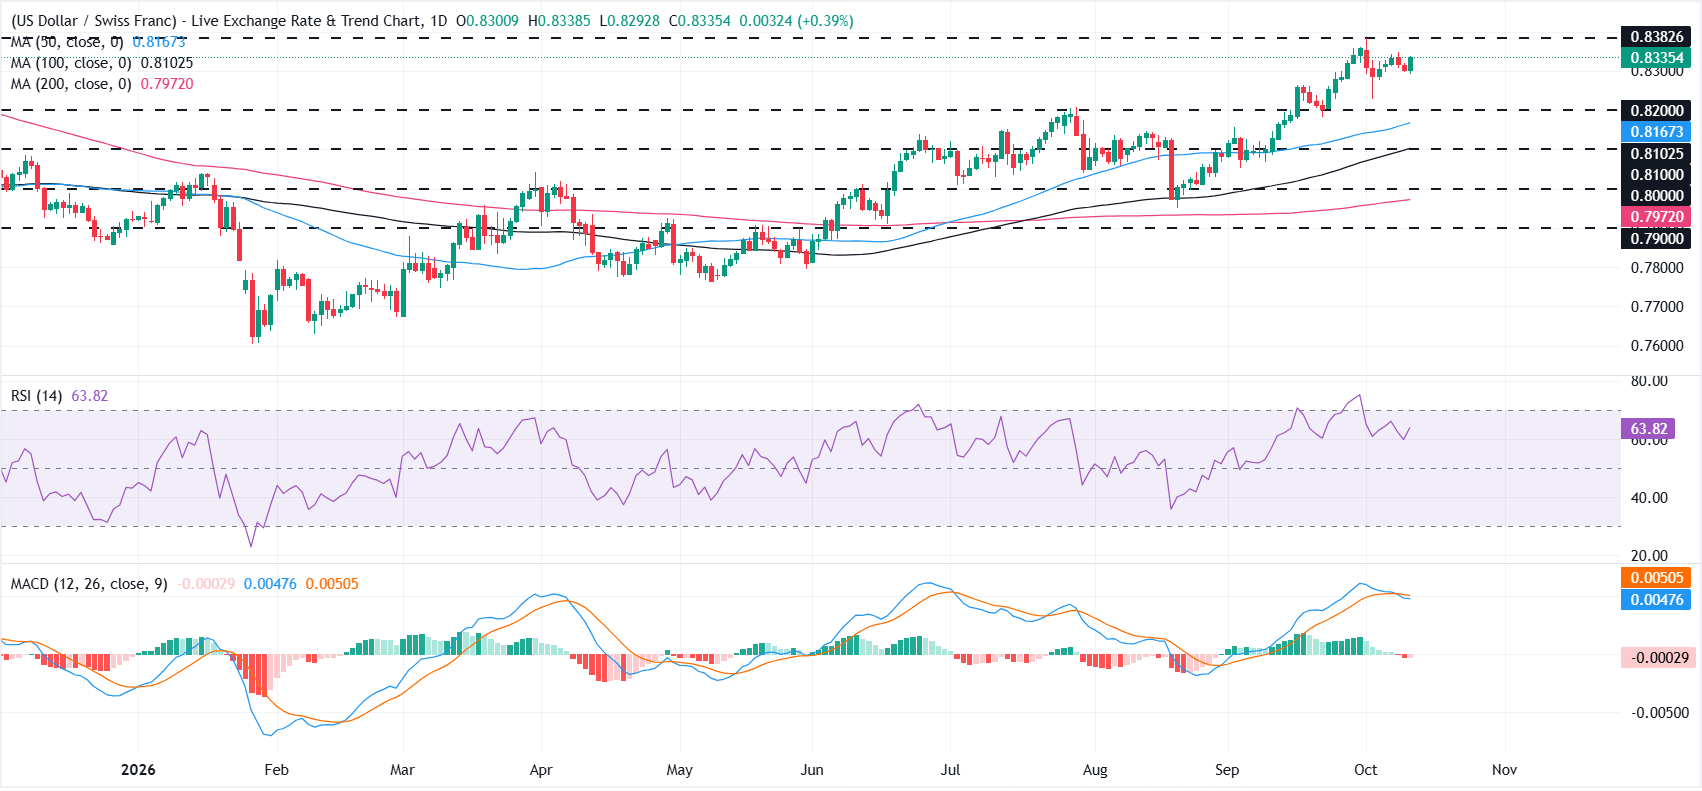
On the daily chart, USD/CHF holds a constructive bullish bias as it remains comfortably above the 50-, 100- and 200-day Simple Moving Averages (SMAs) clustered between roughly 0.8167 and 0.7972. The Relative Strength Index (RSI) around 63 suggests positive but not extreme upside momentum, while the Moving Average Convergence Divergence (MACD) has slipped slightly into negative territory, hinting at a mild loss of short-term momentum rather than a clear bearish reversal.
On the topside, immediate resistance is located at the October 1 high of 0.8383, where a break higher would reopen the path for further gains. On the downside, initial support is seen at 0.8200, followed by the 50-day SMA at 0.8167. Further down, the 100-day SMA at 0.8102 is closely aligned with the 0.8100 psychological mark, followed by the 0.8000 level. The 200-day SMA at 0.7972 comes into focus on a deeper pullback, ahead of the 0.7900 support level.
(The technical analysis of this story was written with the help of an AI tool. Know more.)
Swiss Franc Price This Year
The table below shows the percentage change of Swiss Franc (CHF) against listed major currencies this year. Swiss Franc was the strongest against the Euro.
| USD | EUR | GBP | JPY | CAD | AUD | NZD | CHF | |
|---|---|---|---|---|---|---|---|---|
| USD | 5.17% | 1.93% | 1.40% | 4.13% | -4.19% | 3.51% | 5.20% | |
| EUR | -5.17% | -3.13% | -3.53% | -0.90% | -8.57% | -1.51% | 0.11% | |
| GBP | -1.93% | 3.13% | -0.42% | 2.29% | -5.61% | 1.70% | 3.34% | |
| JPY | -1.40% | 3.53% | 0.42% | 2.62% | -5.41% | 1.61% | 3.88% | |
| CAD | -4.13% | 0.90% | -2.29% | -2.62% | -7.82% | -0.99% | 1.03% | |
| AUD | 4.19% | 8.57% | 5.61% | 5.41% | 7.82% | 7.71% | 9.48% | |
| NZD | -3.51% | 1.51% | -1.70% | -1.61% | 0.99% | -7.71% | 1.64% | |
| CHF | -5.20% | -0.11% | -3.34% | -3.88% | -1.03% | -9.48% | -1.64% |
The heat map shows percentage changes of major currencies against each other. The base currency is picked from the left column, while the quote currency is picked from the top row. For example, if you pick the Swiss Franc from the left column and move along the horizontal line to the US Dollar, the percentage change displayed in the box will represent CHF (base)/USD (quote).
ARTICOLI POPOLARI
1British Pound loses ground as Oil risks cloud BoE’s hawkish outlook2India: Rising inflation pressures challenge RBI – Societe Generale3Chinese Yuan: Trade détente and PBoC fix support Yuan – Commerzbank4USD/CHF Price Forecast: Daily chart favours bulls despite mixed momentum signals5Australian Dollar retreats as Fed hawkish stance, Iran tensions boost US Dollar6Germany: AI boom versus growth drag – Deutsche Bank7Euro remains on the back foot amid French debt concerns, US Dollar strength8Mexican Peso: Steepening curve and carry risks – Rabobank9New Zealand Dollar retreats toward 17-month low on Oil-driven risk aversion
QUOTAZIONI IN DIRETTA


TUTTO SU FOREX
Le 15 valute più deboli al mondo
Miglior Broker Forex: Come Scegliere la Migliore Piattaforma di Trading Forex
Le 15 Coppie di Valute Forex Più Scambiate
Orari del mercato forex: a che ora apre il mercato forex?
Il Miglior Software Gratuito per il Backtesting Forex per un Test Affidabile delle Strategie
Cos'è lo Scalping nel Forex? Esplora Strategie e Indicatori per lo Scalping
Cos'è un Pip? Guida Pratica ai Pip Forex, al Valore del Pip e ai Costi di Trading
Come Iniziare a Fare Trading Forex per Principianti: Una Guida Passo Dopo Passo
Cos'è il Forex trading e come funziona
Inizia ora!
Registrati e accedi ai mercati globali in meno di 3 minuti

Contattaci









Contatti
Telefono: +61 2 8036 8388
Fax: +61 2 8036 8388
Email: support@tmgm.com
Web: https://www.tmgm.com



Le informazioni fornite su questo sito web hanno esclusivamente carattere generale e non costituiscono consulenza finanziaria personalizzata. Prima di agire sulla base di qualsiasi informazione presente su questo sito web, dovresti valutarne l'adeguatezza in relazione ai tuoi obiettivi, alla tua situazione finanziaria e alle tue esigenze. Investire in CFD e contratti FX con margine comporta rischi significativi e non è adatto a tutti gli investitori. Potresti perdere più del tuo deposito iniziale. Non possiedi, né hai, alcun interesse nell'attività sottostante. Ti raccomandiamo di richiedere una consulenza indipendente e di assicurarti di comprendere pienamente i rischi connessi prima di fare trading. È importante leggere e valutare il documento informativo prima di acquisire qualsiasi prodotto elencato sul sito web. Le informazioni e le pubblicità offerte su questo sito web non sono destinate all'uso da parte di persone in paesi o giurisdizioni in cui tale utilizzo sarebbe contrario alle leggi e ai regolamenti locali. I Prodotti e Servizi offerti su questo sito web non sono destinati ai residenti degli Stati Uniti, della Malesia e della Thailandia.
TMGM è autorizzata e regolamentata in diverse giurisdizioni.
Trademax Australia Limited, operante come TMGM, è regolamentata dalla Australian Securities and Investments Commission (ASIC), AFSL n. 436416 e si trova a Level 28, One International Tower, 100 Barangaroo Avenue, 2000 Sydney, NSW Australia.
Email: support@tmgm.com.au
Trademax Global Limited, operante come TMGM, è autorizzata e regolamentata dalla Vanuatu Financial Services Commission (VFSC), numero di registrazione 40356 e registrata a 1276, Kumul Highway, Port Vila, Vanuatu, Repubblica di Vanuatu.
Email: support@tmgm.com
Trademax Global Markets (SE) Limited, operante con il nome TMGM, è autorizzata e regolamentata dalla Financial Services Authority (FSA) delle Seychelles, con numero di licenza SD224. La società è registrata presso l’Ufficio n. 13, Providence Estate ABIS Centre, Mahé, Seychelles.
Email: support@tmgm.com
Trademax Global Markets (International) Pty Ltd, operante come TMGM, è autorizzata e regolamentata dalla Financial Services Commission, Mauritius (FSC) con licenza n. GB22201012, e registrata al 33, Edith Cavell Street C/o IQ EQ Fund Services (Mauritius) Ltd Port Louis, 11324 Mauritius.
Email: support@tmgm.com
Copyright © TMGM. Tutti i diritti riservati