

EUR/GBP Price Forecast: Holds above key SMAs within wedge pattern
- EUR/GBP trades in a tight range above 0.8700 as traders stay cautious amid uncertainty over the US-Iran ceasefire.
- Technically, EUR/GBP remains confined within a falling wedge pattern, with a key moving average cluster providing near-term support.
- Momentum indicators suggest a mild bullish bias, with upside pressure gradually building.
EUR/GBP trades in a tight range on Wednesday, with subdued price action as traders refrain from placing aggressive directional bets amid uncertainty over whether the US-Iran ceasefire will hold. At the time of writing, the cross is consolidating just above the 0.8700 mark after slipping to a one-week low near 0.8686 the previous day.
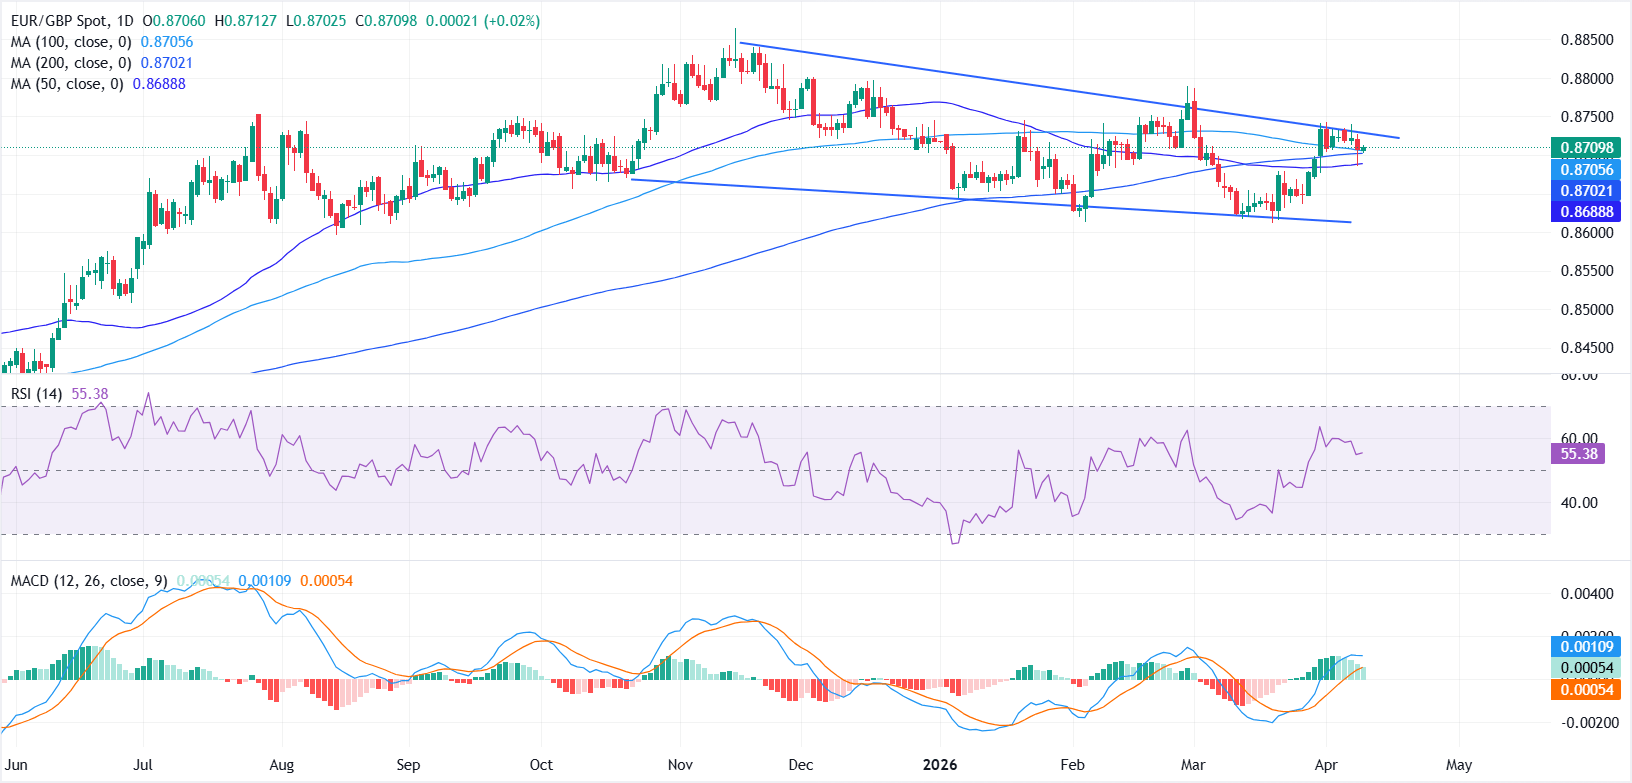
From a technical perspective, EUR/GBP continues to trade within a falling wedge pattern, a bullish reversal formation that signals fading downside pressure.
The pair is currently testing the upper boundary of the wedge while stabilizing above the 50-, 100- and 200-day Simple Moving Averages (SMAs) clustered between 0.8685 and 0.8710. This zone is acting as a strong technical base and a near-term pivot area.
The Relative Strength Index (RSI) near 55 leans positive without being overbought, while the Moving Average Convergence Divergence (MACD) remains in positive territory, hinting that upside momentum is still intact but not aggressive.
On the upside, a sustained break above the wedge resistance would confirm the bullish setup and could open the door toward 0.8750, followed by the 0.8800 region.
On the downside, a move below the moving average cluster would weaken the near-term structure and expose the 0.8650 level as the next support, ahead of the lower boundary of the wedge near 0.8610. A firm break below this support zone would negate the bullish setup and shift the bias back to the downside.
Euro Price Today
The table below shows the percentage change of Euro (EUR) against listed major currencies today. Euro was the strongest against the Japanese Yen.
| USD | EUR | GBP | JPY | CAD | AUD | NZD | CHF | |
|---|---|---|---|---|---|---|---|---|
| USD | -0.19% | -0.17% | 0.27% | -0.10% | 0.06% | -0.25% | -0.11% | |
| EUR | 0.19% | 0.04% | 0.48% | 0.12% | 0.25% | -0.03% | 0.08% | |
| GBP | 0.17% | -0.04% | 0.43% | 0.07% | 0.20% | -0.09% | 0.05% | |
| JPY | -0.27% | -0.48% | -0.43% | -0.38% | -0.24% | -0.54% | -0.39% | |
| CAD | 0.10% | -0.12% | -0.07% | 0.38% | 0.16% | -0.15% | -0.00% | |
| AUD | -0.06% | -0.25% | -0.20% | 0.24% | -0.16% | -0.28% | -0.15% | |
| NZD | 0.25% | 0.03% | 0.09% | 0.54% | 0.15% | 0.28% | 0.12% | |
| CHF | 0.11% | -0.08% | -0.05% | 0.39% | 0.00% | 0.15% | -0.12% |
The heat map shows percentage changes of major currencies against each other. The base currency is picked from the left column, while the quote currency is picked from the top row. For example, if you pick the Euro from the left column and move along the horizontal line to the US Dollar, the percentage change displayed in the box will represent EUR (base)/USD (quote).














