

NZD/USD Price Forecast: Buyers retain the upper hand near one-month highs
- NZD/USD holds near a one-month high as the RBNZ's hawkish stance supports the Kiwi.
- The US Dollar rebounds after a two-day decline, limiting the pair’s upside.
- NZD/USD keeps a bullish bias while holding above the 50-, 100- and 200-day SMAs.
NZD/USD fluctuates between minor gains and losses on Thursday as the Reserve Bank of New Zealand’s (RBNZ) hawkish stance supports the Kiwi, while a stronger US Dollar (USD) caps the upside. At the time of writing, the pair trades around 0.5842 after climbing to a one-month high earlier this week.

The Greenback is regaining its footing after a two-day decline triggered by softer-than-expected US inflation data. The US Dollar Index (DXY), which tracks the Greenback’s value against a basket of six major currencies, trades around 100.70 after falling to 100.35 on Wednesday, its lowest level since June 18.
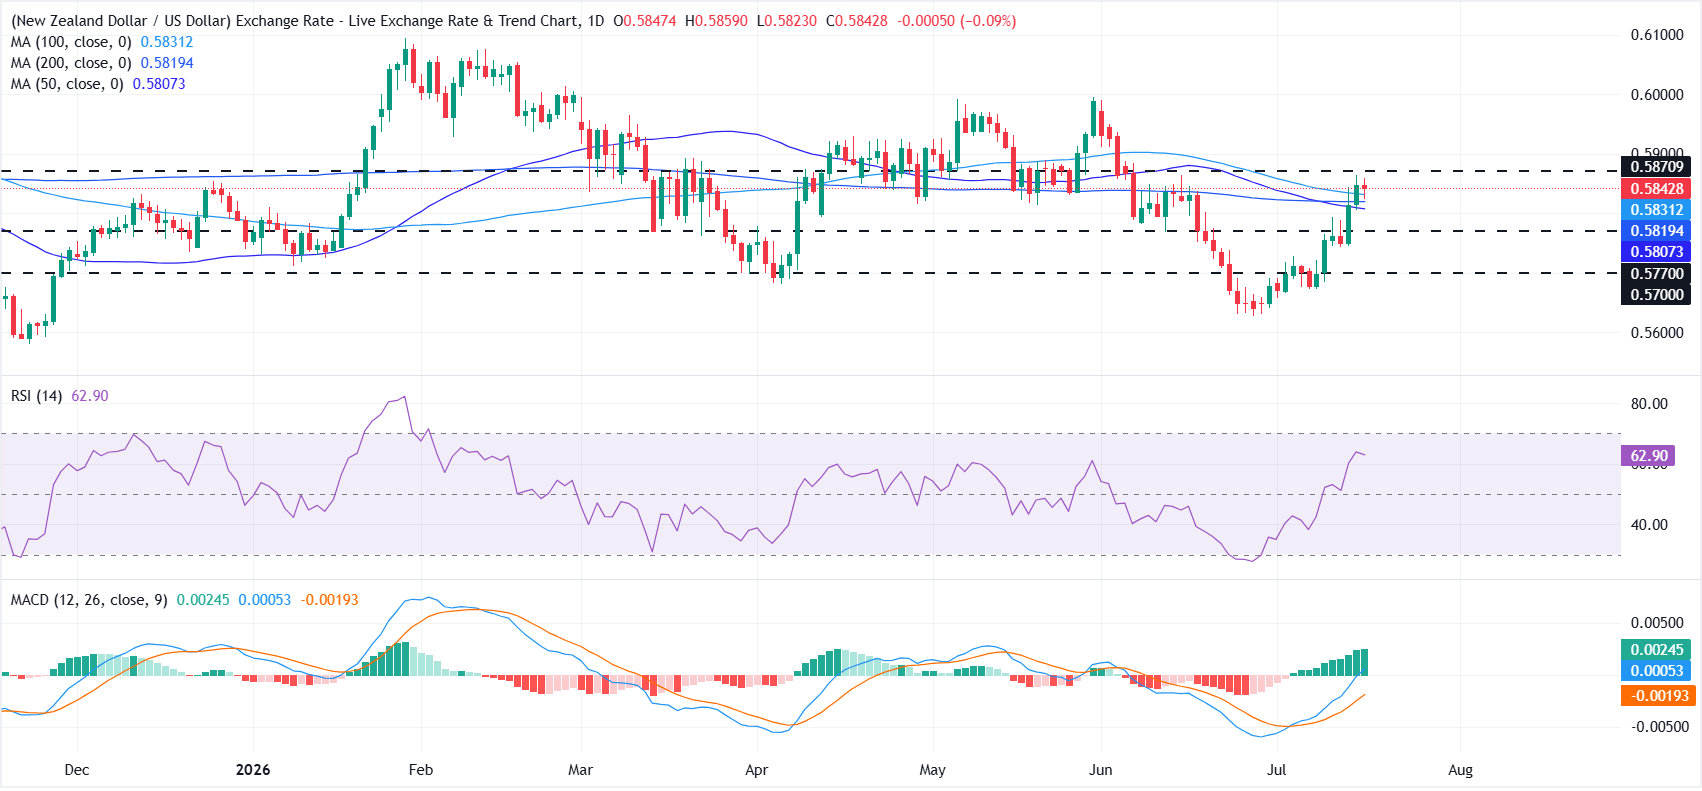
From a technical perspective, NZD/USD holds above the 50-day, 100-day and 200-day Simple Moving Averages (SMAs), clustered between 0.5807 and 0.5831, supporting a constructive near-term outlook.
The Relative Strength Index (RSI) stands at 63, indicating bullish momentum without reaching overbought territory. Meanwhile, the Moving Average Convergence Divergence (MACD) remains above zero, suggesting that buyers retain the upper hand.
On the downside, immediate support lies at the 100-day SMA of 0.5831, followed by the 200-day SMA at 0.5819 and the 50-day SMA at 0.5807. Below these levels, the horizontal supports at 0.5770 and 0.5700 could come into play.
On the topside, initial resistance is seen at the horizontal barrier near 0.5870. A sustained break above this level could open the door to additional gains.
(The technical analysis of this story was written with the help of an AI tool. Know more.)
New Zealand Dollar Price Today
The table below shows the percentage change of New Zealand Dollar (NZD) against listed major currencies today. New Zealand Dollar was the strongest against the British Pound.
| USD | EUR | GBP | JPY | CAD | AUD | NZD | CHF | |
|---|---|---|---|---|---|---|---|---|
| USD | 0.18% | 0.46% | 0.15% | -0.03% | 0.02% | 0.10% | 0.34% | |
| EUR | -0.18% | 0.28% | -0.02% | -0.19% | -0.08% | -0.06% | 0.16% | |
| GBP | -0.46% | -0.28% | -0.28% | -0.46% | -0.37% | -0.33% | -0.10% | |
| JPY | -0.15% | 0.02% | 0.28% | -0.19% | -0.05% | -0.04% | 0.19% | |
| CAD | 0.03% | 0.19% | 0.46% | 0.19% | 0.13% | 0.15% | 0.37% | |
| AUD | -0.02% | 0.08% | 0.37% | 0.05% | -0.13% | 0.04% | 0.23% | |
| NZD | -0.10% | 0.06% | 0.33% | 0.04% | -0.15% | -0.04% | 0.21% | |
| CHF | -0.34% | -0.16% | 0.10% | -0.19% | -0.37% | -0.23% | -0.21% |
The heat map shows percentage changes of major currencies against each other. The base currency is picked from the left column, while the quote currency is picked from the top row. For example, if you pick the New Zealand Dollar from the left column and move along the horizontal line to the US Dollar, the percentage change displayed in the box will represent NZD (base)/USD (quote).














