

Dow Jones Industrial Average pulls back hours before the Fed's answer
- DJIA trades roughly 900 points lower and back beneath the 52,000 handle for the first time since Friday, hours before the rate decision.
- A surprise commercial inventory draw of more than 7 million barrels lands at 14:30 GMT, with the barrel already up almost 7% on renewed strikes.
- Futures price a two-thirds chance of a fifth straight hold, which leaves the risk in a 130-word statement and half an hour of questions.
The Dow Jones Industrial Average trades just above 51,800 on Wednesday afternoon, down roughly 900 points and 1.7% from Tuesday's close. The session high just above 52,800 printed before 09:00 GMT, and the tape has sold in one near-continuous line ever since. The 52,000 handle reclaimed on Monday's peace bid is gone.

The war stops being somebody else's trade
Iran's Islamic Revolutionary Guard Corps launched multiple ballistic missiles at US forces in the Middle East late Tuesday, and Central Command says every one was intercepted. Reporting puts the target at an American base in Jordan. Trump told a television interviewer on Wednesday morning that Washington will hit Iran hard in reply, retiring the four-day pause that risk assets spent the start of the week banking.
West Texas Intermediate advanced almost 7% on the session to trade near $90.00, back where it sat before the stand-down. For four months a chokepoint war has produced dispersion inside the equity market rather than direction, because supply news lands unevenly across constituents and cancels out at the index line. A barrel near $90.00 three hours before a rate decision does not land unevenly at all.
A barrel count that arrives three hours early
The Energy Information Administration (EIA) reported commercial Crude Oil stocks down 7.167 million barrels on the week at 14:30 GMT, against a consensus draw of 2.5 million and a 2.011 million build the week before. A miss of that size is not a refinery-maintenance story. It is the physical market confirming that a shut chokepoint eventually turns up in a tank farm, three and a half hours before the statement.
The timing matters more than the number, because a committee that lifted its 2026 inflation projection to 3.6% from 2.7% in June, on the argument that the energy shock is still feeding through fertiliser, petrochemicals, and food prices, now writes its statement with a fresh draw and a 7% Crude Oil rally on the screen. Nothing in that framework makes the doves' afternoon easier.
Two-thirds for a hold, and no way to read the other third
Futures price a 66.3% chance the target range stays at 3.50% to 3.75% and a 33.7% chance of a hike, a tail barely moved from the 35.8% carried through last week. Further out the curve is unambiguous: at least one hike is 80.6% priced by 16 September, 87.1% by 28 October and 92.2% by 9 December, with two hikes 60.3% priced by year end. The argument is not whether this Fed moves, only when.
What makes the afternoon awkward is that there is very little to read the answer off. July carries no Summary of Economic Projections, so there is no dot plot and no chair's dot. June's statement was cut to roughly 130 words from 310 and stripped of forward guidance, which was the stated point of the redesign. A 130-word statement is a very small surface on which to hang a $90.00 barrel.
That leaves the 18:30 GMT press conference carrying the whole information load, and it is only the second of this chair's tenure. Nine of 18 June dots showed a 2026 hike, yet the hold passed unanimously and the hawk bloc has never once appeared in a dissent. Half an hour of questions has to settle whether a hawkish hold is a warning or a formality.
The index with the least chip exposure falls the hardest
The benchmark chip exchange-traded fund is down more than 4% on the day and 10% on the week after four straight losing sessions, on doubts about artificial intelligence capital returns and Chinese competition. Micron (MU) fell 5%, Advanced Micro Devices (AMD) more than 5% and KLA (KLAC) more than 8%. On earlier marks the S&P 500 was down 0.9% and the Nasdaq Composite 1.2%.
Nvidia (NVDA) is the index's only semiconductor component and not one of its higher-priced shares, so a price-weighted structure gives the chip rout little purchase here. What sold instead was the rate-sensitive industrial and consumer complex that dislikes a $90.00 barrel and a hawkish committee in equal measure. Procter & Gamble (PG) fell more than 3% on a revenue miss, while Ford (F) added 5% on a beat and a raised forecast.
The calendar does not stop at 18:30 GMT
Thursday at 12:30 GMT brings the June Personal Consumption Expenditures deflator, the advance second-quarter Gross Domestic Product estimate and weekly claims in a single block. Consensus has headline PCE at -0.1% MoM and 3.7% YoY from 4.1%, core at 0.2% MoM and 3.3% YoY from 3.4%, growth at 2.1% and initial claims at 200K from 187K.
The catch is the vintage, because that deflator measures June, the peace-dividend month when headline consumer prices fell 0.4% MoM and gasoline dropped almost 10%. It arrives 18 hours after a decision taken with the barrel near $90.00, describing a world that has been repriced twice since. Friday's Employment Cost Index at 0.8% consensus and the Michigan one-year inflation expectations series at 4.2% have the better claim on September.
Levels
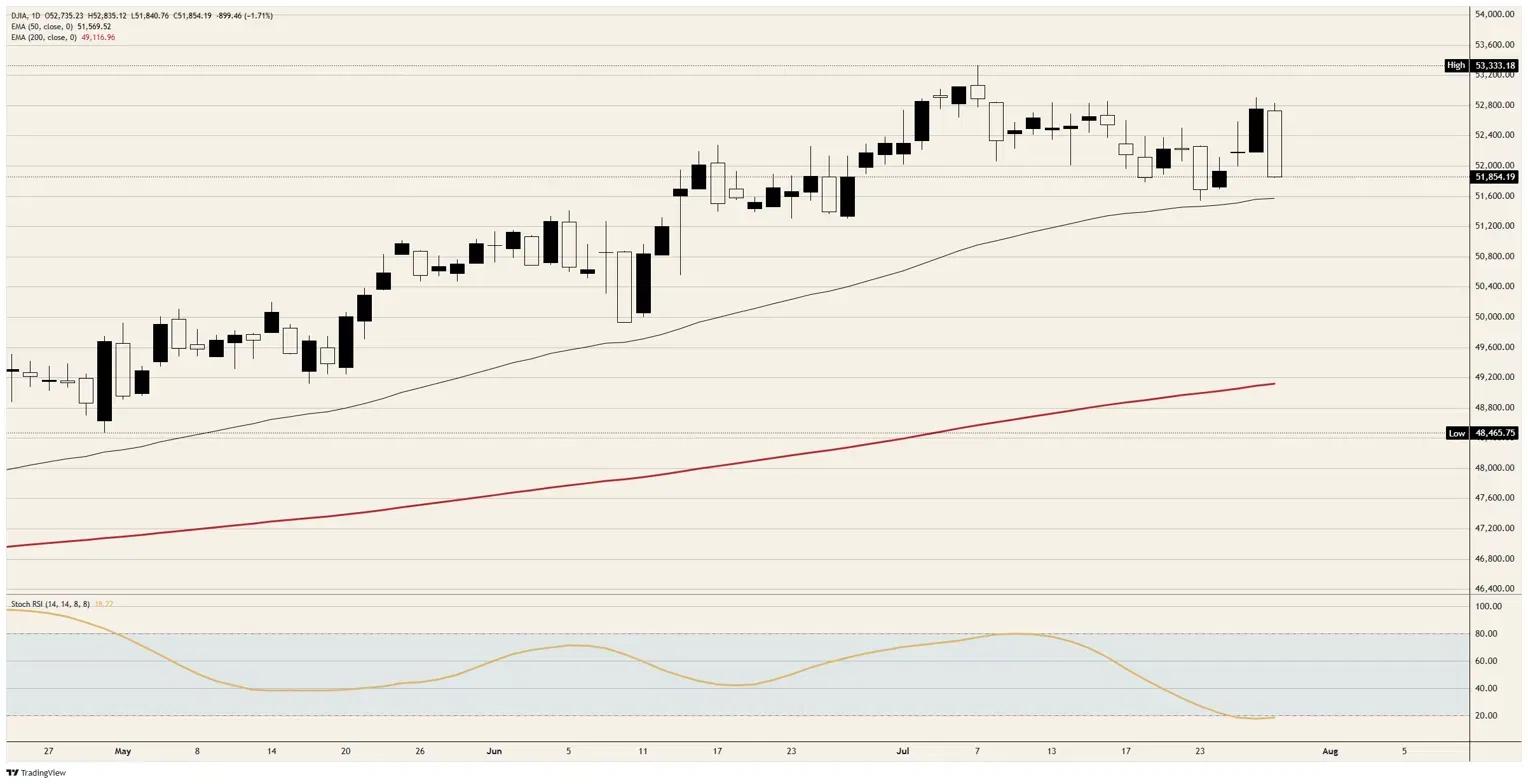
Resistance: The 52,000 handle flipped from floor to ceiling on Wednesday and is the first line back. Above it sit Tuesday's close near 52,750 and the session high just above 52,800. The record just above 53,300 has stood since early July.
Support: Just above 51,800 is where the session low printed and where price is trading now, with the 50-day Exponential Moving Average near 51,500 the last structural defence beneath it. Losing that line leaves the 51,000 handle as the next round defence, with the 200-day average near 49,000 far below.
Bias: Bearish beneath 52,000. The daily Stochastic Relative Strength Index near 18 has been pinned in oversold for a week without producing a bounce, which reads as trend rather than opportunity, and the five-minute reading near 89 says the late lift into the decision is already stretched. Invalidation is a daily close back above 52,000.
Dow Jones daily chart
Dow Jones FAQs
The Dow Jones Industrial Average, one of the oldest stock market indices in the world, is compiled of the 30 most traded stocks in the US. The index is price-weighted rather than weighted by capitalization. It is calculated by summing the prices of the constituent stocks and dividing them by a factor, currently 0.152. The index was founded by Charles Dow, who also founded the Wall Street Journal. In later years it has been criticized for not being broadly representative enough because it only tracks 30 conglomerates, unlike broader indices such as the S&P 500.
Many different factors drive the Dow Jones Industrial Average (DJIA). The aggregate performance of the component companies revealed in quarterly company earnings reports is the main one. US and global macroeconomic data also contributes as it impacts on investor sentiment. The level of interest rates, set by the Federal Reserve (Fed), also influences the DJIA as it affects the cost of credit, on which many corporations are heavily reliant. Therefore, inflation can be a major driver as well as other metrics which impact the Fed decisions.
Dow Theory is a method for identifying the primary trend of the stock market developed by Charles Dow. A key step is to compare the direction of the Dow Jones Industrial Average (DJIA) and the Dow Jones Transportation Average (DJTA) and only follow trends where both are moving in the same direction. Volume is a confirmatory criteria. The theory uses elements of peak and trough analysis. Dow’s theory posits three trend phases: accumulation, when smart money starts buying or selling; public participation, when the wider public joins in; and distribution, when the smart money exits.
There are a number of ways to trade the DJIA. One is to use ETFs which allow investors to trade the DJIA as a single security, rather than having to buy shares in all 30 constituent companies. A leading example is the SPDR Dow Jones Industrial Average ETF (DIA). DJIA futures contracts enable traders to speculate on the future value of the index and Options provide the right, but not the obligation, to buy or sell the index at a predetermined price in the future. Mutual funds enable investors to buy a share of a diversified portfolio of DJIA stocks thus providing exposure to the overall index.













