


Understanding RSI Divergence
Beyond identifying overbought or oversold market conditions, the RSI is also valuable for recognizing RSI divergence—an essential concept for predicting potential price reversals.
What is RSI Divergence?
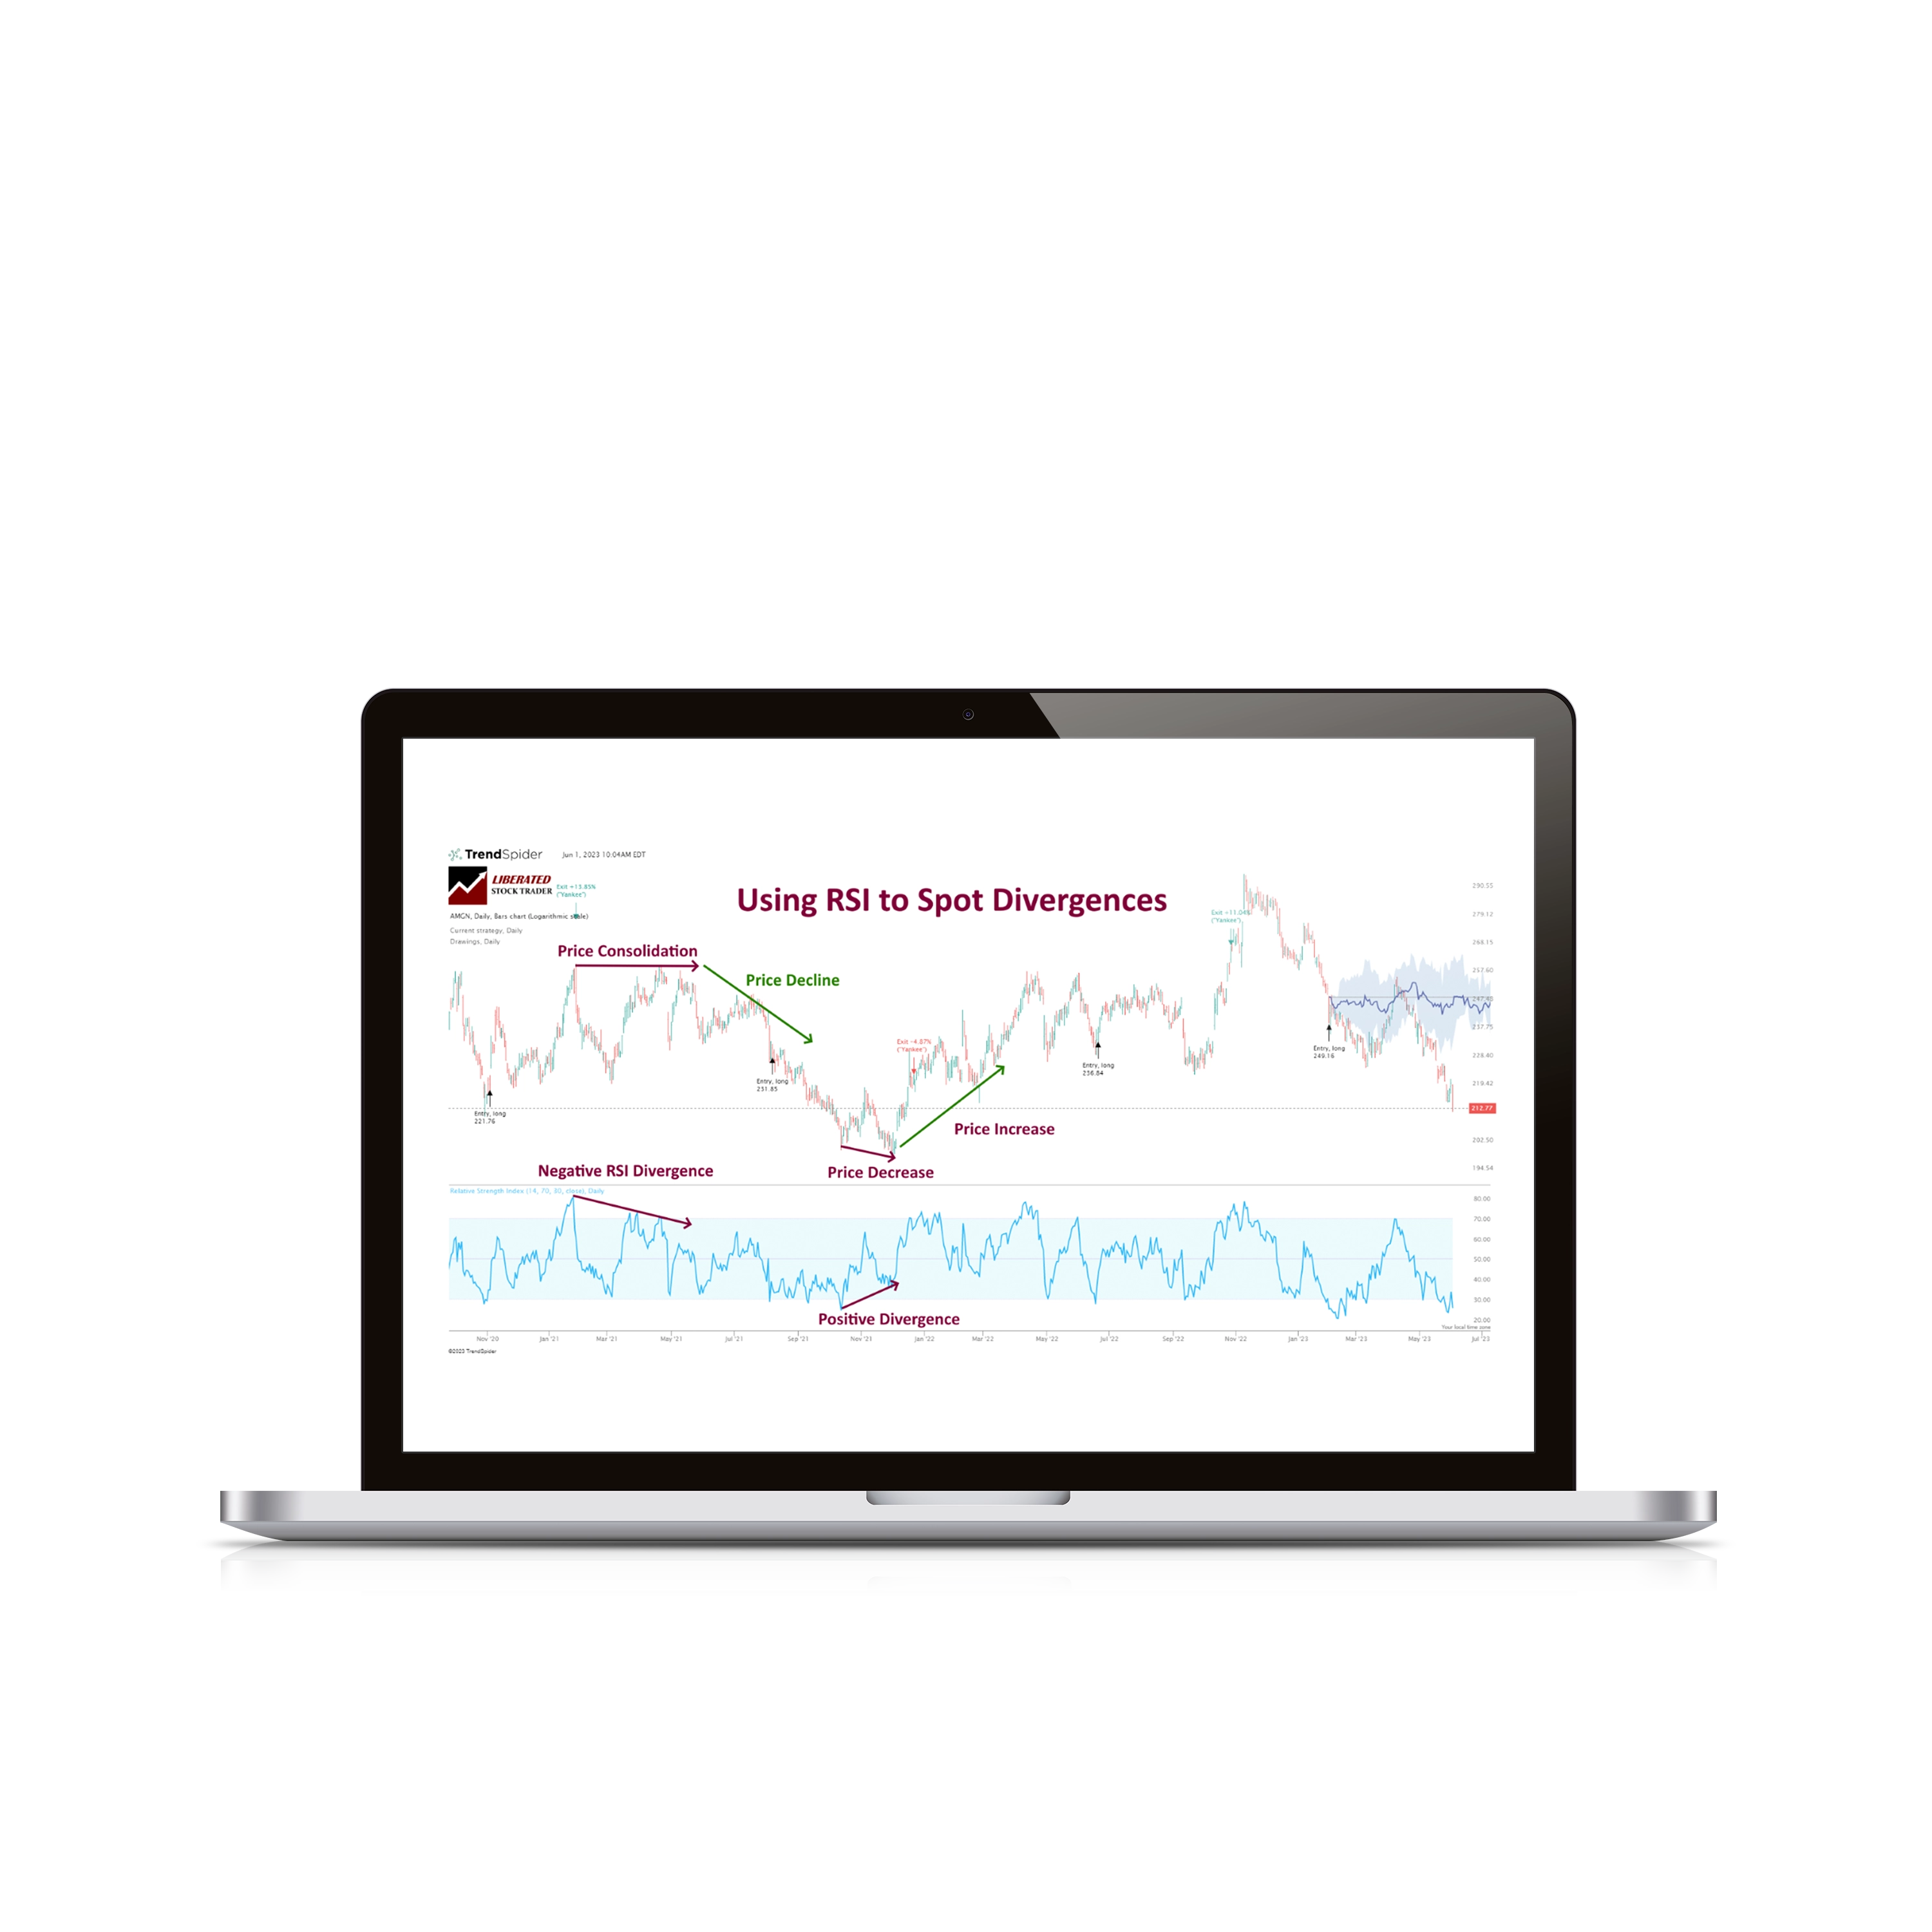
RSI divergence occurs when the RSI indicator moves in the opposite direction of price movements, signaling weakening momentum. This divergence provides a powerful early warning of potential trend reversals.Types of RSI Divergence:
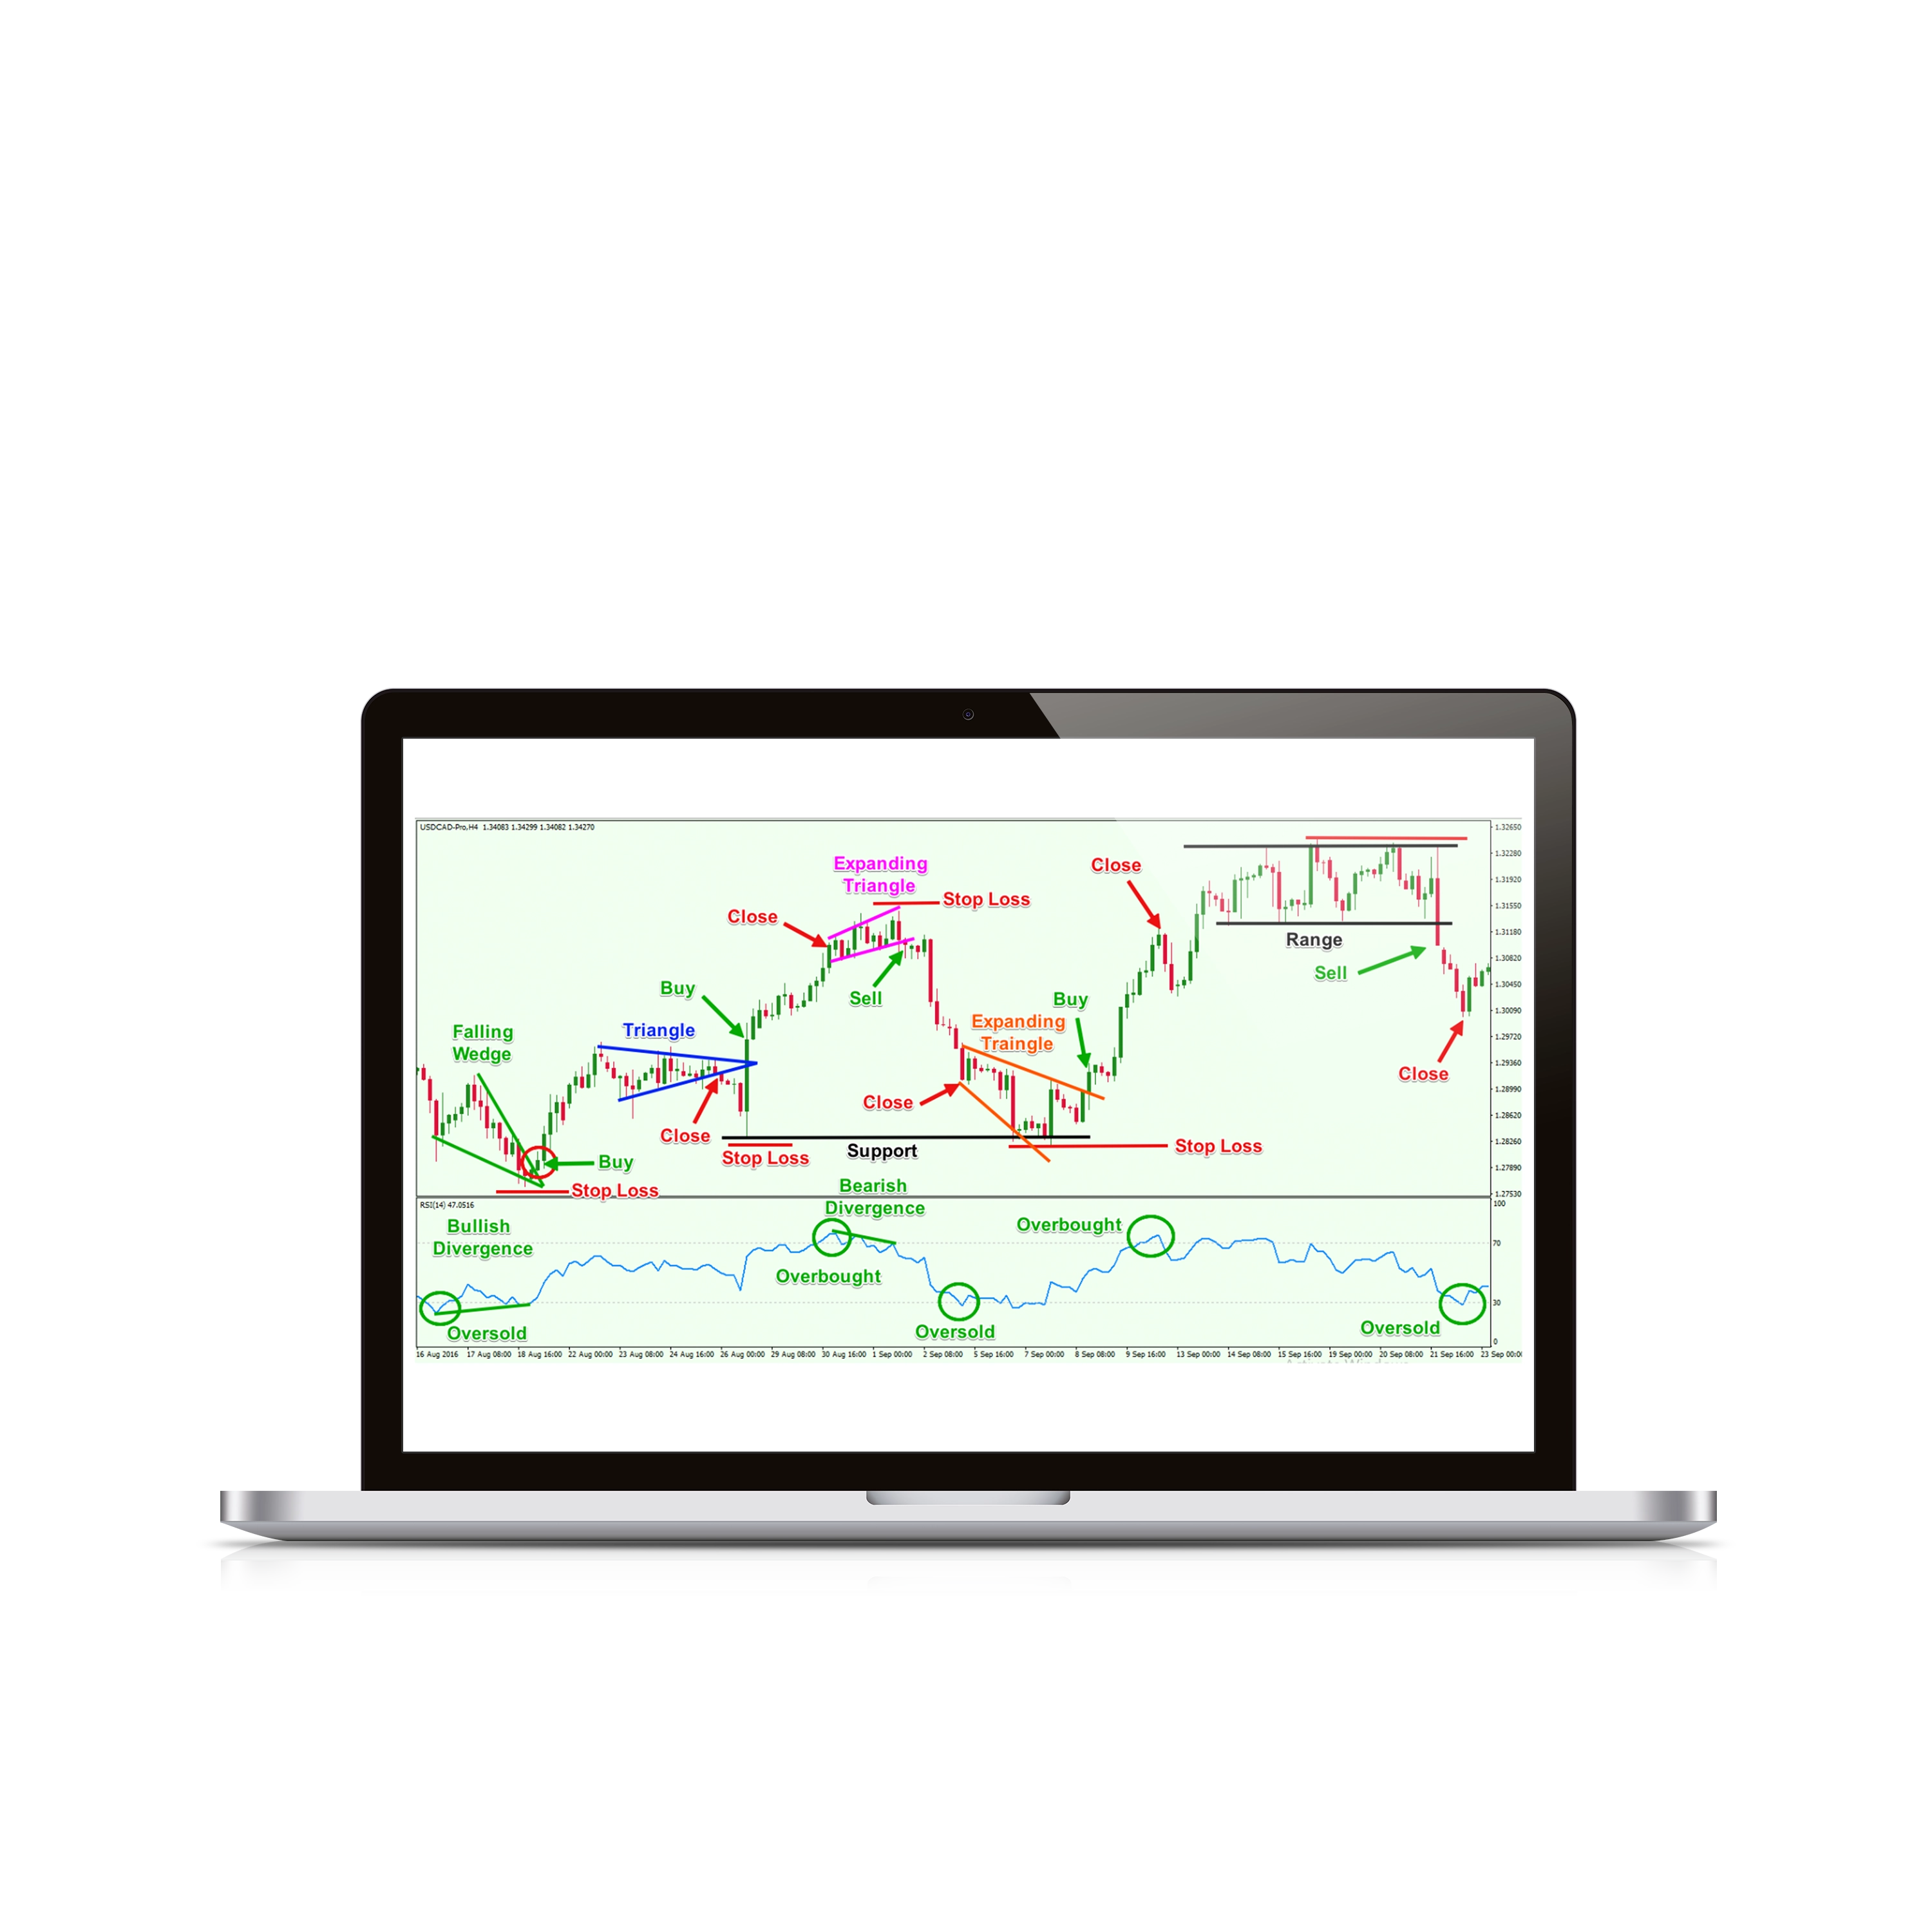
Bullish Divergence: Occurs when the price forms lower lows, but RSI creates higher lows. This divergence signals potential bullish reversals, suggesting that the underlying momentum is shifting upward, even if prices continue to fall.
Bearish Divergence: Occurs when the price forms higher highs, but RSI creates lower highs. This indicates weakening bullish momentum, hinting at a possible upcoming bearish reversal.
How to Use RSI Divergence Effectively:
Confirm divergence signals with candlestick patterns, trendline breaks, or additional indicators (e.g., MACD or moving averages) to reduce false signals.
Divergence on higher timeframes (e.g., daily or weekly charts) typically provides more reliable signals than shorter timeframes.
Always incorporate proper risk management techniques, including placing appropriate stop-loss orders, since divergences can occasionally produce false signals or delayed reversals.
Incorporating RSI divergence analysis into your trading strategy significantly enhances your ability to detect potential market turning points, giving you a competitive edge in timing your trades effectively.
What Is the RSI Indicator?
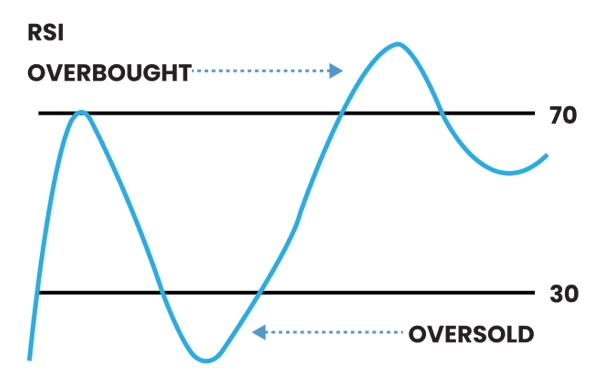
The Relative Strength Index (RSI) is a popular momentum oscillator used in technical analysis to gauge the strength and momentum behind recent price movements of an asset. Represented as a line fluctuating between 0 and 100, the RSI helps traders quickly visualize market conditions:
An RSI reading above 70 generally indicates an asset is overbought, signaling that prices might be excessively high and potentially due for a downward correction.
An RSI reading below 30 typically shows an asset is oversold, suggesting prices may have declined too sharply, with potential for a rebound or upward correction.
Additionally, traders use RSI to identify divergences—instances where the RSI moves in the opposite direction to price movements—providing valuable early warnings of potential trend reversals. Combining RSI with other indicators or chart patterns further enhances its accuracy and effectiveness.

How the RSI Works: A Simple Calculation
Understanding the RSI formula gives insight into its reliability.
RSI is calculated using the average gain and loss over a specific period, commonly 14 days.
Formula: RSI = 100 - [100 / (1 + Average Gain / Average Loss)].
Traders use these calculations to gauge market sentiment.
While manual calculations are rare due to advanced trading platforms, knowing the underlying formula helps traders trust the RSI’s signals.
Key Benefits of Using the RSI Indicator
The RSI indicator is versatile and valuable for traders at all levels.
Spotting overbought and oversold conditions: It provides a buying or selling (entry or exit signals) based on market momentum.
Detecting divergence: When price movements diverge from the RSI trend, it can indicate a potential reversal.
Complementing other indicators: The RSI pairs well with tools like Moving Averages (MA) and Bollinger Bands for deeper analysis.
Common Strategies Using RSI
Experienced traders leverage the RSI indicator in multiple ways.
Overbought and oversold signals: Enter trades when the RSI exits extreme zones (below 30 or above 70).
Divergence strategy: Look for mismatches between RSI movements and price action for potential trend reversals.
Breakout Confirmation: Use RSI to confirm whether a price breakout has momentum.
Avoiding Common RSI Mistakes
While the RSI indicator is effective, it’s not foolproof.
Ignoring other indicators: Relying solely on RSI can lead to misleading signals.
Using improper timeframes: A 14-day RSI may not suit all trading styles—experiment to find the right timeframe for your strategy.
Overtrading based on RSI alone: Use the RSI as part of a comprehensive trading plan.
Enhancing RSI with Advanced Techniques
Maximize the RSI’s potential by applying advanced techniques:
Combine RSI with trendlines: Draw trendlines on the RSI itself to predict momentum shifts.
Adjust RSI periods: Shorten or lengthen the calculation period to suit your trading horizon.
Multi-timeframe analysis: Check RSI signals across multiple timeframes to confirm trends.
Why RSI Is Especially Useful in Forex and CFDs
The RSI indicator is widely applied across markets, but it holds unique advantages in forex and CFD trading.
High liquidity and volatility: Forex and CFD markets are inherently volatile, creating frequent opportunities for momentum-based strategies. The RSI helps traders identify these opportunities effectively.
24/5 trading: Unlike stocks, forex and CFDs trade almost continuously throughout the week. The RSI adapts well to this continuous data flow, offering consistent signals.
Smaller price movements: In Forex, price movements are often subtle. The RSI's sensitivity to these shifts is especially beneficial for intraday and short-term traders.
Wide applicability: CFDs allow trading across multiple assets, and the RSI’s universal application ensures it can be used to analyze various instruments, from Forex trading to Crypto Trading, on a single platform.
How RSI Compares to Other Tools
While the RSI indicator is powerful, it’s most effective when combined with other tools and strategies. Here’s how it stacks up:
RSI vs. Moving Averages (MA): While moving averages smooth out price trends, the RSI is better suited for identifying momentum shifts and overbought/oversold conditions.
RSI vs. Bollinger Bands: Bollinger Bands focuses on price volatility and breakout points, whereas the RSI provides a deeper understanding of market momentum.
RSI and TMGM’s offerings: TMGM's trading platform enhances the RSI with access to customizable charting tools, real-time data, and educational resources for leveraging advanced indicators in trading strategies.
Pros and Cons of Using the RSI Indicator
Like any trading tool, the RSI indicator has its strengths and limitations.
Pros
Simple to use: Its straightforward calculation and clear overbought/oversold thresholds make it accessible for beginners and experienced traders.
Versatile: Works across multiple markets and timeframes, making it a go-to tool for all trading styles.
Effective in trending and ranging markets: Can be used to spot reversal points in trends and identify range-bound opportunities.
Customizable: Traders can adjust RSI settings, such as the period length, to suit their strategy.
Cons
False signals: During strong trends, the RSI may stay overbought or oversold for extended periods, leading to premature trades.
Limited scope: The RSI alone doesn’t provide context about broader market conditions, requiring traders to pair it with other indicators.
Lagging nature: Like most technical indicators, the RSI reflects past price data and may lag real-time market conditions.
Maximizing RSI with TMGM’s Tools
TMGM offers a robust suite of resources to enhance the use of the RSI indicator:
Comprehensive charting tools: You can tailor RSI settings and combine them with other technical indicators, such as Fibonacci retracements and moving average convergence divergence (MACD).
Real-time data feeds: Access accurate and timely data across forex, CFDs, and commodities for precise RSI calculations.
Educational content: Learn advanced RSI strategies and best practices through webinars, guides, and tutorials on TMGM’s platform.
Risk management features: Use tools like stop-loss order and trading calculators to mitigate risks when trading with RSI signals.
Why Traders Should Master the RSI Indicator
The Relative Strength Index (RSI) indicator remains a cornerstone of technical analysis because it provides clear, actionable insights into market momentum.
Whether you’re trading forex, CFDs, or other instruments, the RSI offers a practical way to spot overbought and oversold conditions, identify divergences, and confirm trends.
While it’s not a standalone solution, combining the RSI with other tools and strategies can significantly enhance your trading performance.
Ready to take your trading to the next level? Visit TMGM’s platform to access expert tips, advanced tools, and educational resources that will help you master the RSI and other essential trading techniques.


