




Pi Network Price Forecast: PI declines further, risking fresh record lows
- Pi Network extends losses on Tuesday, following a roughly 7% decline the previous day.
- Crypto market sentiment deteriorates, weighing on community-driven tokens.
- The technical outlook for PI is bearish, with next support at the $0.0700 record low.
Pi Network (PI) price is trading in the red on Tuesday, extending losses after a 7% decline the previous day. The PI token faces intense downside pressure as broader crypto market sentiment deteriorates, risking a steeper decline below the record low of $0.0700.

Pi Network risks further downside as the crypto market sentiment declines
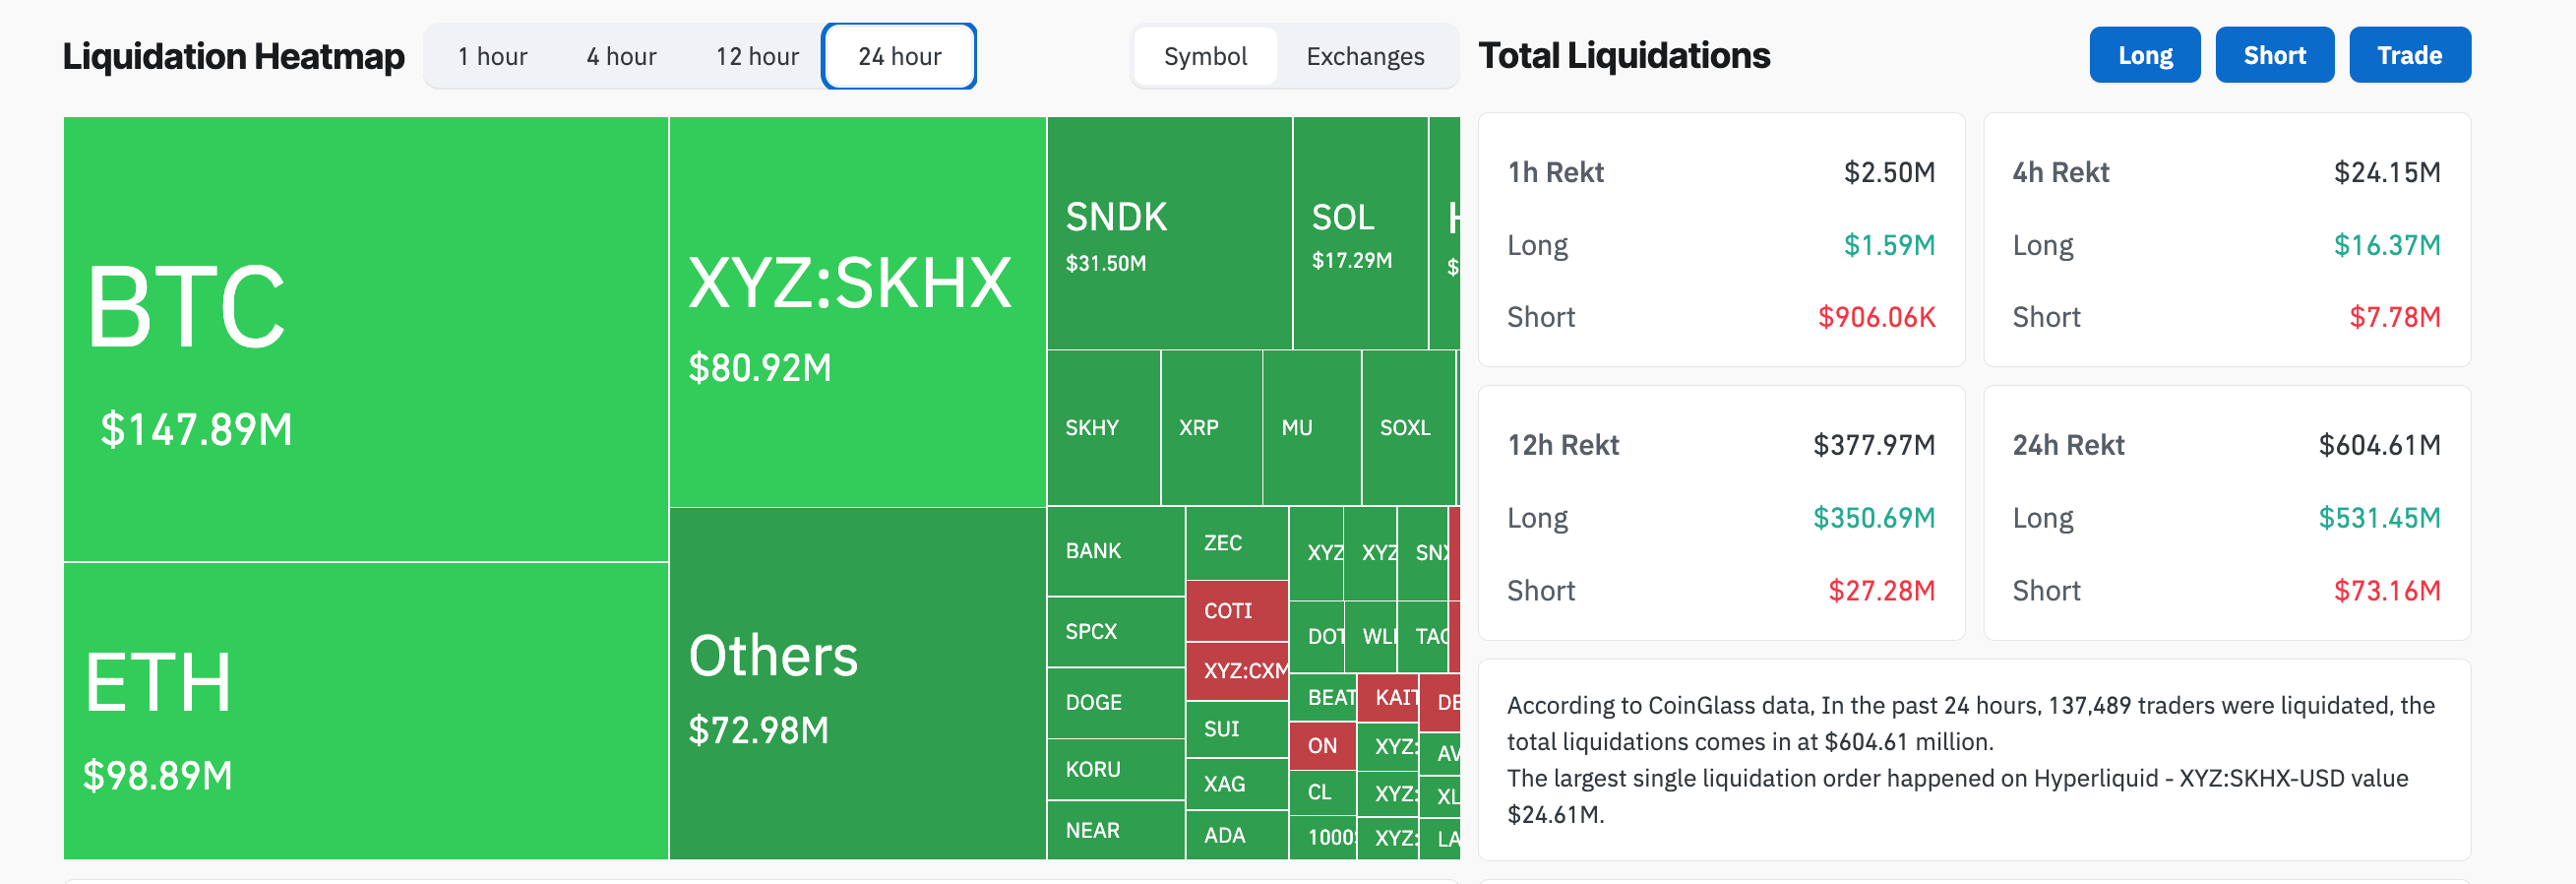
The broader crypto market faces renewed selling pressure this week. CoinGlass data shows $604 million in total liquidation, led by $531 million of long liquidation, reflecting a sell-side bias.
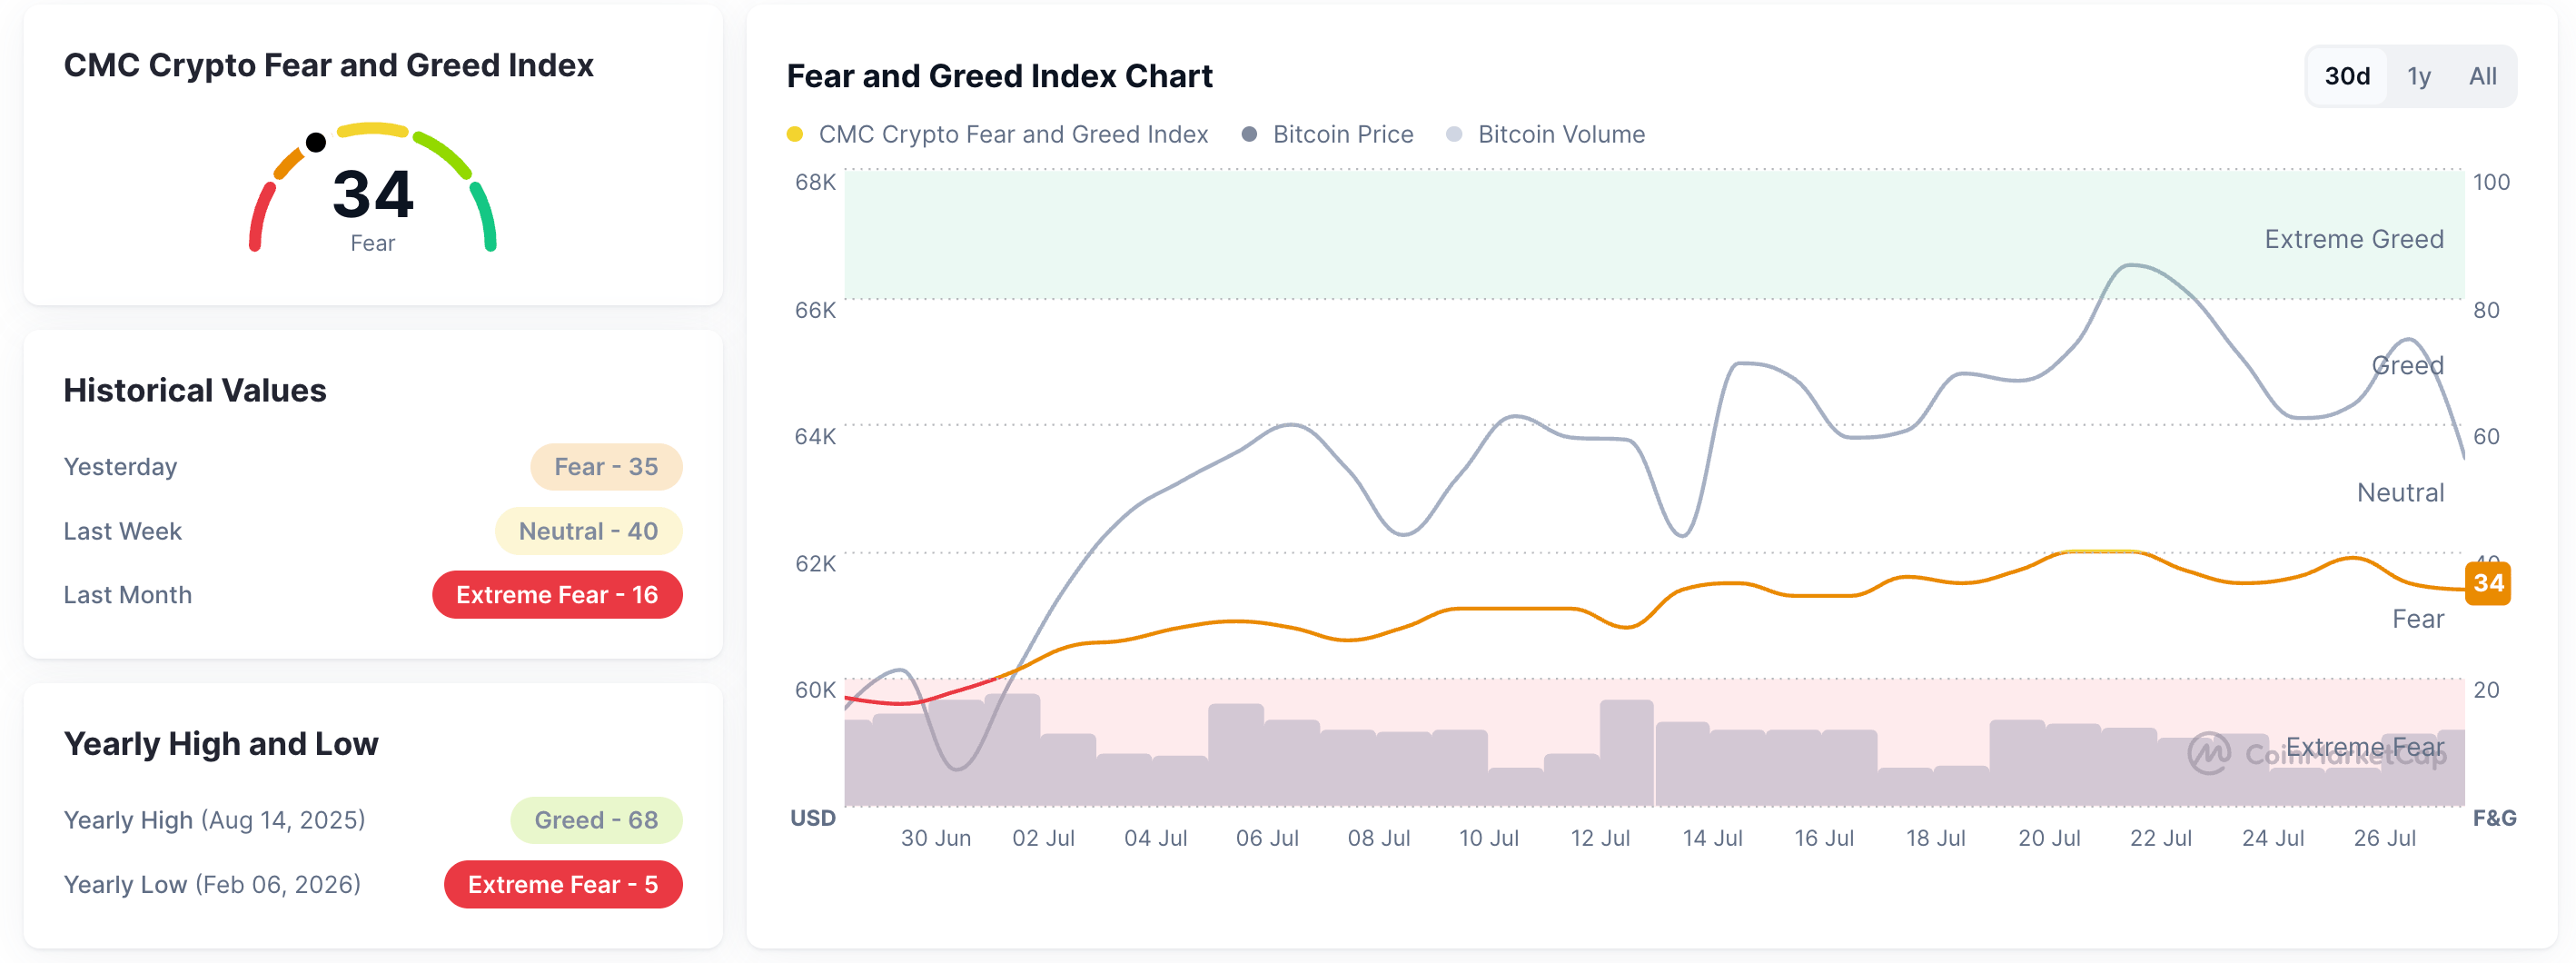
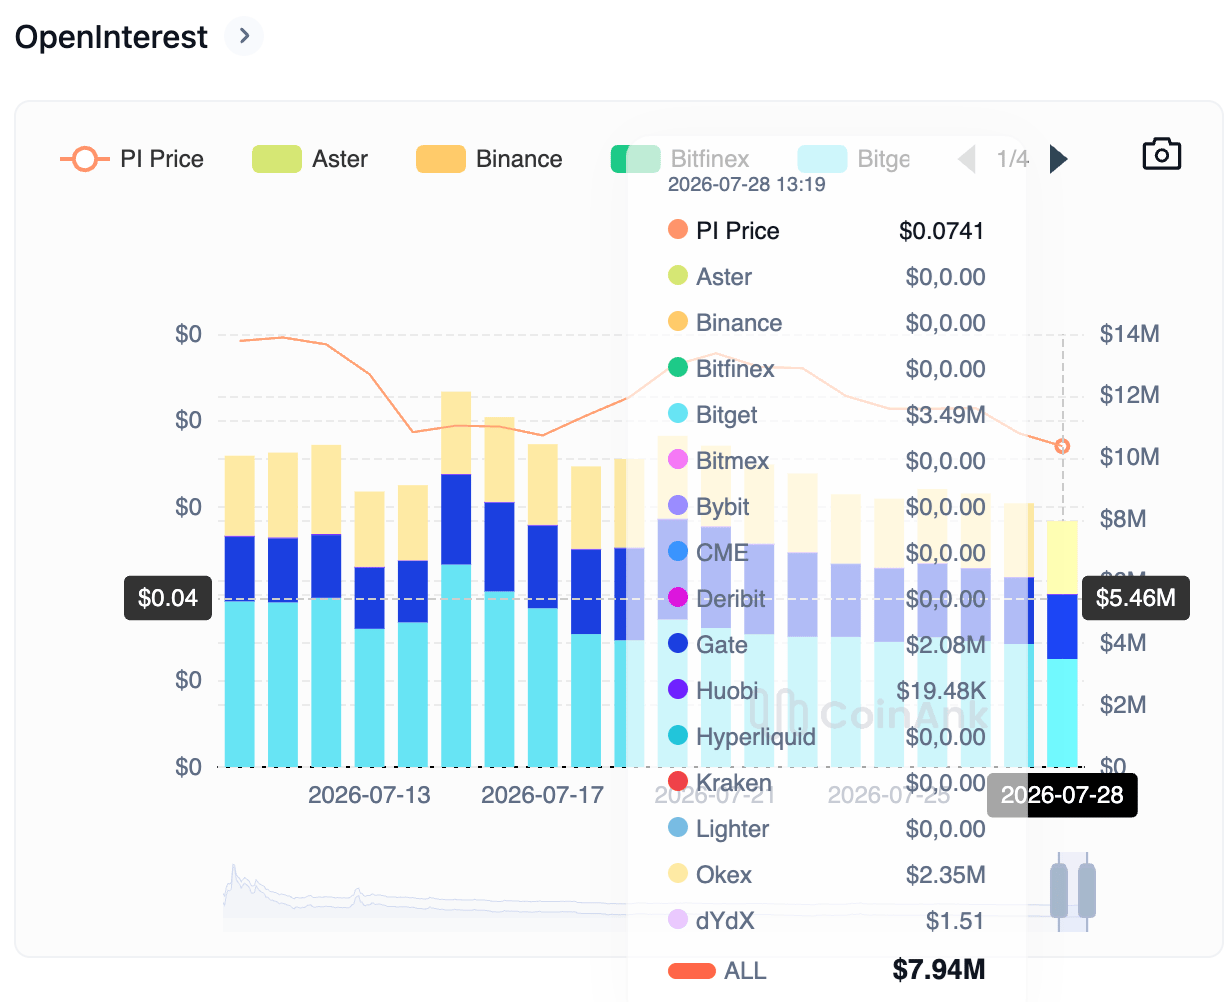
At the same time, CoinMarketCap’s Fear and Greed Index is at 34, down from 39 on Sunday as the market sentiment shifts risk-off from neutral. Given the strong correlation between the PI token and crypto market sentiment, risk-off conditions increase downside risk. CoinAnk data show a steady decline in PI Open Interest (OI) to $7.94 million, down from $12.14 million on July 15.
How low will Pi Network go?
Pi Network maintains a bearish near-term bias as price remains well below the 50- and 200-day Exponential Moving Averages (EMAs) at $0.1064 and $0.1719, respectively. From a technical perspective, PI has been trending downward within a falling channel pattern on the daily chart for roughly three months.
The PI token has shown a steady decline over the last week, approaching its recent low of $0.0700. A sustained close below this level could target the 200% Fibonacci extension level at $0.0368, measured from $0.1998 to $0.1183.
The Directional Movement Index shows a widening gap between the negative and positive DI lines, while the ADX line stabilizes near 39, hinting at renewed momentum.
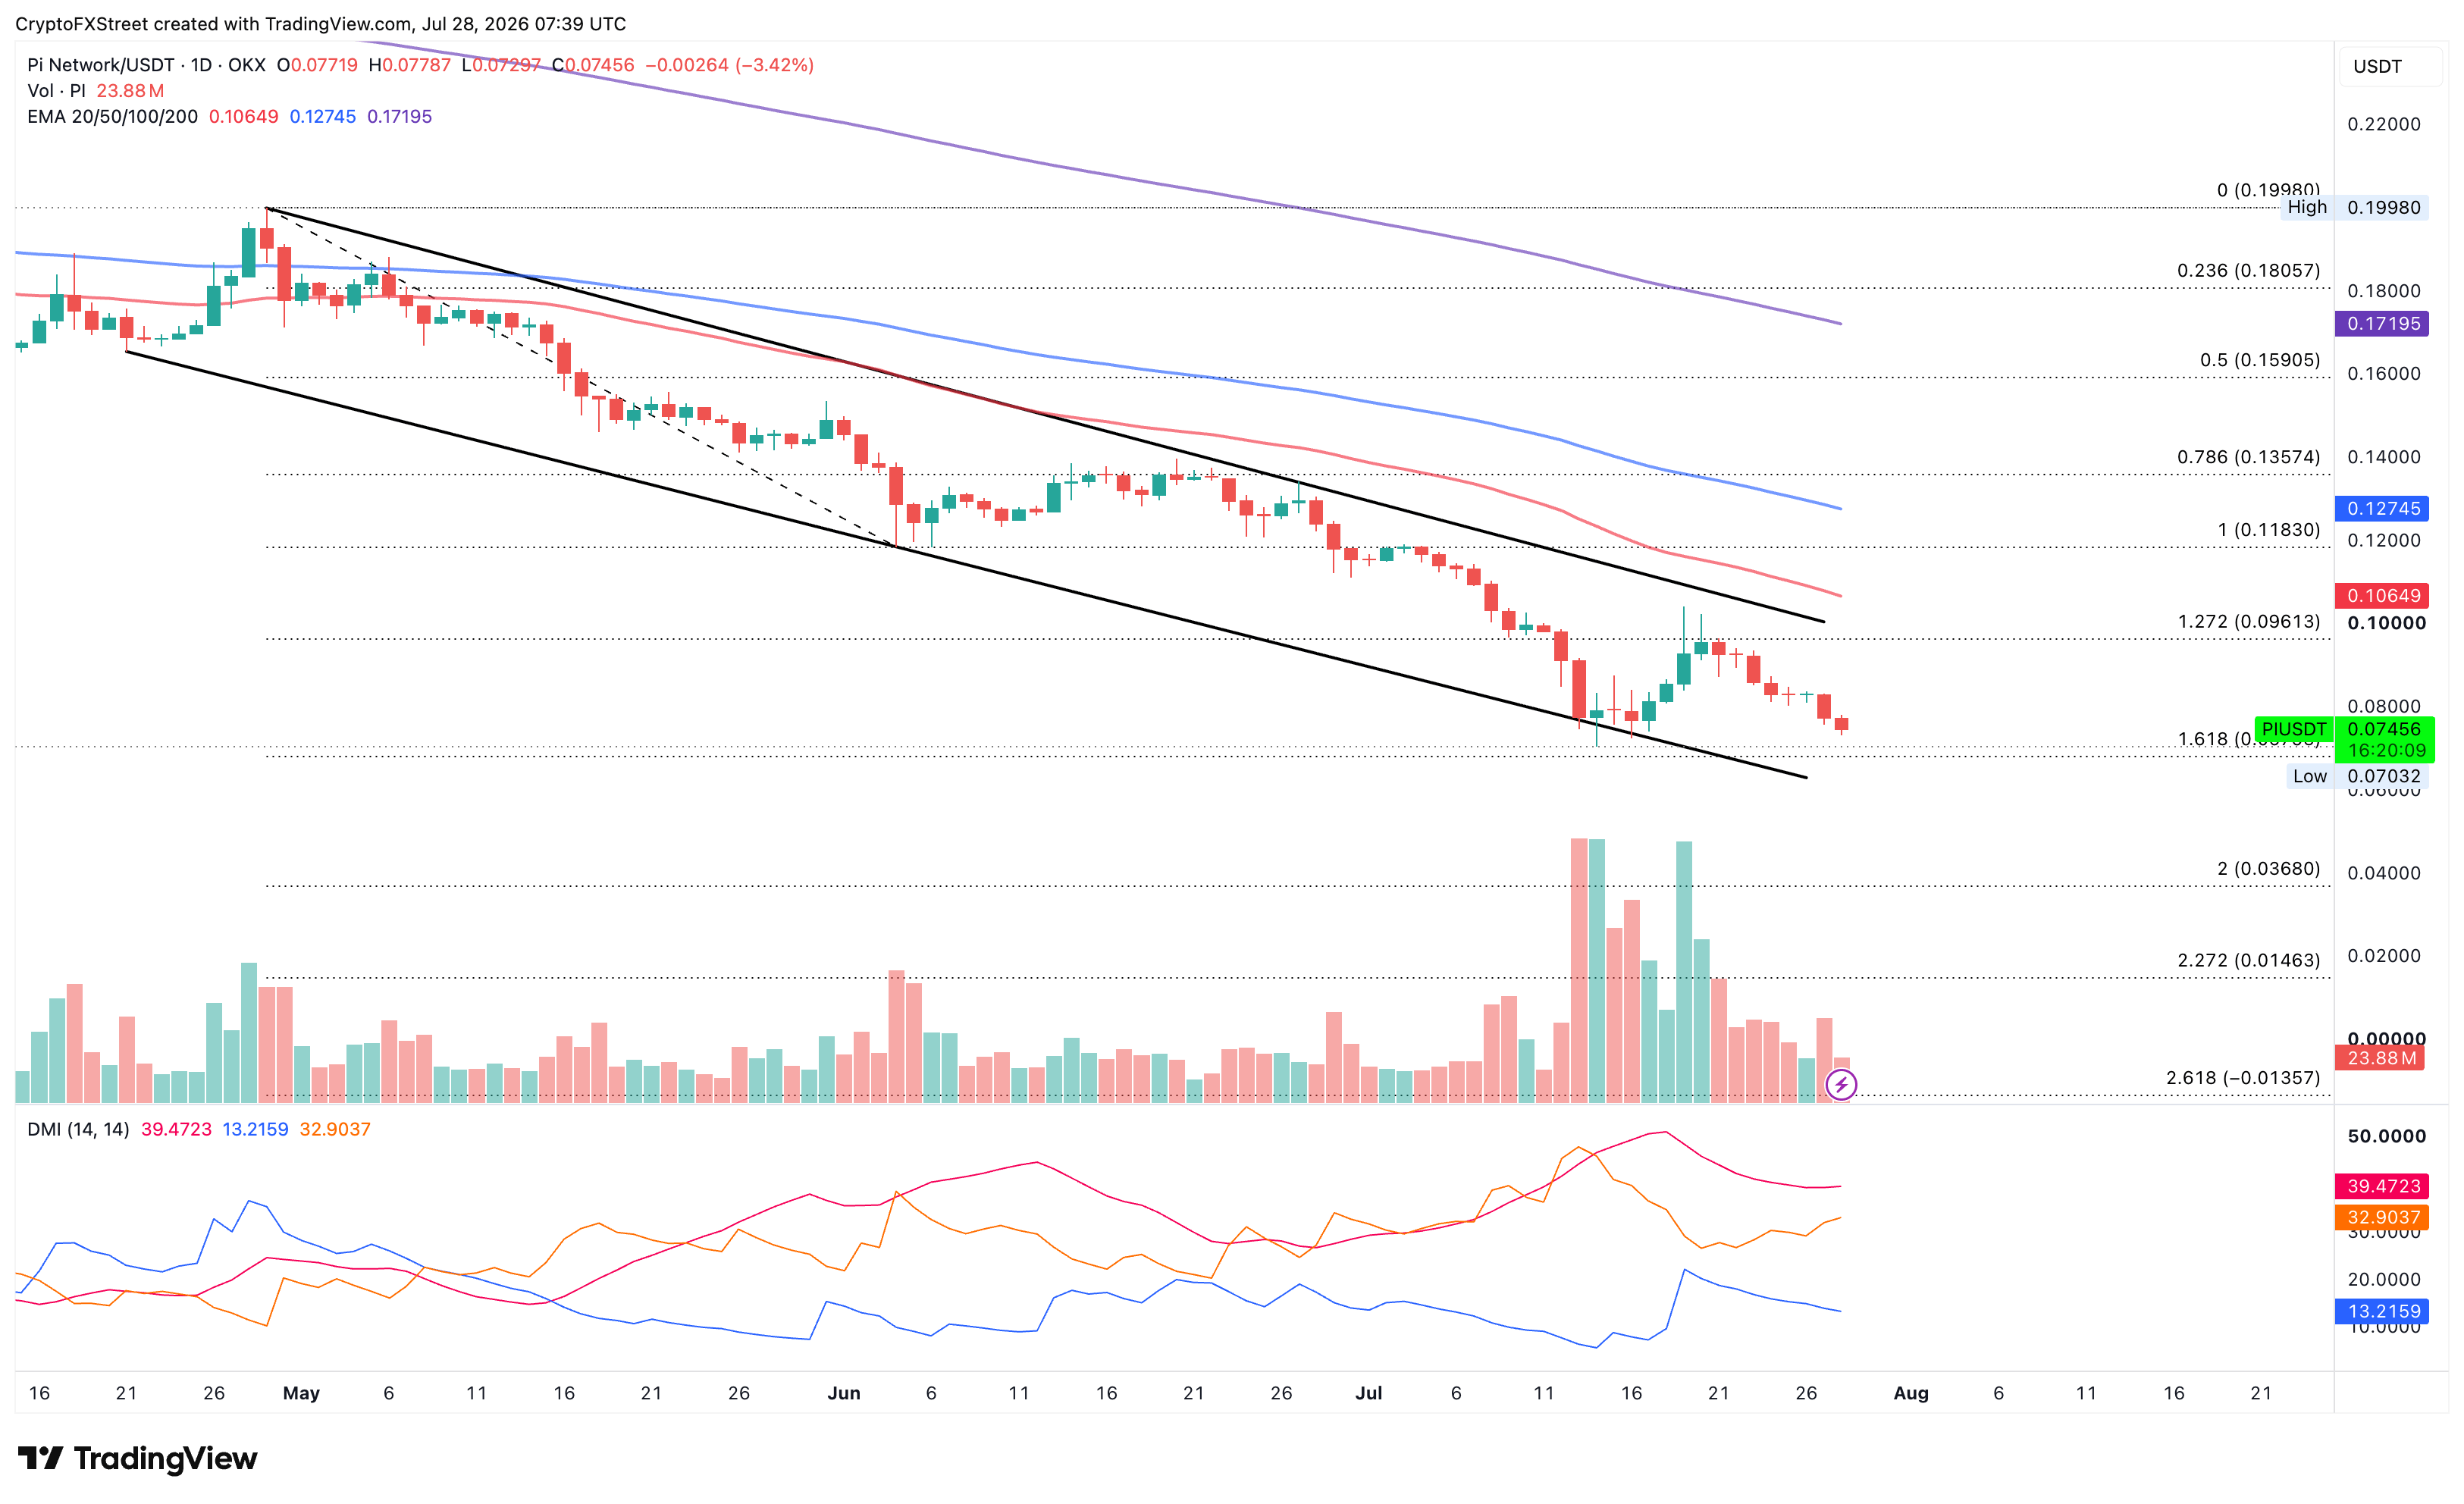
On the topside, initial resistance is located at the 127.2% Fibonacci extension level at $0.0961, followed by the overhead trendline near the $0.1000 psychological mark.
(The technical analysis of this story was written with the help of an AI tool. Know more.)













