
News & AnalysisCareer

A simultaneous shift to bearish readings across Bitcoin’s (BTC) market indicators has prompted fears of a deeper correction for the leading cryptocurrency, even though historical comparisons point to similarities with earlier market bottoms.

CryptoQuant’s Bull Score Index fell to 20 from 90 on 13 October in less than four weeks, signalling a marked deterioration in market conditions, the firm said in a report published on Wednesday.
April 2025 saw the most recent decline of a similar scale, after a tariff-driven market sell-off. The index likewise reached 20 on that occasion, then rebounded to 80 within two months as Bitcoin formed a local bottom.
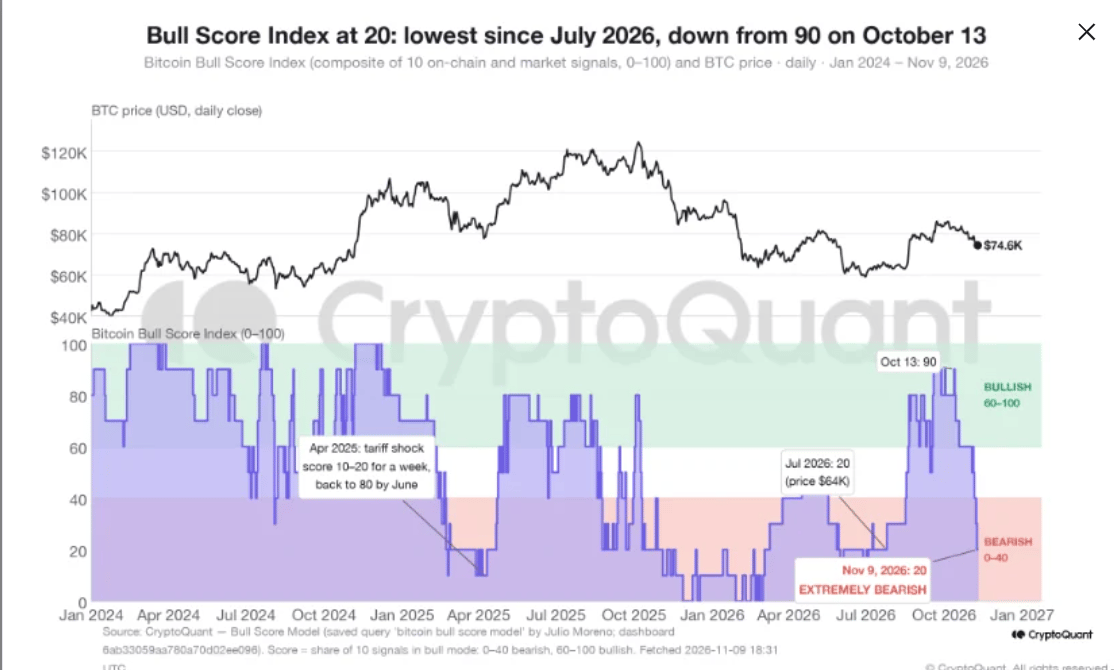
Several factors lie behind the latest downturn, the firm cautioned: profit-taking after September’s rally, a more hawkish outlook for the Federal Reserve (Fed), the Binance hack and the Republicans’ midterm defeat.
The report stated: "The April 2025 collapse had a single cause and reversed as soon as the tariff news faded. This one is broader, which argues for a slower repair,"
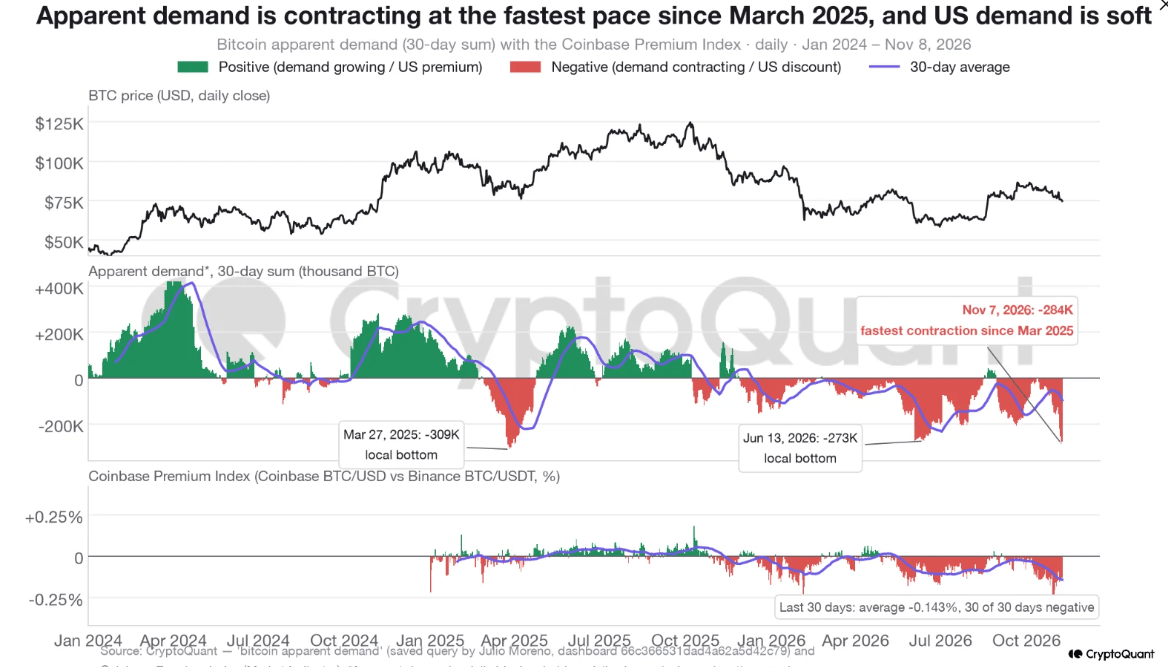
Over 30 days, Bitcoin’s apparent demand shrank by 284,000 BTC, its sharpest decline since 28 March 2025. According to CryptoQuant, comparable contractions during March 2025 and June-July 2026 coincided with local market bottoms. Apparent demand contracted by 309,000 BTC in March 2025 and by 273,000 BTC in June 2026.
With the Coinbase Premium Index negative throughout the past 30 days and averaging -0.14%, the firm identified weak US buying pressure as a possible barrier to recovery.
CryptoQuant wrote: "In both earlier episodes the premium turned positive before or as demand recovered; US buyers led the bottom. That has not happened yet,"
A $6.6 billion decline in Tether’s USDT market capitalisation over 60 days also points to deteriorating stablecoin liquidity. This is the largest contraction in CryptoQuant’s available data, which extend back to mid-2022, the firm said.
By comparison, the contraction following the FTX collapse in December 2022 amounted to $3.2 billion, less than the latest decline.
The firm noted: "This is the first time in the current cycle that USDT supply, apparent demand and the Bull Score have all been at or near their lows at once,"
As rallies in the current cycle have depended on expanding stablecoin supply to provide fresh liquidity, CryptoQuant cautioned that the contraction could reduce the likelihood of a Bitcoin recovery.
CryptoQuant noted: “Stablecoin supply is the dry powder of the crypto market; when it shrinks, new demand for Bitcoin has to come from somewhere else,”
The 365-day moving average at $76,400 has also given way, with Bitcoin’s break below it viewed by CryptoQuant as a bearish signal. Attention now turns to the 200-day moving average at $73,200 as the next significant support level. A move back above the 365-day average would help re-establish Bitcoin’s bullish market structure, the firm said.
CryptoQuant wrote: “The 365-day average is itself declining, falling about $40 a day, so reclaiming it gets slightly easier each week the price holds,”
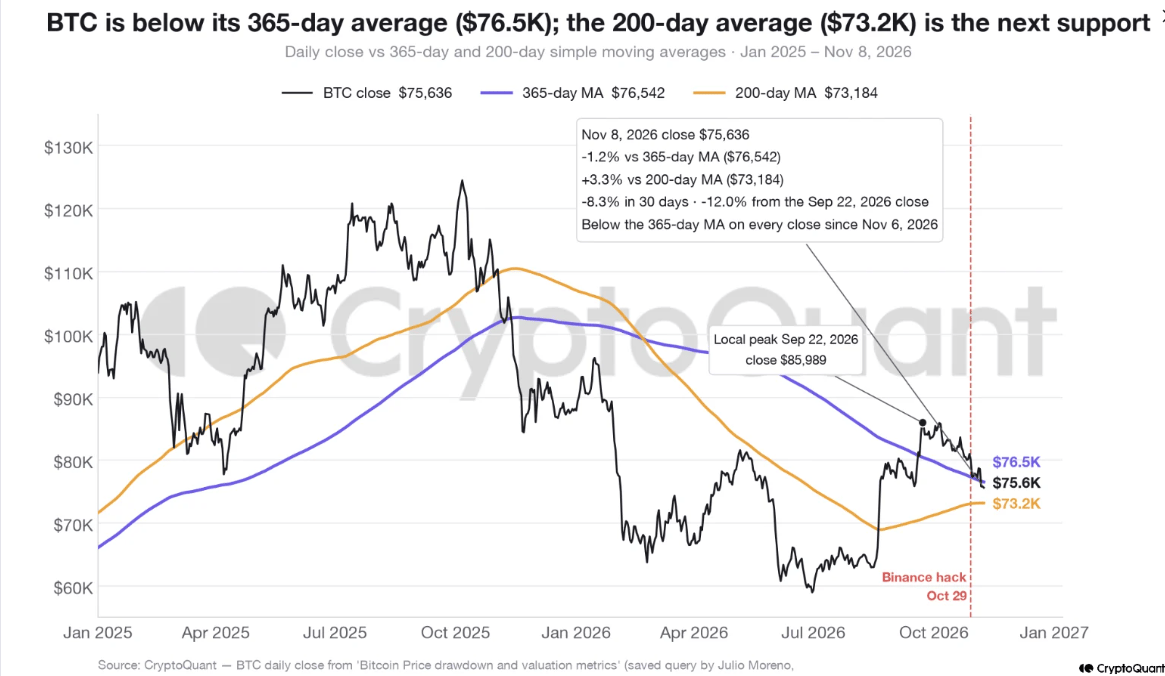
A continued slide towards or beneath the 200-day average could reinforce the case for a more pronounced correction, CryptoQuant cautioned.
The report added: “The 200-day moving average at $73.2K is the level that separates a shallow correction from a deeper one,”
At the time of writing, Bitcoin trades at $74,400 after gaining 1.3% over the past 24 hours.










The information provided on this website is of a general nature only and does not constitute personal financial advice. Before acting on any information on this website, you should consider the suitability of the information in relation to your objectives, financial situation and needs. Investing in CFDs and FX Margin Contracts carries significant risks and is not suitable for all investors. You may lose more than your initial deposit. You do not own, or have, any interest in the underlying asset. We recommend that you seek independent advice and ensure you fully understand the risks involved before trading. It is important that you read and consider the disclosure document before you acquire any product listed on the website. The information and advertisements offered on this website are not intended for use by any person in any country or jurisdiction where such use would be contrary to local laws and regulations. The Products and Services offered on this website are not intended for residents of the United States, Malaysia and Thailand.
TMGM is authorized and regulated in various jurisdictions.
Trademax Australia Limited, trading as TMGM, is regulated by the Australian Securities and Investments Commission (ASIC), AFSL no. 436416 and is located at Level 28, One International Tower, 100 Barangaroo Avenue, 2000 Sydney, NSW Australia.
Email: support@tmgm.com.au
Trademax Global Limited, trading as TMGM, is authorized and regulated by the Vanuatu Financial Services Commission (VFSC), registration number 40356 and registered at 1276, Kumul Highway, Port Vila, Vanuatu, Republic of Vanuatu.
Email: support@tmgm.com
Trademax Global Markets (SE) Limited, trading as TMGM, is authorized and regulated by the Financial Services Authority (FSA) of Seychelles, with license number SD224. The company is registered at Office No 13, Providence Estate ABIS Centre, Mahe, Seychelles.
Email: support@tmgm.com
Trademax Global Markets (International) Pty Ltd, trading as TMGM, is authorized and regulated by the Financial Services Commission, Mauritius (FSC) with license no. GB22201012, and registered at 33, Edith Cavell Street C/o IQ EQ Fund Services (Mauritius) Ltd Port Louis, 11324 Mauritius.
Email: support@tmgm.com
Copyright © TMGM. All rights reserved


