
News & AnalysisCareer

With Bitcoin (BTC) trading around $74,000 on Wednesday, cryptocurrency prices are largely consolidating close to key support levels below. Ethereum (ETH), the largest smart contract token, remains above $2,000, but its technical structure continues to limit gains. Meanwhile, Ripple (XRP) is holding precariously above $1.00, and the path of least resistance remains largely to the downside.

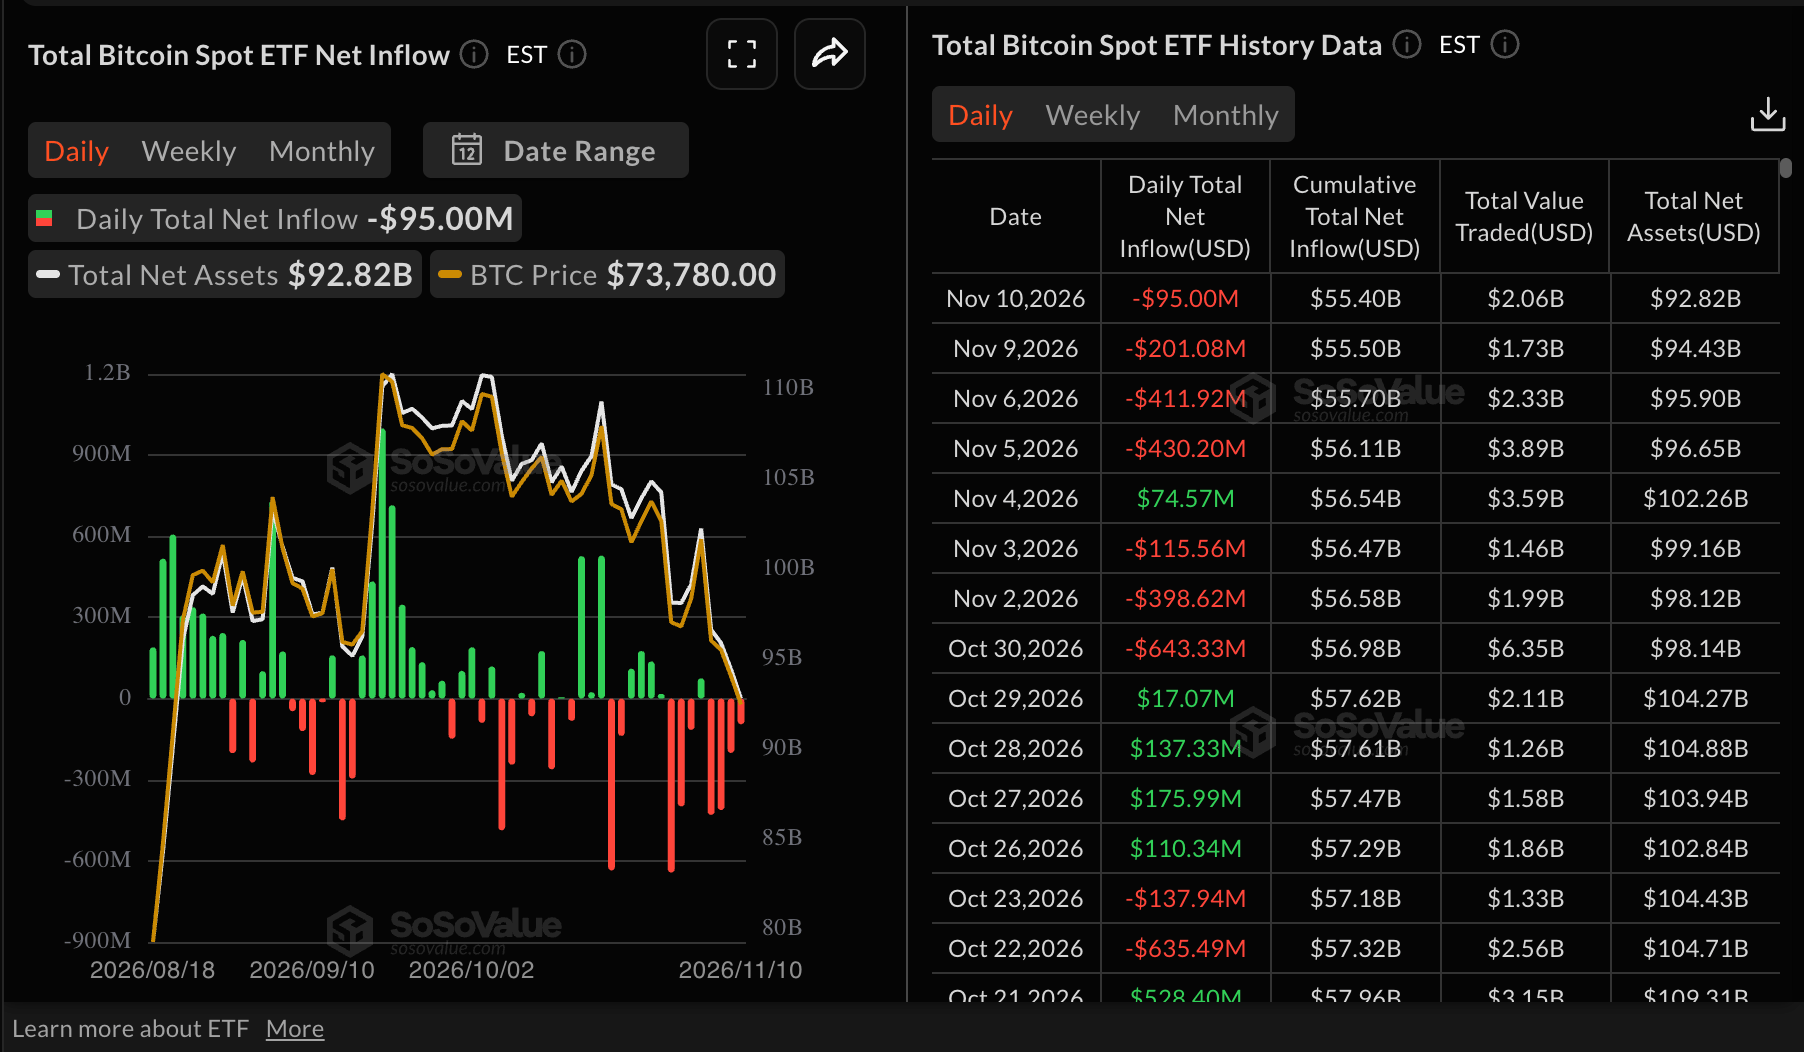
Bitcoin spot Exchange-Traded Funds (ETFs) shed $95 million on Tuesday, marking a fourth consecutive day of outflows as demand for digital investment products remains subdued. Total withdrawals for the week to Tuesday have reached $296 million.
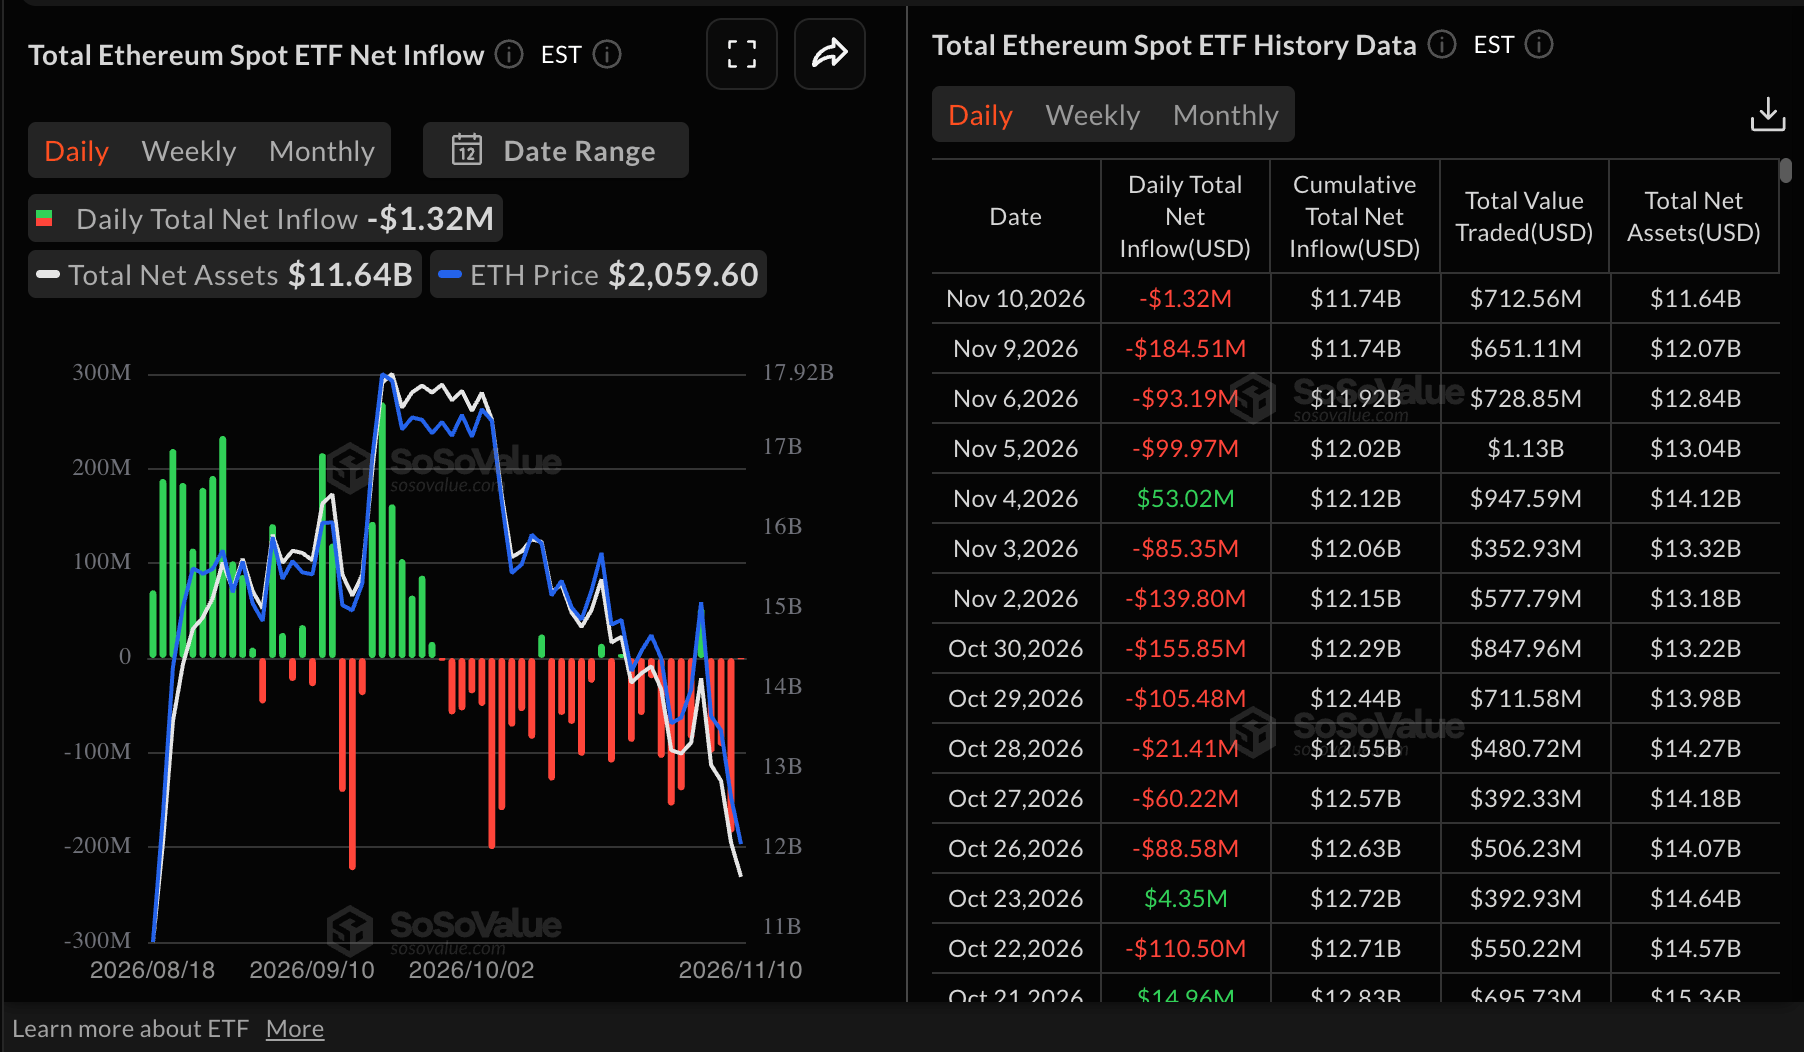
A modest $1.32 million left Ethereum spot ETFs on Tuesday, taking cumulative inflows to $11.74 billion. According to SoSoValue data, net assets under management average $11.64 billion, highlighting institutional investors’ positive long-term view of the underlying token.
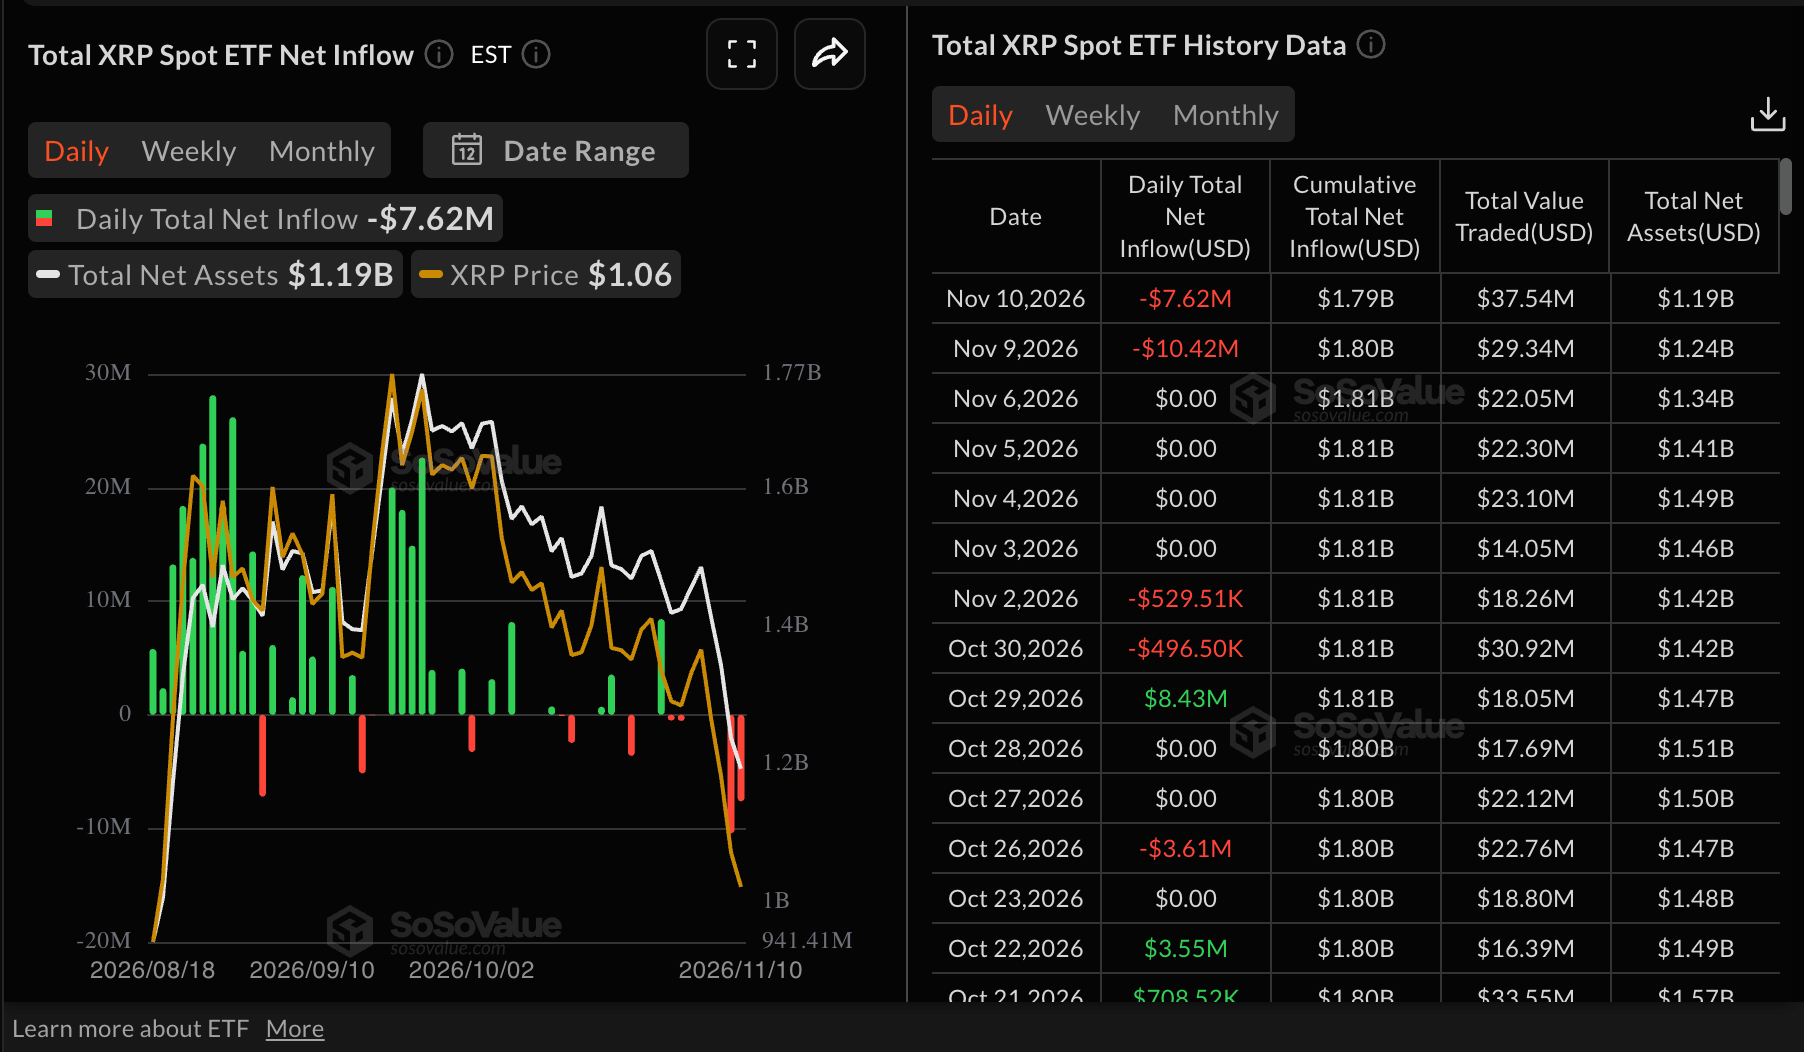
Tuesday brought almost $8 million in withdrawals from XRP spot ETFs, their second consecutive day of outflows. With net assets under management at $1.19 billion, cumulative outflows amount to $1.8 billion.
Across the wider market, the Fear & Greed Index points to muted risk appetite: Wednesday’s reading of 29 remains in Fear territory, compared with 32 a day earlier. Inflationary pressure in the United States (US) is another factor discouraging investors from taking positions. Adding to the pressure on sentiment, CME Group’s FedWatch Tool indicates an increased probability of the Federal Reserve (Fed) raising interest rates in December.
At $74,061, Bitcoin remains firmly beneath its 50-day, 100-day and 200-day Exponential Moving Averages (EMAs), leaving the near-term outlook clearly bearish. The first significant dynamic resistance is the 200-day EMA at $76,412. Beyond it lie the 100-day EMA at $77,487 and the 50-day EMA near $78,906, with the SuperTrend line around $80,249 adding to the broader resistance zone.
Although the immediate pace of selling is easing, momentum indicators still point to downside pressure. The Relative Strength Index (RSI) is close to 35, just above oversold territory, while the Moving Average Convergence Divergence (MACD) remains below zero.
A recovery would need to clear the 200-day EMA at $76,412 first to relieve immediate pressure. Further resistance would then come from the 100-day EMA around $77,487 and the 50-day EMA near $78,906, ahead of a test of the bearish structure marked by the SuperTrend at $80,249. The daily chart offers no clear indicator-based support, leaving scope for further tests of lower prices. A daily close above at least the 200-day EMA would be the minimum required for buyers to begin neutralising the current bearish set-up.
Trading at $2,065, Ethereum continues to fall well beneath its main moving averages, maintaining a firmly bearish near-term outlook. Overhead resistance includes the 200-day EMA at $2,301 and the 100-day EMA at $2,327. The SuperTrend line at $2,337 and the 50-day EMA at $2,347 provide further potential selling pressure above the market.
Despite indications that selling is losing steam, momentum remains weak. The RSI is near 31, just above the oversold band, and the MACD line is deeply negative, signalling continued downward pressure.
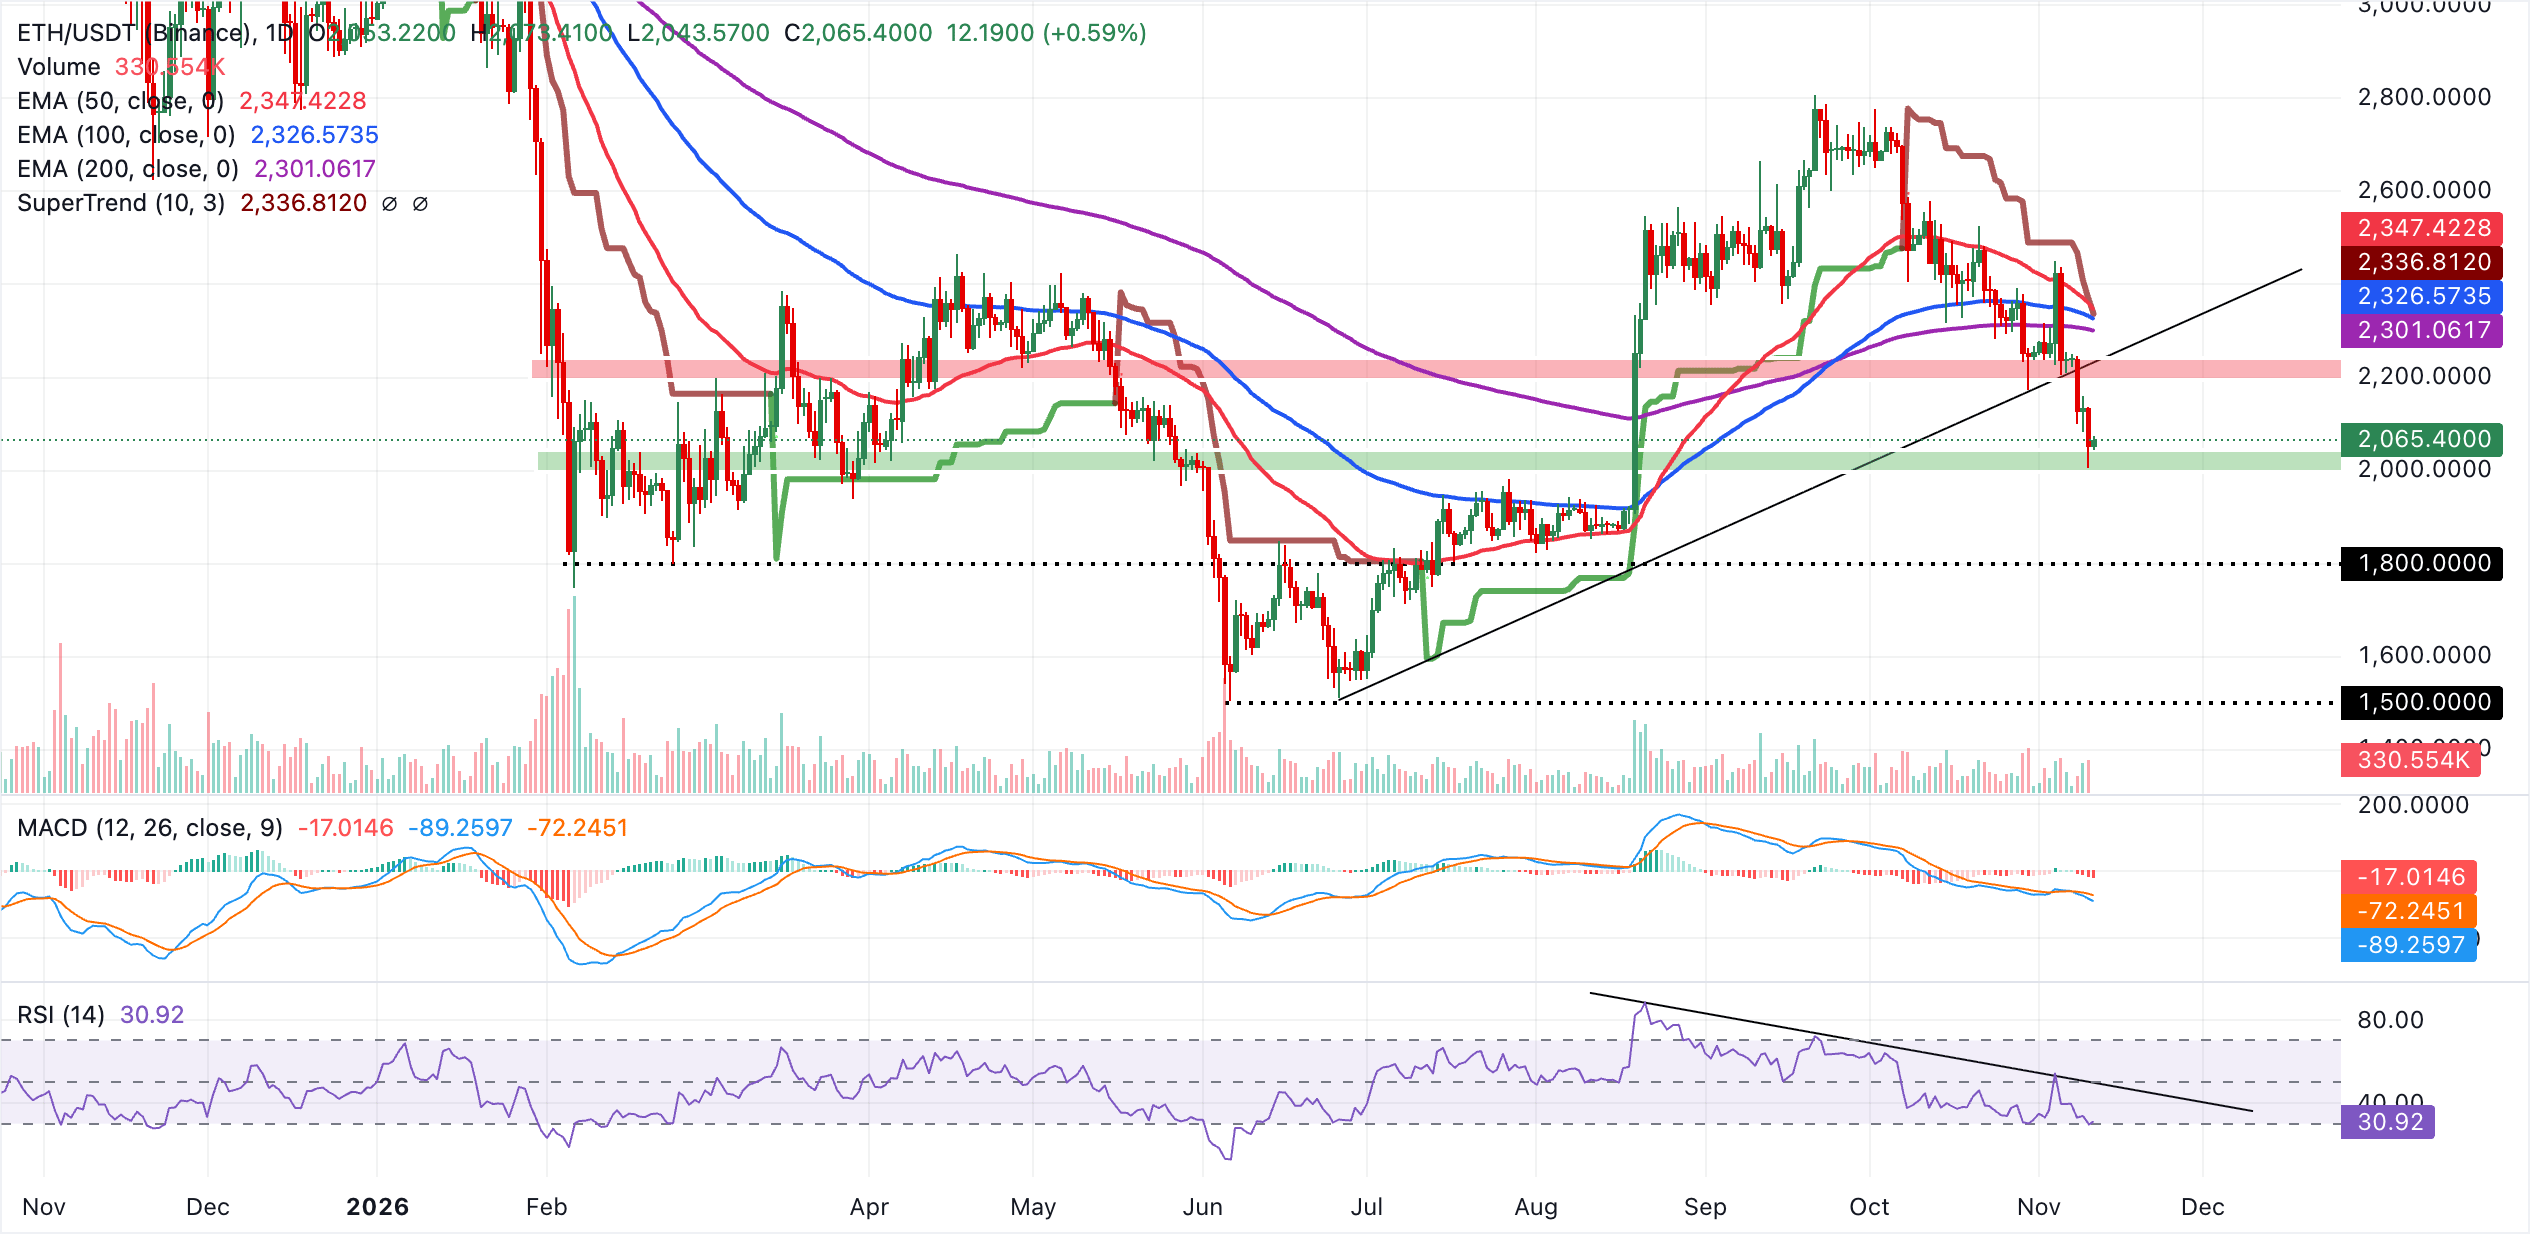
Any bounce faces its first test around $2,234, the area of the broken rising trendline. A sustained move above this level would bring a tightly packed resistance zone into view: the 200-day EMA at $2,301 and the 100-day EMA at $2,327, followed by the SuperTrend at $2,337 and the 50-day EMA near $2,347.
While ETH trades below these successive barriers, rallies are likely to attract selling. The possibility of another test of lower psychological levels therefore remains, although the current dataset identifies no clear structural support.
At $1.06, XRP remains in a bearish phase, trading substantially below the 50-day, 100-day and 200-day EMAs grouped between roughly $1.28 and $1.35. The SuperTrend at $1.22 presents another overhead barrier, further limiting recovery attempts.
A below-zero MACD suggests that negative pressure persists, reflecting weak momentum. Meanwhile, an RSI reading of 24 indicates oversold conditions that could temper the decline, but these have not yet produced a meaningful recovery.
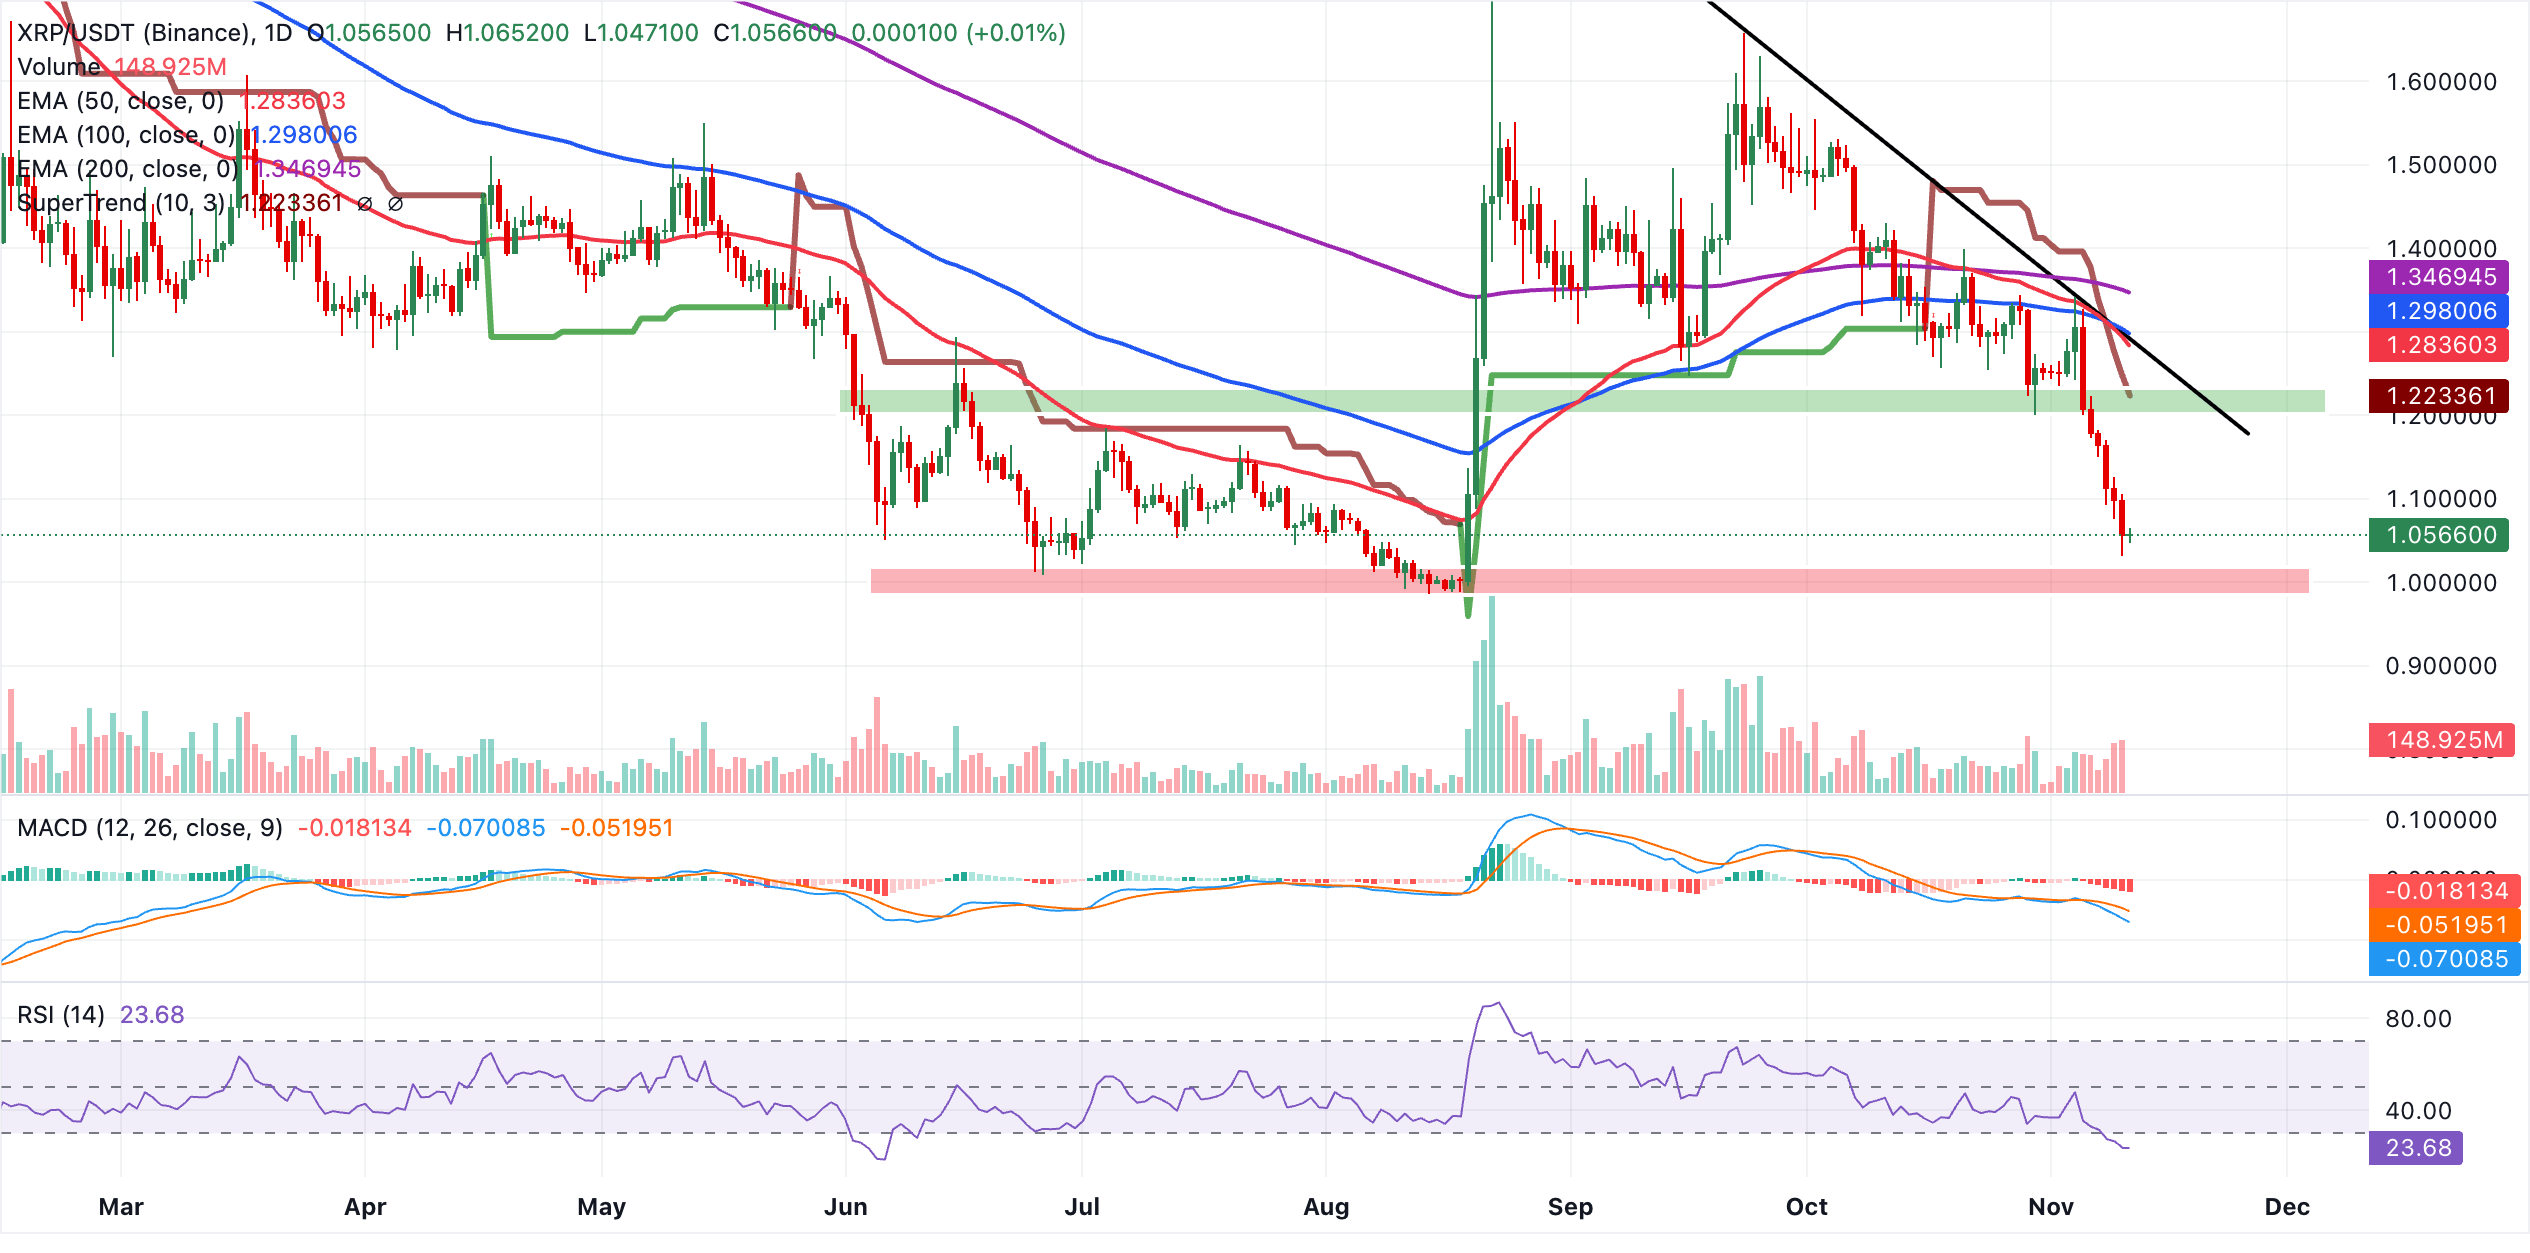
The first resistance lies near $1.22 at the SuperTrend, followed by a concentrated band of EMAs. Within that band, the 50-day EMA at $1.28 sits close to the broken downward trendline reference around $1.29 and the 100-day EMA at $1.30. Above these, the 200-day EMA at $1.35 is a more strategic obstacle; regaining it would be necessary to ease the broader bearish outlook.
The daily chart shows no clear technical support below the spot price, leaving the pair exposed to further losses for as long as it remains beneath this layered resistance zone. Only a daily close above the $1.22-$1.30 region would begin to point towards stabilisation.
(The technical analysis of this story was written with the help of an AI tool. Know more.)
Designed to follow the price of an underlying asset, an Exchange-Traded Fund (ETF) is an investment vehicle or an index. Its scope can extend beyond one asset to cover a basket of assets and sectors. A Bitcoin ETF, for instance, follows the price of Bitcoin. Investors use ETFs to obtain exposure to a particular asset.
Yes. In October 2021, approval for the first US Bitcoin futures ETF was granted by the US Securities & Exchange Commission. Seven Bitcoin futures ETFs have received approval in total, while more than 20 await the regulator’s permission. Citing the cryptocurrency industry’s newness and susceptibility to manipulation, the SEC says it has delayed crypto-related futures ETFs over the past few years.
Yes. Several Bitcoin spot Exchange-Traded Funds were cleared for listing and trading by the SEC in January 2024. This allowed institutional capital and mainstream investors to trade the leading cryptocurrency, a decision the industry welcomed as a game changer.
Gaining exposure to a cryptocurrency without owning it is the chief benefit of crypto ETFs, reducing the risks and costs of holding the asset directly. They also require less learning and offer greater security for investors, as responsibility for safeguarding the underlying holdings rests with the ETFs. The principal drawback is the absence of direct asset ownership, summed up by the crypto saying “not your keys, not your coins.” Fees charged by ETFs for active management are another disadvantage, increasing the costs associated with holding crypto. Lastly, although ETFs reduce the risks involved in holding an asset, fluctuations in the underlying cryptocurrency’s price are likely to feed through to the investment vehicle as well.










The information provided on this website is of a general nature only and does not constitute personal financial advice. Before acting on any information on this website, you should consider the suitability of the information in relation to your objectives, financial situation and needs. Investing in CFDs and FX Margin Contracts carries significant risks and is not suitable for all investors. You may lose more than your initial deposit. You do not own, or have, any interest in the underlying asset. We recommend that you seek independent advice and ensure you fully understand the risks involved before trading. It is important that you read and consider the disclosure document before you acquire any product listed on the website. The information and advertisements offered on this website are not intended for use by any person in any country or jurisdiction where such use would be contrary to local laws and regulations. The Products and Services offered on this website are not intended for residents of the United States, Malaysia and Thailand.
TMGM is authorized and regulated in various jurisdictions.
Trademax Australia Limited, trading as TMGM, is regulated by the Australian Securities and Investments Commission (ASIC), AFSL no. 436416 and is located at Level 28, One International Tower, 100 Barangaroo Avenue, 2000 Sydney, NSW Australia.
Email: support@tmgm.com.au
Trademax Global Limited, trading as TMGM, is authorized and regulated by the Vanuatu Financial Services Commission (VFSC), registration number 40356 and registered at 1276, Kumul Highway, Port Vila, Vanuatu, Republic of Vanuatu.
Email: support@tmgm.com
Trademax Global Markets (SE) Limited, trading as TMGM, is authorized and regulated by the Financial Services Authority (FSA) of Seychelles, with license number SD224. The company is registered at Office No 13, Providence Estate ABIS Centre, Mahe, Seychelles.
Email: support@tmgm.com
Trademax Global Markets (International) Pty Ltd, trading as TMGM, is authorized and regulated by the Financial Services Commission, Mauritius (FSC) with license no. GB22201012, and registered at 33, Edith Cavell Street C/o IQ EQ Fund Services (Mauritius) Ltd Port Louis, 11324 Mauritius.
Email: support@tmgm.com
Copyright © TMGM. All rights reserved


