


What is Fibonacci Retracement?
Fibonacci retracement is a widely utilized technical analysis tool aimed at identifying potential support and resistance levels within financial markets. It's based on the Fibonacci sequence, a series of numbers where each number is the sum of the two preceding numbers: 0, 1, 1, 2, 3, 5, 8, 13, 21, and so on.
Key Fibonacci ratios used in trading include
23.6%
38.2%
50% (not a Fibonacci number, but widely applied)
61.8%
78.6%
These ratios stem from the mathematical relationships within the Fibonacci sequence. For example, 61.8% is the inverse of the golden ratio (1 / 1.618), while 38.2% is derived by dividing a Fibonacci number by the number two places to its right in the sequence.
The Golden Ratio Connection
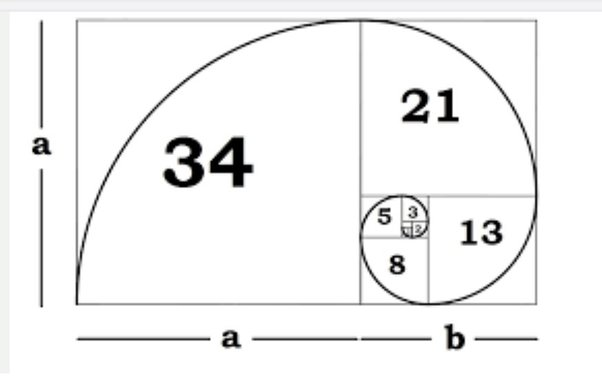
The golden ratio, approximately 1.618 or its inverse 0.618, is inherently linked to the Fibonacci sequence. As the sequence progresses, the ratio between consecutive numbers converges toward the golden ratio. This mathematical principle frequently appears in nature, from the spiral of a nautilus shell to the arrangement of leaves on a stem. Many traders consider it significant in financial markets as well.
The golden ratio (61.8%) is often regarded as the most critical Fibonacci level in trading. Traders across various markets (forex trading, cryptocurrency trading, gold trading and others) closely monitor this level, as price often shows significant reactions upon reaching it.
How to Use Fibonacci Retracement in Trading
Fibonacci retracement is a preferred tool for identifying potential support and resistance zones during price pullbacks. It is most effective in trending markets, helping traders pinpoint areas where price may pause, reverse, or continue its trend.
Identifying Market Trends Before Plotting Fibonacci Levels
Assess whether the market is in an uptrend or downtrend. This step is essential because Fibonacci retracement relies on directional price movements to predict potential reaction zones.
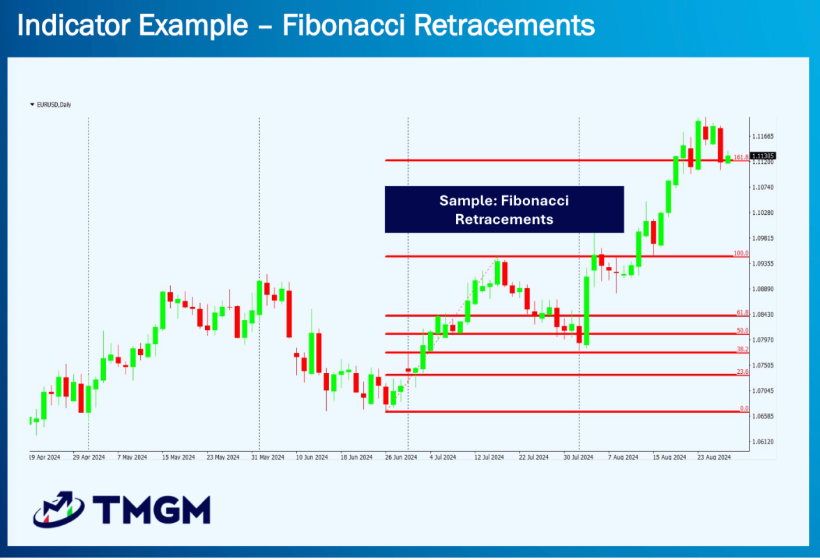
How to Plot Fibonacci Retracement Levels
Select a significant swing high and swing low to define the price move. In an uptrend, draw the tool from the low to the high; in a downtrend, draw it from the high to the low. Most trading platforms include built-in Fibonacci tools that automate this process.
Analyzing Support and Resistance Using Fibonacci Levels
Once plotted, the retracement tool automatically displays common levels such as 23.6%, 38.2%, 50%, 61.8%, and 78.6%. These levels act as potential support in an uptrend or resistance in a downtrend. Monitor price reactions at these zones as potential entry or exit signals.
Combining Fibonacci Retracement with Other Indicators
Enhance your strategy by combining Fibonacci retracement with other technical indicators such as trendlines, RSI, MACD, or moving averages. This confluence improves the reliability of trading signals.
Using Fibonacci Retracement Across Multiple Timeframes
Apply Fibonacci levels on different timeframes to identify overlapping zones. Confluence across timeframes often signals stronger support or resistance, increasing the likelihood of a price reaction.
Practice Tips for Mastering Fibonacci Trading
Start by practicing on demo or paper trading accounts to accurately identify valid swing highs and lows. Review your trades to refine your approach and build confidence before trading with real capital.
Advanced Fibonacci Techniques
Fibonacci Extensions for Profit Targeting
Fibonacci extensions go beyond the 100% retracement level to help traders identify potential profit-taking targets, such as the 127.2% and 161.8% levels.
How Fibonacci Traders Map Trend Continuations
Fibonacci fans consist of diagonal lines based on retracement ratios. They are used to identify potential trend continuation zones or dynamic support and resistance levels.
Using Fibonacci Time Zones to Forecast Market Timing
Instead of focusing on price, Fibonacci time zones apply the sequence to time intervals. This method helps anticipate potential reversal or breakout points in the future.
Spotting Fibonacci Clusters for Strong Confluence Zones
Fibonacci clusters occur when multiple retracement or extension levels from different price moves converge in the same area. These clusters often indicate strong price barriers.
Limitations and Considerations
Subjectivity in Plotting Fibonacci Levels
Different traders may select different swing points, leading to variations in the displayed levels. Consistent practice and a standardized methodology in choosing points are crucial.
The Self-Fulfilling Prophecy of Fibonacci Levels
Since many traders use Fibonacci levels, price reactions at these points may sometimes result from collective market behavior rather than purely technical factors.
Why Fibonacci Should Not Be Used in Isolation
Avoid relying solely on Fibonacci retracement. Incorporate it within a comprehensive trading strategy supported by price action analysis and other technical indicators.
When Fibonacci Retracement May Be Ineffective
In ranging or highly volatile markets, Fibonacci retracement signals can be unreliable. It performs best in markets exhibiting clear directional trends.
Applying Fibonacci Retracement with TMGM
TMGM (Trademax Global Markets) is a reputable broker that equips traders with the essential tools and platforms to effectively implement Fibonacci retracement strategies. With its robust trading infrastructure, comprehensive educational resources, and commitment to client success, TMGM offers a reliable environment for traders aiming to leverage Fibonacci techniques in their trading.
When trading with TMGM, you can utilize Fibonacci retracement in several ways:
MetaTrader 4 and 5 Integration: TMGM provides MT4 and MT5 platforms with built-in Fibonacci tools, enabling you to easily apply Fibonacci retracement to any chart and customize the levels' appearance.
Multi-Asset Application: TMGM offers access to diverse markets, including forex, indices, commodities, and cryptocurrencies. Fibonacci retracement can be applied across all these asset classes, providing a broad range of trading opportunities.
Educational Resources: TMGM offers educational materials and webinars that often cover advanced trading techniques, including Fibonacci retracement. Use these resources to deepen your knowledge and improve your application of this tool.
Risk Management: Always apply sound risk management when using Fibonacci retracement within your TMGM trading account. Use stop-loss and take-profit orders aligned with Fibonacci levels to manage exposure effectively.
Demo Account Practice: Before applying Fibonacci retracement in live trading, utilize TMGM'’’s demo account feature to practice and refine your strategy without risking real funds.
Leveraging the power of Fibonacci retracement alongside TMGM'’’s robust trading infrastructure can significantly enhance your trading strategy and decision-making process. However, always remember that no trading tool is infallible, and it's essential to integrate Fibonacci retracement within a comprehensive trading plan that includes thorough market analysis and disciplined risk management.


