


Key Takeaways (RSI Indicator)
The RSI is a momentum oscillator indicating when assets are overbought or oversold.
It assists in identifying trend reversals, trend strength, and optimal entry and exit points.
It is most effective when combined with tools such as moving averages, Fibonacci retracement levels, MACD, and trendlines.
Traders should always consider market context and implement risk management practices.
The RSI performs well across forex, equities, and commodities, making it a versatile indicator for all traders.
How the RSI Indicator Works
The Relative Strength Index (RSI) is a widely utilized momentum oscillator that measures the velocity and magnitude of price movements. It calculates the ratio of recent average gains to average losses over a specified period, typically 14 bars. This straightforward yet powerful indicator helps traders identify overbought and oversold market conditions, potential trend reversals, and confirm trend strength.

Here’s the methodology:
RSI Calculation Formula:
RSI = 100 - (100 / (1 + RS))
Where RS (Relative Strength) = Average Gain over N periods ÷ Average Loss over N periods
This yields a value ranging from 0 to 100:
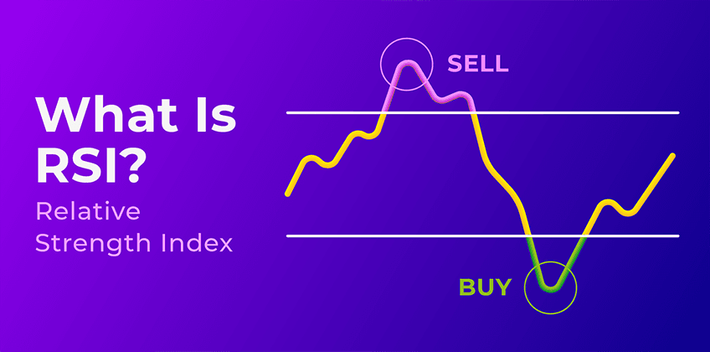
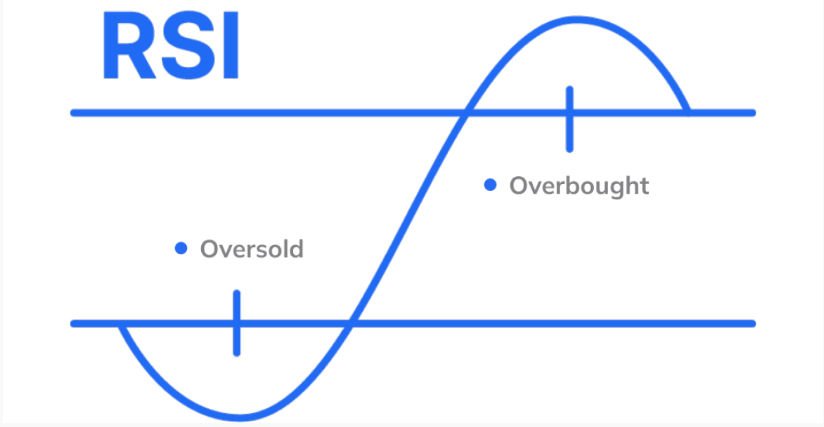
Above 70: Indicates the asset may be overbought , signaling a possible price correction.
Below 30: Suggests the asset may be oversold, implying a potential upward price adjustment.
Between 30–and 70: Considered a neutral zone where traders often seek additional confirmation signals.
Example: If a stock’’s RSI surpasses 70, it may be deemed overbought, increasing the probability of a price decline. Conversely, if RSI falls below 30, the stock could be oversold and poised for a rebound.
RSI Indicator in Forex, Equities, and Commodities
The RSI indicator is effective across multiple asset classes:
Forex Trading:
Forex markets exhibit continuous price fluctuations. RSI aids in identifying when currency pairs are overbought (above 70) or oversold (below 30).
Equity Trading:
RSI helps identify stocks that are overextended or undervalued based on recent price movements.
A stock consistently showing RSI above 70 may indicate overheating, while readings below 30 could signal undervaluation and buying opportunities.
Commodity Trading:
Commodities such as gold, Brent crude oil, and silver follow pronounced cyclical patterns. RSI helps identify potential cycle shifts.
Example: An RSI above 70 during a gold rally may signal an opportune moment to take profits.
Confirming Trends with the RSI Indicator
RSI is valuable not only for timing entries and exits but also for confirming trend strength.
In Uptrends: RSI typically remains above 50, supporting bullish momentum.
In Downtrends: RSI often stays below 50, confirming bearish momentum.
Example: During a sustained EUR/USD uptrend, RSI holding above 50 reinforces the case for maintaining long positions.
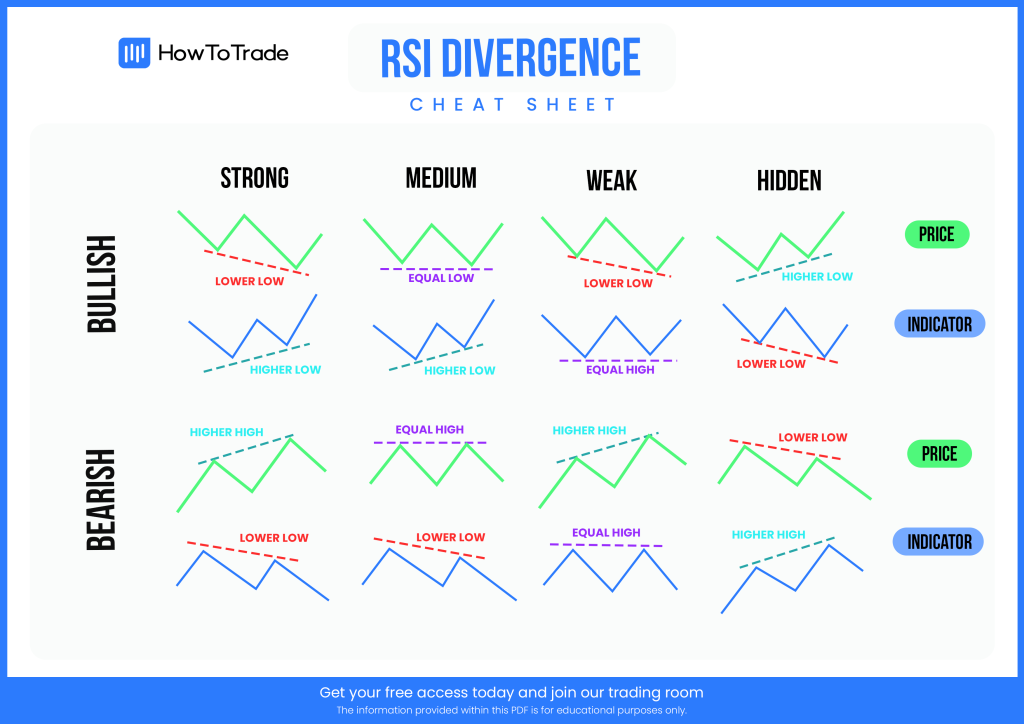
RSI Divergence: A Strong Signal
Divergences between price action and RSI can signal weakening trends or imminent reversals.
- Bearish Divergence: Price forms higher highs while RSI forms lower highs, indicating waning momentum and a potential sell-off.
Bullish Divergence: Price makes lower lows while RSI makes higher lows, suggesting bearish momentum is fading and a reversal may be near.
Example: If GBP/USD hits a new low but RSI does not, traders might look for a bullish reversal setup.
Combining the RSI Indicator with Other Indicators
How to combine RSI with other indicators?
The RSI becomes more effective when used alongside complementary technical tools.
RSI + Moving Averages: An RSI overbought signal near resistance from a 200-day moving average can strengthen the case for entering a short position.
RSI + Fibonacci Retracement: An oversold RSI at the 61.8% Fibonacci retracement level may indicate a high-probability buying opportunity.
RSI + Trendlines: Confirm RSI signals with bounces or breaks of well-established trendlines.
RSI + Bollinger Bands: Identify volatility expansions or contractions in conjunction with RSI levels.
RSI + MACD: Use RSI to gauge momentum strength and MACD (Moving Average Convergence Divergence) for crossover confirmations.
Common RSI Indicator Pitfalls to Avoid
Overreliance on RSI:
Traders relying solely on RSI may encounter false signals. RSI should be integrated into a comprehensive strategy that includes trend analysis, support and resistance levels, and volume confirmation.
Ignoring Market Context:
In strong trending markets, RSI can remain in overbought or oversold zones for extended periods. Context is crucial——do’ not blindly sell just because RSI crosses 70 during a bullish trend.
Inadequate Risk Management:
RSI signals are not guarantees. Always employ stop-loss orders and appropriate position sizing. For example, an RSI overbought signal combined with a short position should include a stop-loss above recent swing highs.
RSI Indicator Across Different Markets: Forex, Equities, and Commodities
The RSI’’s adaptability makes it suitable for various markets beyond forex. Here’’s how it can be effectively applied in equity and commodity trading:
Equity Trading:
Use RSI to identify exhaustion during earnings-driven rallies or panic sell-offs.
Divergences during earnings seasons can provide early reversal signals.
Commodity Trading:
- RSI assists in navigating sharp commodity price swings driven by supply shocks or geopolitical events.
Example: RSI divergence during an oil price spike may indicate a speculative top
The Relative Strength Index (RSI) is an indispensable tool for traders, offering a clear and straightforward method to evaluate market momentum and potential price reversals. Its simplicity and effectiveness across various markets, including forex, equities, and commodities, make it especially valuable for novice traders.
Applying the RSI Indicator on TMGM’’s Platform
Trading with TMGM, a leading global CFD provider, offers numerous advantages, particularly for beginner traders aiming to utilize technical indicators like the Relative Strength Index (RSI). TMGM’’s platform is designed for ease of use, delivering a seamless experience whether trading forex, equities, or commodities.’
Using RSI on TMGM’’s Trading Platform:
Applying the RSI indicator on TMGM is straightforward and efficient. Whether using the web or desktop platform, the RSI can be configured within a few clicks to support any advanced trading strategy. Whether employing day trading or swing trading strategies across forex, equities, or commodities, the RSI is undoubtedly one of the most powerful indicators to master.
Here’’s how TMGM enhances RSI-based trading:
Customize RSI Periods: Adjust the RSI timeframe for scalping strategies or extend it for swing trading. TMGM enables you to tailor settings according to your trading style.
Optimized for Beginners
Ready to start trading with a platform that offers powerful tools like RSI and more? Visit TMGM today to explore their platform and elevate your trading. Whether you’re just starting out or aiming to refine your strategy, TMGM provides the tools and support necessary for success in the markets.


