


Key Takeaways:
Trendlines are diagonal lines drawn through significant highs or lows that serve as dynamic support and resistance levels across markets such as forex, cryptocurrencies, metals, equities, and indices. They assist traders of all styles—from day trading to swing trading—in quickly identifying whether the price is trending upward, downward, or sideways, enabling alignment of CFD trading strategies with the prevailing market momentum.
Trendlines provide clarity on price direction, highlight key support and resistance zones for more precise entries and exits, filter out market noise by focusing on critical highs and lows, and help assess volatility and momentum shifts by forming chart patterns like triangles, channels, and flags.
To draw effective trendlines, start with a clean price chart, use the trendline drawing tool to connect at least two swing highs in a downtrend or swing lows in an uptrend, extend the line forward, and adjust it until it touches three or more significant peaks or troughs, establishing a robust reference for future support, resistance, and trade entries.
Trendlines connecting at least three swing highs or lows are considered confirmed; the more times price retests these lines, the stronger and more reliable they become as support or resistance levels.
Markets primarily move in three ways—uptrends (higher lows), downtrends (lower highs), and sideways ranges—and traders utilize trendlines not only to identify these trends but also to implement strategies such as range trading and trendline breakout setups.
Range trading with parallel trendlines involves buying near the lower trendline and selling near the upper trendline, whereas breakout trading focuses on strong closes above or below trendlines (often accompanied by increased volume) to signal significant bullish or bearish moves.
Trendlines are valid only when they naturally connect at least two—ideally three—swing highs or lows, gain strength with repeated retests, lose reliability if too steep, and should always be confirmed with other technical indicators and overall market context rather than being forced onto irregular price swings.
What is a Trendline in Trading?
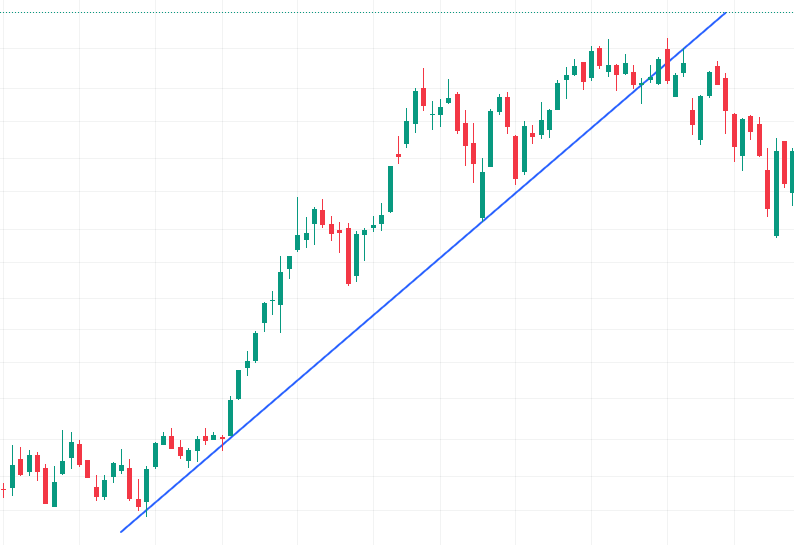
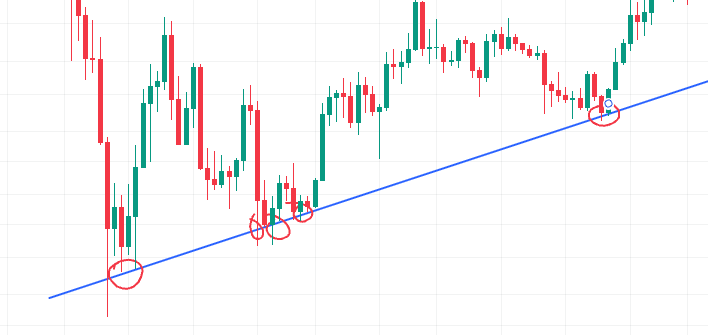
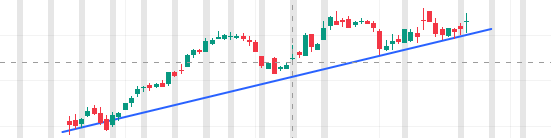
Trendlines are diagonal lines drawn by traders on price charts to illustrate the general direction of price movement—whether upward, downward, or sideways. Bullish trendlines are drawn by connecting a series of swing lows, clearly indicating an upward price trend in progress.'
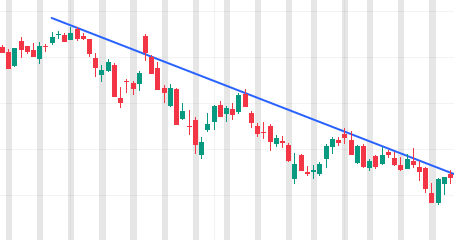
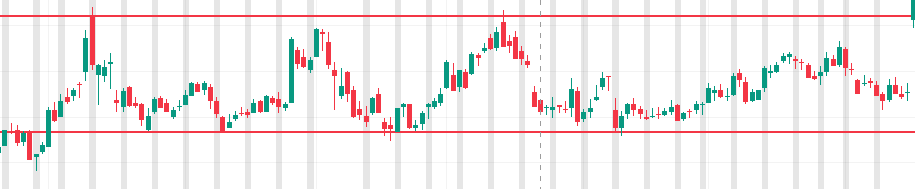
Conversely, bearish trendlines connect a series of swing highs, revealing a downward price trend. In markets lacking clear direction, sideways trendlines connect various highs and lows, indicating a ranging or non-trending market. A key feature of trendlines is their role as dynamic support and resistance levels, creating zones where prices often bounce or break through, making them essential tools for forecasting future price action.
Downward trendlines are drawn from swing highs sloping downward, signaling bearish sentiment in forex, energy, or indices markets.
Upward trendlines connect swing lows and slope upward, indicating bullish momentum in cryptocurrencies, equities, or metals.
Whether you trade forex, cryptocurrencies, metals, indices, or whether you employ day trading, swing trading or scalping, drawing a simple trendline through key highs or lows immediately reveals the market’s true direction’—cutting through market noise so you can identify when momentum is accelerating or decelerating.
By understanding whether the market respects these trendlines, traders can align CFD strategies on cryptocurrencies, gold, or stock indices with the most probable price direction.
Benefits of Using Trendlines in Trading
Trendlines provide several practical advantages across all major asset classes:
Visualize the prevailing price trend: They offer clear visual cues on whether prices are generally trending up, down, or sideways, applicable across all market types.
Identify support and resistance levels: Prices frequently react around trendlines, providing well-defined zones for entry and exit points.
Reduce market noise: Trendlines filter out minor price fluctuations by focusing solely on significant highs and lows, which helps reduce noise, especially for traders influenced by news or extraneous data.
Gauge volatility and momentum shifts: Drawing multiple trendlines (e.g., one above and one below price action) can reveal changes in momentum through the formation of chart patterns such as triangles, channels, and flags—collectively known as ‘Chart Patterns’.
Platforms like MetaTrader 4 and MT5 enable manual or automatic drawing of trendlines connecting highs and lows across any market, including gold, forex, cryptocurrencies, or equity charts, facilitating step-by-step mastery of trendline drawing.
How to Draw Trendlines
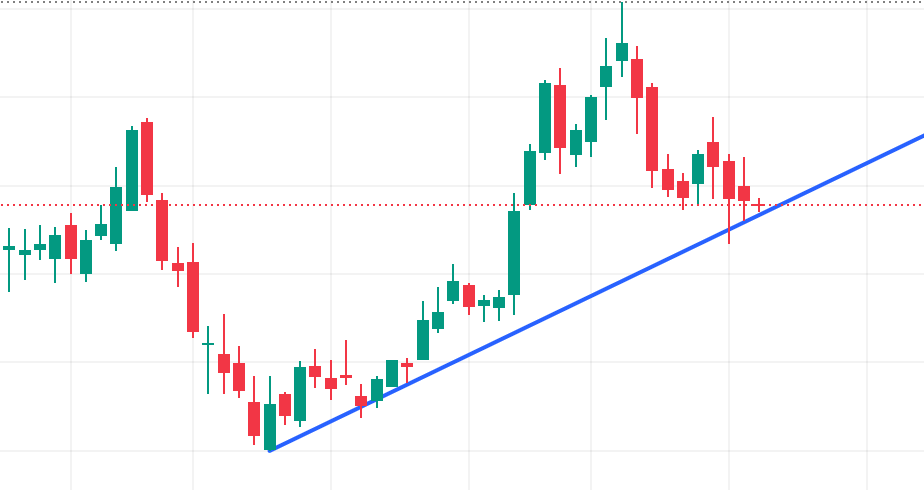
To draw trendlines, identify at least two "swing points" (swing highs for downtrends or swing lows for uptrends) on a price chart, then connect them with a straight line. A stronger trendline is established by connecting more points without price crossing the line, and the line should be extended forward to anticipate potential support or resistance levels.
Using trendlines in trading often yields better results across markets such as gold, forex, cryptocurrencies, commodities, and equities.
Follow these steps to draw accurate trendlines and master trendline-based trading:
Open a clean price chart without any indicators on your trading platform.
Identify the highest or lowest price points on the chart. For example, if planning a long (buy) position, focus on swing lows to draw a trendline that acts as a support level for entry decisions.
Locate the trendline tool in your charting software—usually represented by a slanted line icon and labeled as ‘Trendline’.
Adjust the trendline until it touches at least two significant swing highs or lows—with a minimum of three points for a robust trendline .
Important Note:
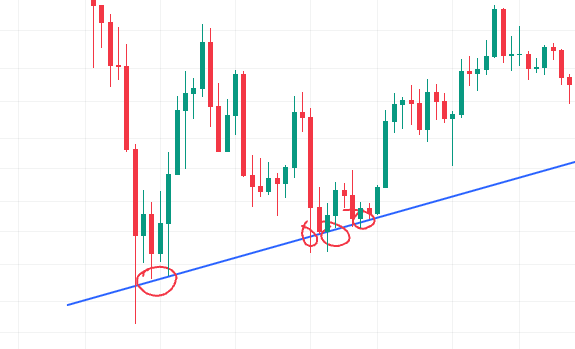
Trendlines drawn through multiple consecutive swing highs or lows are considered ‘tested multiple times’. Such trendlines carry the strength of ‘confirmation’ and tend to be revisited by price, providing reliable support or resistance levels.
Therefore, a valid trendline on any price chart and market—be it gold, forex, crypto CFDs, or other asset classes—should ideally have at least three swing points. The greater the number of touchpoints, the stronger the trendline signal.
How to Use and Trade with Trendlines
Types of Trends
There are three primary trend types:
Uptrend (characterized by higher lows)
Downtrend (characterized by lower highs)
Sideways trend (ranging or consolidation)
In addition to identifying uptrends and downtrends, professional traders employ other trendline-based strategies such as Range Trading and Trendline Breakout Trading.
Range Trading Using Trendlines
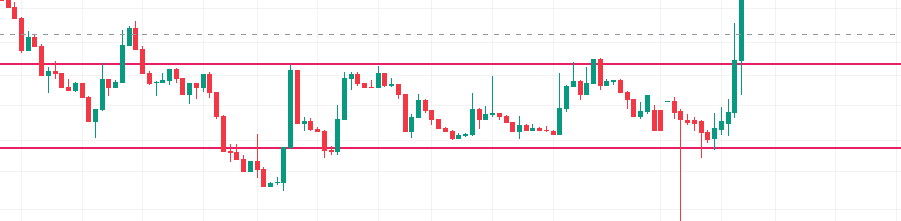
Range trading involves using parallel trendlines to form a price channel, allowing traders to:
Buy (go long) near the lower trendline when bullish confirmations are present.
Sell (go short) near the upper trendline when bearish signals emerge.
This approach is effective across gold, silver, energy commodities, and cryptocurrencies when trading CFDs, illustrating the versatility of trendline strategies.
Trendline Breakout Strategies
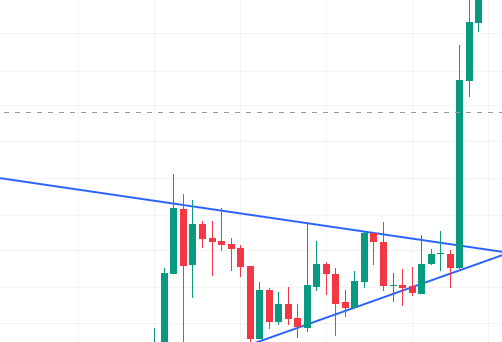
Breakouts through trendlines can trigger significant price moves:
A close above the upper trendline——often accompanied by increased volume——signals a bullish breakout.
A close below the lower trendline typically indicates a bearish breakout.
Traders can open long or short CFD positions on energy commodities or cryptocurrencies accordingly, using trendlines to time entries effectively.
Important Considerations and Cautions for Trend Trading
Limitations
Markets move in irregular swings, so a trendline alone does not guarantee direction and may simply reflect a counter-trend move or consolidation phase.
Always confirm trendlines with supporting technical indicators and broader market context across indices, forex, or commodities before executing trades.
Considerations
A valid trendline requires at least two swing highs or lows to be drawn, but typically three touches are needed for confirmation.
The steeper the trendline, the less reliable it tends to be and the higher the probability of a breakout.
Similar to horizontal support and resistance levels, a trendline gains significance the more times price tests it.
Most importantly, never force a trendline to fit the price action; if it does not align naturally with market swings, it should not be considered valid.
Applying Trendlines Across Different Markets
Trendlines can be applied across virtually all markets:
Indices (e.g., S&P 500, NASDAQ)
Forex majors and minors
Energy commodities (e.g., crude oil, natural gas)
Equities (CFDs on global stocks)
Metals (gold, silver, platinum)
Cryptocurrencies (Bitcoin, Ethereum, altcoins)
Trendline techniques are universal: the same principles apply to trendlines on cryptocurrency, metal, or equity charts.


