


Key Takeaways
- Swing trading targets price movements over several days to weeks', allowing traders to capitalize on trends with reduced screen time and typically larger price swings than day trading, balancing flexibility with disciplined risk management.
- The key to successful &profitable swing trading lies in patience to let trade setups develop and discipline to adhere to predefined exit strategies, minimizing impulsive trades and emotional reactions.
- Compared to scalping, day trading, and position trading, swing trading primarily utilizes 4-hour to daily charts to capture larger price moves with less frequent monitoring and trading activity.
- Benefits of swing trading include time efficiency, lower transaction costs, and capturing substantial price swings, while drawbacks encompass overnight gap risk, capital being tied up longer, and strategy sensitivity to varying market conditions.
- Beginner-friendly swing trading strategies include bull flag patterns, support and resistance bounces, moving average crossovers, Fibonacci retracements, and breakouts confirmed by range structure and volume analysis.
- Risk management focuses on position sizing (commonly 1–2% of capital per trade), stop losses based on Average True Range (ATR) or key price levels, maintaining favorable reward-to-risk ratios, and employing partial profit-taking or trailing stops.
- Top indicators for swing trading include volume-based tools (OBV, Volume Profile, Chaikin Money Flow), momentum oscillators (RSI, Stochastic, MACD), and trend indicators (EMAs, ADX, Ichimoku Cloud).
- A comprehensive swing trading plan defines market selection, timeframes, entry and exit criteria, position sizing, and review schedules, supported by backtesting results and a detailed trading journal for ongoing improvement.
- Starting swing trading on a broker platform like TMGM involves practicing on a demo account, utilizing risk management and educational resources, and consistently applying swing trading rules before transitioning to live trading.
What Is Swing Trading? Swing Trading Explained
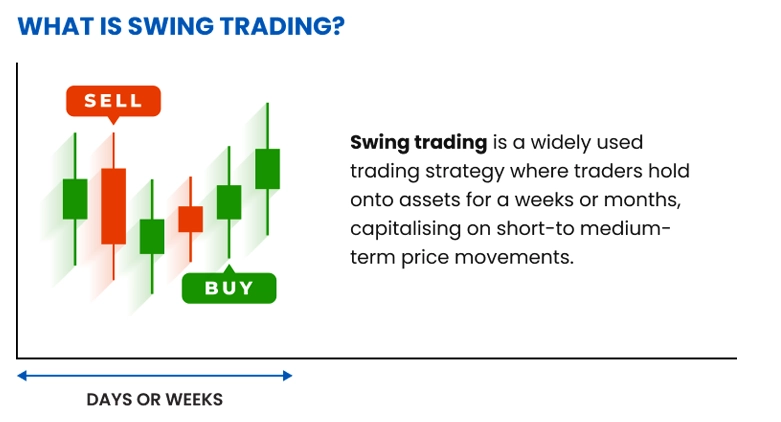
Figure 1: Swing trading is a strategy where traders hold positions for days, weeks, or months to capitalize on short- to medium-term price movements
Swing trading is a trading style aimed at capturing gains over several days to weeks. Unlike day trading strategies, which require opening and closing positions within the same trading day, swing trading permits holding positions overnight and through weekends. However, unlike position trading or investing, it does not involve holding assets for months or years.
The optimal timeframe for swing trades ranges from 2 days to several weeks. This approach suits traders who cannot monitor markets continuously but still want to benefit from market swings while filtering out intraday noise.
Swing traders ride the momentum of a trend (often capturing 20-30% moves) for a significant portion of its duration, rather than just brief segments. These price swings typically unfold in waves, including consolidations and retracements.
The Psychology Behind Swing Trading
Successful swing trading requires psychological balance akin to the discipline needed in margin trading. Swing traders must exercise patience to allow trades to develop per their analysis and discipline to take profits or cut losses at predetermined levels.
The psychological advantage of swing trading is reduced pressure for split-second decisions. With more time to analyze setups and manage positions, traders maintain clearer judgment and avoid emotional pitfalls common in day trading, such as revenge trading or overtrading.
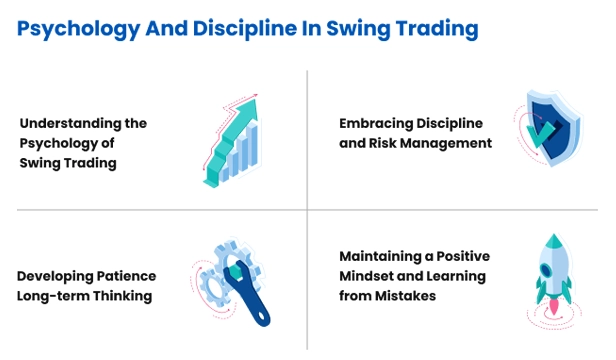
Figure 2: Key psychological and discipline factors essential for successful swing trading
Swing Trading Compared to Other Styles
To better understand swing trading, it is helpful to compare it with other popular trading styles:
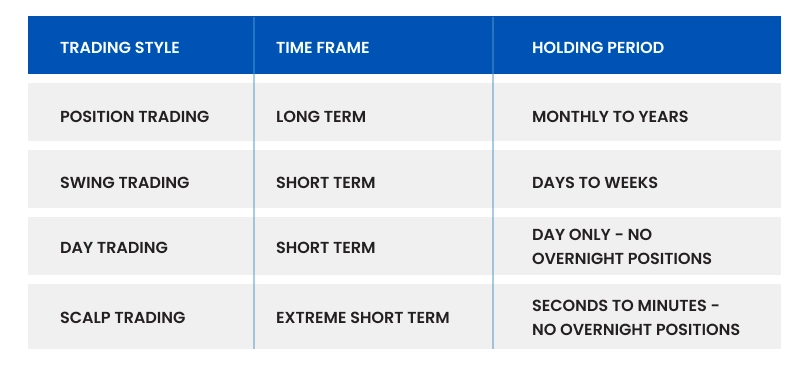
Figure 3: Side-by-side comparison of trading styles regarding monitoring requirements, capital allocation, and market approach
Day traders open and close positions within the same trading day
Swing traders hold positions for days or weeks
Day trading requires constant market monitoring; swing trading requires periodic review
Day traders typically use 1-minute to 1-hour charts; swing traders use 4-hour to daily charts
Position Trading vs Swing Trading:
Position traders hold trades for months or years
Swing traders exit positions after the swing completes (days to weeks)
Position traders emphasize fundamental analysis; swing traders rely more on technical analysis
Position trading requires less frequent monitoring than swing trading
Scalping vs Swing Trading:
Scalpers seek profits from very small price movements, holding positions for seconds to minutes
Swing traders target larger market moves
Scalpers execute dozens of trades daily; swing traders make fewer, more selective trades
Scalping demands intense focus and specialized execution tools; swing trading can be performed on standard platforms
Pros and Cons of Swing Trading
Advantages of Swing Trading
1. Time Efficiency
Swing trading requires less time commitment than day trading. The original document highlights that "swing traders can achieve comparable returns to day traders with less screen time. Since trades unfold over days, they are not required to monitor every tick." This efficiency suits traders balancing trading with other responsibilities, promoting better work-life balance and reducing burnout risk common among day traders.
2. Reduced Risk of Overtrading
With less screen time, swing traders are less prone to overtrading. The original text notes, "spending less time watching markets reduces temptation to overtrade. Unlike day traders who constantly analyze trades, some may take suboptimal trades just to remain active.' This psychological edge supports discipline and helps avoid emotional trading decisions that often cause losses.
3. Lower Transaction Costs
Swing traders execute fewer trades, resulting in lower commissions and reduced slippage compared to high-frequency trading styles. The source confirms, "swing traders incur fewer fees and slippage, which have less impact due to larger per-trade profits." Over time, these savings enhance overall profitability, especially for smaller accounts.
4. Improved Work–Life Balance
Unlike day trading, which can consume entire days, swing trading allows for a more balanced lifestyle. Traders can maintain full-time jobs, spend time with family, or pursue other interests while still actively participating in the markets. This sustainability makes swing trading a viable long-term approach for many traders.
5. Captures Significant Market Moves
Swing trading aims to capture meaningful price movements. As stated, "while day traders often capture only a segment of a larger move, swing traders attempt to capture entire legs or swings." This approach allows traders to benefit from the core of price trends rather than small fragments.
Disadvantages of Swing Trading
1. Overnight Risk Exposure
Swing traders face overnight and weekend risk, including gap openings from unexpected news during market closures. The original text emphasizes, "the current Coronavirus pandemic highlights the severity of overnight risk on both long and short positions. Swing traders cannot fully mitigate overnight risk, unlike day traders who can close positions quickly." This necessitates additional risk management and may result in losses beyond stop levels.
2. Missing Intraday Opportunities
While day traders capitalize on multiple intraday opportunities, swing traders may miss short-term moves. Market “trend days”characterized by sustained directional moves occur regularly. Swing traders aligned with trends capture sizable gains, whereas day traders exploit multiple intraday setups like scalping and momentum trading. This limitation means missing profitable short-term trades that do not evolve into larger moves.
3. Requires Patience and Discipline
Swing trading demands patience to allow trades to mature over days or weeks, challenging for those used to immediate feedback from day trading. Holding through drawdowns and waiting for targets requires strong emotional discipline.
4. Capital Tied Up Longer
Positions held longer mean capital is committed to fewer trades, reducing capital efficiency. This can limit opportunities, especially for traders with smaller accounts who cannot enter new positions while existing trades are active.
5. Market Environment Dependence
Swing trading strategies perform differently in various market environments. Trend-following approaches work well in trending markets but may generate false signals in choppy, range-bound conditions. Adaptability is essential, as strategies that worked in previous market regimes may underperform in new conditions.
Essential Swing Trading Strategies for Beginners
Bull Flag Pattern
The bull flag is among the most reliable chart patterns for swing trading. As the name suggests, the pattern resembles a flag on a pole on price charts. It represents a brief consolidation within a strong uptrend, providing an entry opportunity before the next upward leg.
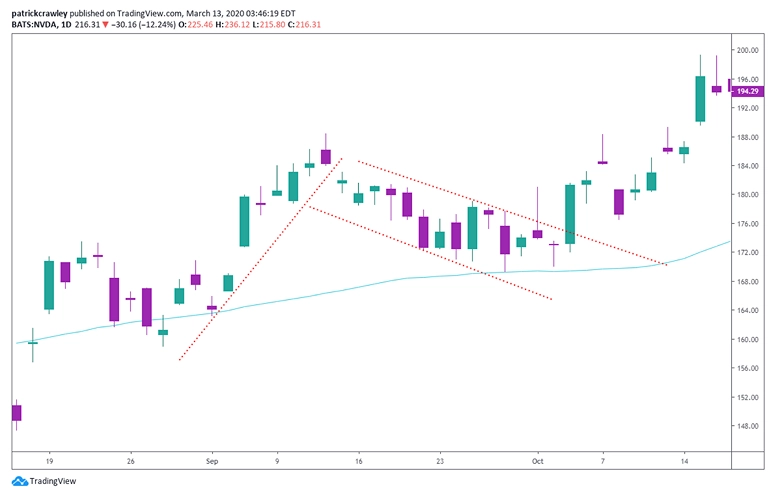
Figure 4: TradingView candlestick chart illustrating a bull flag, a common continuation pattern in swing trading Key Characteristics of Bull Flag Patterns:
Key Characteristics of Swing Trading:
A sharp upward move (flagpole) on high volume, typically a 30-100% price increase
A consolidation phase with a slight downward drift (flag), usually retracing 1/3 to 1/2 of the flagpole
Lower volume during consolidation (ideally 50% or less of the flagpole volume)
A breakout above the flag pattern signaling entry
The pattern typically forms over 1-4 weeks
The source states, "a bull flag is a trend pullback setup named for its flag-like shape. It is a conservative pattern with high continuation odds, typically representing retracements of recent swing highs."
Trading the Bull Flag Pattern:
- Identify the setup: strong upward move followed by consolidation
- Confirm volume pattern: heavy volume on flagpole, lighter on flag
- Entry: breakout above the flag’s upper trendline with increased volume
- Stop loss: below the lowest point of the flag
- Target: project the flagpole length from breakout point
The document emphasizes, "successful bull flags share these traits: sharp impulse move on high volume forming the pole; a moderate pullback less steep than the pole; and a breakout signaling a long entry."
Optimal bull flag setups often occur in:
- Stocks with strong earnings surprises (20%+beats)
- Leading stocks in outperforming sectors (10%+ sector outperformance)
- Market leaders like Apple or Microsoft during bull markets
- Stocks making new 52-week highs
Hundreds of bull flag patterns emerge daily, so focusing on high-probability setups is essential. The most profitable trades combine strong volume and momentum during the initial surge, followed by subdued volume and momentum during the pullback. To refine your strategy, prioritize:
- Stocks with significant earnings beats
- Companies in leading sectors outperforming peers
- Market leaders such as Apple and Microsoft
Support and Resistance Trading Strategies
Support and resistance levels provide excellent entry points for swing traders, especially when trading with the trend. These psychological price levels mark areas where buying or selling pressure previously halted price movements.
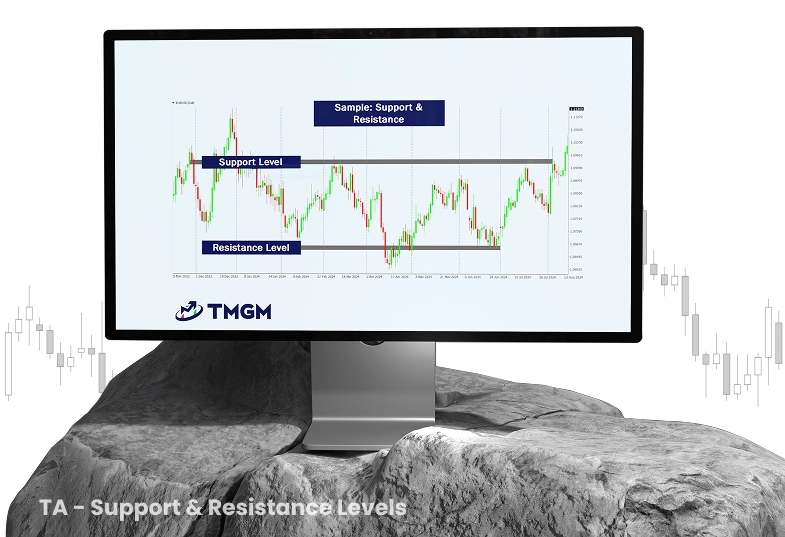 Figure 5: Illustrates support and resistance levels, key concepts in technical analysis that help identify potential entry and exit points
Types of Support and Resistance Levels:
- Horizontal support/resistance: price levels where the market has repeatedly reversed
- Dynamic support/resistance: moving averages acting as floating support or resistance
- Psychological price levels: round numbers (e.g., $50, $100) influencing trading decisions
- Fibonacci retracement levels: mathematically derived retracement points based on prior moves
Effective support/resistance trading requires:
- The stock to be in a clear trend (uptrend for buying at support, downtrend for selling at resistance)
- Well-defined levels with multiple touches
- Volume confirmation (higher volume at bounces
Implementation tips include:
- Focusing on leading stocks in strong sectors
- Looking for higher highs and lows in uptrends
- Monitoring momentum indicators to avoid buying on weakening momentum
- Pacing buy stops above range highs after low-momentum pullbacks
- The more times a level is tested, the stronger it becomes
- Seeking confluence of multiple support/resistance factors at the same price enhances reliability.
Risk management tips:
- Enter trades near support (in uptrends) or resistance (in downtrends)
- Place stop losses beyond these levels allowing for some "wiggle room"
- Take partial profits at the next resistance when buying at support.
Moving Average Crossovers
Moving average crossovers are fundamental swing trading tools that identify shifts in momentum and trend direction by using two or more moving averages of different periods to generate buy and sell signals.
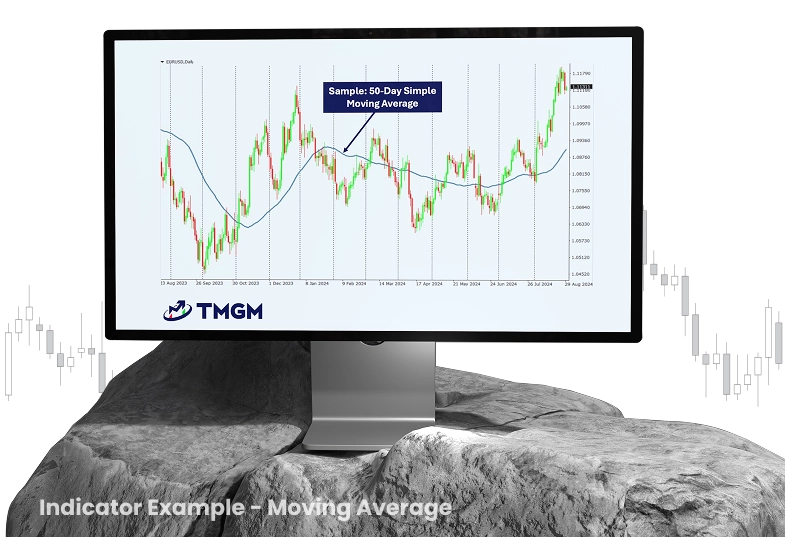
Figure 6: Displays the 50-day Simple Moving Average (SMA), a widely used trend-following indicator
Popular moving average pairs include:
- 10 and 20-day EMAs (fast crossover system)
- 20 and 50-day EMAs (medium-term signals)
- 50 and 200-day SMAs (the well-known "Golden Cross" and "Death Cross")
Trading rules:
- Buy signal: shorter-term MA crosses above longer-term MA
- Sell signal: shorter-term MA crosses below longer-term MA
- Confirmation: volume increases and supportive candlestick patterns.
Advanced techniques involve:
- using three moving averages (e.g., 5, 10, 20-day) for stronger confirmation
- adding a longer-term MA (e.g., 200-day) to identify primary trend direction
- watching for moving average "compression" before breakout moves.
Fibonacci Retracement Levels
Fibonacci Retracement Levels help swing traders identify potential reversal points during price corrections. Key levels include 23.6%, 38.2%, 50%, 61.8%, and 78.6%, often acting as support or resistance.

Figure 7: Illustrates Fibonacci retracement levels for identifying support and resistance zones
Usage steps:
- Identify a significant price move (swing low to swing high in uptrends)
- Draw Fibonacci retracement from start to end of the move
- Observe price reactions at key retracement levels
- Enter trades when price bounces off retracement levels in the trend direction
Best practices:
- focusing on 38.2% and 61.8% levels
- seeking confluence with other indicators (moving averages, trendlines)
- confirming reversals with candlestick patterns
- combining with momentum indicators to assess retracement strength.
Breakout Trading Strategy
Breakout trading involves entering positions when price breaks significant support or resistance, leveraging momentum that follows. This is effective in volatile markets where consolidations precede strong directional moves.
Key breakout patterns include:
- Rectangle patterns: price ranges horizontally before breakout
- Triangle patterns: ascending, descending, symmetrical triangles indicating potential breakouts aligned with trend
- Head and Shoulders: bearish reversal pattern signaling downward breakout
- Cup and Handle: bullish continuation pattern often leading to upside breakout
Breakout trading approach:
- Identify clear consolidation pattern and breakout level
- Monitor volume for confirmation; rising volume supports momentum
- Enter trade upon confirmed breakout with conviction
- Place stop-loss orders below breakout level (for longs) to limit risk
- Set profit targets at next resistance or by measuring previous price range
Avoiding false breakouts:
- Wait for price to close beyond breakout level
- Confirm with above-average volume strenght
- Use the 2% rule: price should move at least 2% beyond breakout before entry
- Trade with the overall trend, avoiding counter-trend breakouts
Combining technical confirmation with sound risk management improves breakout trading success and reduces common errors.
Risk Management for Swing Traders
Effective risk management is vital for long-term swing trading success. Even the best strategies incur losses; protecting capital during drawdowns distinguishes successful traders from those who deplete accounts.
Position Sizing Strategy
Position sizing controls capital allocation per trade and is a cornerstone of risk management.
Key approaches:
- Fixed-percentage risk models: risk a fixed portion (typically 1-2%) of total capital per trade
- Volatility-based sizing: adjust position size inversely with instrument volatility (smaller positions for higher volatility)
- Tiered sizing: allocate varying percentages based on conviction level (e.g., 0.5% for moderate, 1% for high conviction)
Example:With a $10,000 account risking 1% per trade:
Maximum risk per trade = $100
If stop loss is $0.50 away from entry, buy 200 shares ($100 ÷ $0.50)
Adjust position sizes as account equity changes.
Stop Loss Placement
Stop losses protect capital by automatically exiting losing trades beyond predetermined thresholds.
Effective stop loss placement includes:
- Technical stops: below support (longs) or above resistance (shorts)
- Volatility-based stops: using ATR (e.g., 2 × ATR below entry)
- Time-based stops: exit trades not performing within a set timeframe
Best practices:
- Set stops at trade entry to enforce discipline and avoid emotional decisions
- Avoid obvious stop levels vulnerable to stop hunts; place stops slightly beyond
- Use mental stops in highly volatile markets to avoid premature exits, requiring strong discipline
- Never move stops further away; only tighten to lock in profits
Adhering to these practices maintains structured risk control while adapting to market conditions. conditions.
Profit Target Techniques
Predetermined profit targets help maintain discipline and avoid emotional management of winning trades.
- Methods include: exit at key resistance (longs) or support (shorts)
- Risk-reward ratio: set targets at 2:1 or 3:1 reward-to-risk distance
- Trailing stops: lock in profits while allowing winners to run (e.g., 2 × ATR trailing stop)
- Partial profit-taking: scale out of positions at multiple levels
Technical Indicators for Swing Trading
While price action forms the analysis foundation, technical indicators provide valuable supplementary insights for swing trading decisions.
Volume Indicators
Volume confirms price moves and helps assess trend and reversal strength.
Key volume indicators:
- Volume bars: basic trading activity representation
- On-Balance Volume (OBV): cumulative volume indicator adding or subtracting volume based on price direction
- Volume Profile: volume distribution across price levels
- Chaikin Money Flow: measures buying/selling pressure over timeVolume usage:
How to Use Volume:
Volume is a key technical indicator that provides insights into the strength and sustainability of price movements. Understanding volume trends can help traders confirm breakouts, identify potential reversals, and anticipate trend shifts.
- Confirm breakouts with increasing volume indicating strong participation
- Avoid low-volume breakouts prone to failure
- Recognize volume spikes signaling potential exhaustion and reversals
- Detect price-volume divergences indicating weakening trends
Incorporating volume analysis enhances decision-making and reduces false signals.
Momentum Oscillators
Momentum oscillators identify overbought/oversold conditions, potential reversals, and trend strength.
Key momentum indicators:
- Relative Strength Index (RSI): measures price movement speed and change on a 0-100 scale
- Stochastic Oscillator: compares closing price to price range over a period
- MACD (Moving Average Convergence Divergence): identifies trend direction, momentum, and entry points
- Rate of Change (ROC): measures percentage price change over time
Applications:
- Look for divergences between price and momentum (e.g., price new high with lower RSI)
- Use oversold (RSI <30) for buying in uptrends
- overbought (RSI >70) for shorting in downtrends
- Confirm trend changes with MACD crossovers
Trend Following Indicators
Trend-following indicators identify market trend direction and strength.
Popular indicators:
- Moving Averages (SMA, EMA): average price over periods
- ADX (Average Directional Index): measures trend strength regardless of direction
- Parabolic SAR: identifies potential price reversals
- Ichimoku Cloud: comprehensive indicator showing support/resistance, trend, and momentum
Implementation:
- Use 20 and 50-day EMAs to identify medium-term trends
- Consider ADX above 25 as strong trend signal
- Watch price relative to key moving averages
- Use Ichimoku Cloud for multiple confirmations
Creating Your Swing Trading Plan
A structured swing trading plan ensures consistency and reduces emotional decisions. It should define market selection, timeframes, entry/exit rules, position sizing, and trading hours. Traders choose instruments, chart timeframes, and specific trade criteria.
Example:
A trader might focus on S&P 500 stocks with market caps over $10 billion, using daily charts for trend identification and 4-hour charts for entry timing. The strategy could involve buying pullbacks to the 20-day EMA in strong uptrends, applying a 2:1 reward-to-risk ratio or trailing stops at twice ATR.
Position sizing aligns with risk management, such as risking 1% per trade. A routine including weekend watchlist reviews and daily setup analysis promotes preparedness and discipline.
Backtesting Your Strategy
Backtesting tests strategies on historical data before live trading, assessing effectiveness, identifying weaknesses, and refining approaches.
Process: define rules, gather data, simulate trades, and track metrics like win rate, profit factor, max drawdown, and Sharpe ratio. Avoid overfitting to ensure realistic live performance.Backtesting builds confidence, improves risk management, and enhances decision-making.
Maintaining a Swing Trading Journal
A trading journal tracks performance and supports continuous improvement, similar to practices in our guide on cryptocurrency trading.
What to Record in Your Swing Trading Journal
Journal entries should include trade details (entry/exit prices, size), market conditions, setup rationale, screenshots, and emotional notes. Reviewing successes and errors helps identify behavioral patterns and refine decision-making.
Regular review processes:
weekly trade reviews, monthly performance assessments, and quarterly strategy updates—enhance learning and discipline, boosting long-term profitability.
Getting Started with Swing Trading at TMGM
Free Swing Trading Courses & Resources
TMGM offers free swing trading courses and webinars to develop your skills. A free demo account with US$100,000 virtual funds allows risk-free practice and strategy refinement.
TMGM also provides TMGM Market News & Analysis and proprietary tools like Acuity and an Economic Calendar, suitable for traders at all levels.


