





What Is Hammer Candlestick Pattern
A hammer candlestick pattern is a reversal candlestick pattern in technical analysis that usually appears after a sustained decline. It signals that price moved sharply lower during the session, but buyers absorbed the selling pressure and pushed the close back near the top of the candle. This pattern is heavily used by price action traders to detect early signs of trend reversals, often paired together with a few other confluences which will be discussed later in this article.
The hammer candle is one of the most widely used single-candle patterns in technical analysis, and price action traders read it as an early signal of a probable trend reversal. A bullish hammer forms after a downtrend and points to a bullish reversal. The same hammer pattern after an uptrend is read as a bearish hammer candlestick, which traders normally call a hanging man. So the hammer chart pattern is not locked to one direction — the trend it forms in decides what it means.
This pattern is called a hammer candlestick because of its shape. The long lower wick looks like the handle, while the small body near the top looks like the head. In practical terms, it shows that the market tested lower prices and rejected them before the candle closed.
The pattern becomes more meaningful when it appears after a clear downtrend, near a support zone, or after an extended selloff. On its own, it is an early clue. With confirmation, it can become a trade setup.
Note
The hammer candlestick is used across forex, gold, crypto, oil, and shares because it reflects price behavior rather than a market specific rule, although it works best in liquid conditions.
Components of Hammer Candlestick Pattern
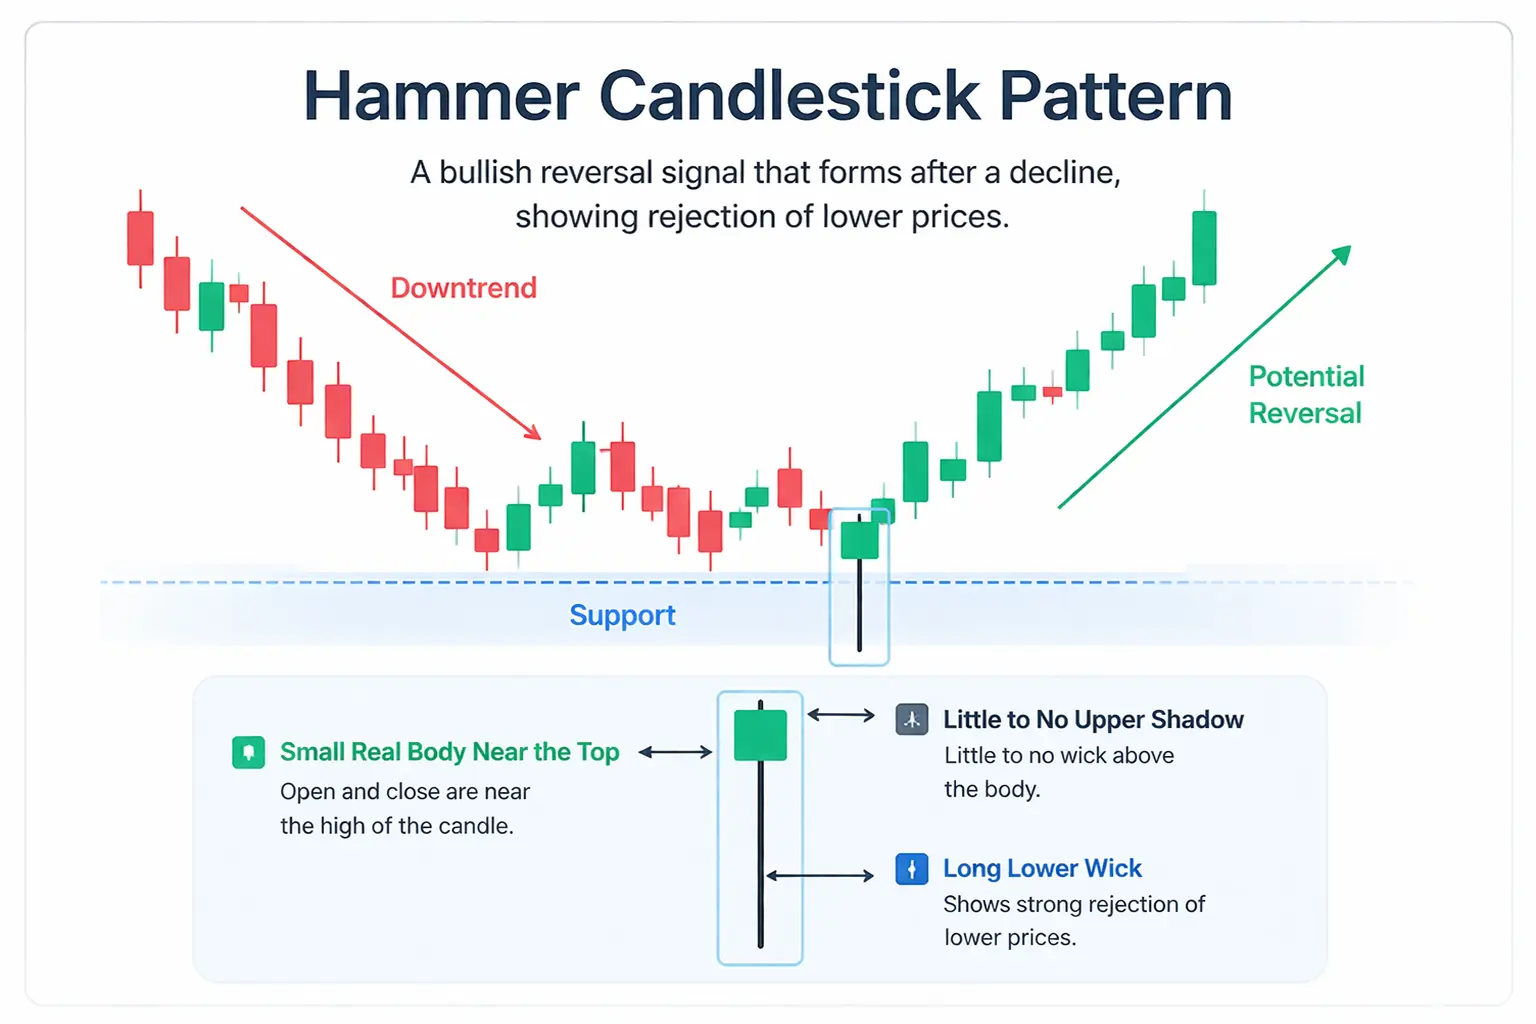
The hammer candlestick pattern is built from a small number of visual components:
Small real body near the top
The open and close sit close together near the upper part of the candle.Long lower wick
The lower shadow should run at least twice the length of the real body, and most traders treat two to three times as the working benchmark. On the strongest hammers, the wick can extend three to five times the body. A longer shadow means buyers reversed price from a deeper intraday low, so shadow length is a direct read on how much demand entered the candle.Little to no upper shadow
A clean hammer usually has very little wick above the body.Appears after a decline
The pattern has more value when it forms after sustained selling pressure.Needs confirmation
The candle shape alone is not enough. Confirmation has a specific meaning here: the next candle must close above the high of the hammer. A candle that trades above the hammer intraday but closes back inside it has not confirmed anything.
Pro Tip: Measure the wick against the body before anything else — a lower shadow under two times the real body is a small-bodied candle, not a hammer.
Body color matters less than structure. A green candle may look stronger, but the shape and the trend context matter more than color alone.
Hammer Candlestick Price Action Explained
The price action behind the hammer candlestick is simple. Sellers control the session early and push prices sharply lower. Then buyers step in, absorb the selling pressure, and force the market back toward the opening level before the candle closes.
That is why the long lower wick matters. It shows that the market tried to continue lower and failed. This failed downside move is often the first sign that bearish momentum is fading.
For traders, the important message is not just the wick itself. It is what the wick represents: rejection, absorption, and a possible shift in control. The hammer does not confirm a reversal by itself, but it shows that the prior move is no longer as one sided as before.
Trading Significance of Hammer Candlestick
The hammer candlestick pattern is important because it can highlight a possible turning point after a decline. It becomes more useful when it forms near support or after extended selling pressure.
Traders who practice technical analysis especially value it because it creates a clear invalidation level at the wick low and a clear confirmation idea through the next candle. On its own, it is a warning. With context and confirmation, it can become a practical reversal setup.
Types of Hammer Candlestick and Main Variations
The main types of hammer candlestick are the classic hammer candlestick and the inverted hammer candlestick pattern. Both are bullish and both appear after a decline.
Their bearish mirrors are the hanging man candlestick and the shooting star. These share the same two shapes, but form after an uptrend instead of a downtrend. This is the part most traders get wrong: the four patterns are two shapes read in two trend contexts, and the name changes with the context, not with the candle.
Classic hammer candlestick
This is the standard bullish version. It appears after a downtrend and has a small body near the top with a long lower wick. It suggests rejection of lower prices and possible reversal strength.
Inverted hammer candlestick

The inverted hammer candlestick also appears after a downtrend, but its shape is different. It has a small body near the lower part of the candle and a long upper wick. This shows that buyers were able to push price higher during the session, even if the close faded back.
The inverted hammer candlestick pattern is still treated as a bullish reversal warning, but it needs confirmation because the candle itself does not prove that buyers fully took control.
Some traders use the term reverse hammer candlestick for the same formation. In most trading usage, reverse hammer candlestick and inverted hammer candlestick refer to the same pattern.
Bearish Hammer Candlestick Patterns: The Hanging Man and Shooting Star Candlesticks

When traders say bearish hammer candlestick, they are almost always describing one of these two patterns. Neither is a separate shape — each is a hammer type that has formed after a rally rather than after a decline, which inverts what it implies.
Hanging Man Candlestick
The hanging man candlestick has a shape similar to the classic hammer, but it appears after an uptrend. Because of that context, traders interpret it as a bearish warning rather than a bullish reversal setup.
The rejection inside the candle still shows buyers absorbing a sell-off — but after an extended rally, that intraday breakdown is evidence that supply is now reaching the market. Confirmation runs the other way: traders want the next candle to close below the hanging man's low.
Shooting Star Candlestick
The shooting star is the inverted hammer's bearish mirror. It carries a small real body near the low of the candle and a long upper wick, and it forms after an uptrend. Buyers pushed price higher during the session and could not hold the level, so the close faded back toward the open.
If you can read the inverted hammer, you can read the shooting start candle since the shape is identical and only the preceding trend is flipped.
Important: A hammer that has not been confirmed by a close above its high is an observation, not a setup — trading it early is trading the wick alone.
How to Trade Hammer Candlestick Pattern
The hammer candlestick pattern is best used as a trend reversal signal, not as a standalone entry trigger. Its role is to show that the existing trend may be losing control and that price is starting to reverse against the prior trend.
In a bullish hammer candlestick setup, it forms after a clear decline, signaling a reversal into a bullish trend. The strategy is to look for it near support, a prior swing low, or an area where price has already reacted before. In that context, the long lower wick suggests that sellers pushed price down but failed to hold it there. This can be an early sign that bearish momentum is fading.
In a bearish setup, traders apply the same reversal logic to the hanging man candlestick after an uptrend. The candle shape may look similar, but the meaning changes because it appears after a rally. In this case, the rejection inside the candle can warn that buyers are losing control.
Two positional filters raise the quality of a hammer setup. The first is the strength of the move into it — a hammer that forms after three or more consecutive bearish candles, or after a steep decline, carries far more weight than one that appears after a shallow drift lower. The second is where the wick lands: a hammer that prints into a tested support level, a prior swing low, or a rising trendline is reacting to something structural.
Confirmation is the third filter and the non-negotiable one. The candle after the hammer must close above the hammer's high. That close is what turns a rejection wick into a signal you can size a position against.
The main idea is simple. A hammer based setup works best when it appears at the end of a directional move, forms at an important level, and is followed by confirmation from the next candle. Without that context, the pattern is just a candle shape. With the right context, it becomes a trend reversal signal that traders can build a strategy around.
Is Hammer Candlestick Bullish or Bearish?
A hammer candlestick is not automatically bullish or bearish just because of its shape. Context decides the meaning.
Bullish hammer candlestick
A bullish hammer candlestick usually forms after a downtrend. It suggests that sellers drove price lower, but buyers stepped in strongly enough to recover most of the drop before the close. If the next candle confirms the move higher, the setup can signal a bullish reversal.
Bearish hammer candlestick
A bearish hammer candlestick usually refers to the same basic shape when it appears after an uptrend. In that context, traders more often call it a hanging man candlestick. The shape is similar, but the message changes because it forms after a rally rather than after a decline.
Red hammer candlestick and green hammer candlestick
A red hammer candlestick does not automatically make the setup bearish. It can still be valid if it forms after a decline and the next candle confirms bullish follow through.
A green hammer candlestick often looks stronger because the close finishes above the open, but it is still not enough on its own. Traders should avoid judging the pattern by color alone.
Hammer candlestick in a pullback: continuation, not reversal
Most content treats the hammer as a reversal candle and stops there. That is incomplete. When a hammer forms during a pullback inside an established uptrend — at a rising trendline, a prior swing high turned support, or a major moving average — it is not signalling a reversal at all. It is signalling that the pullback is over and the existing trend is resuming.
The mechanics are identical: sellers push price into the level, buyers absorb the move, price closes near the session high. What changes is the trade. A reversal hammer bets against the prior move; a continuation hammer bets with it, which is why continuation setups often carry the better risk-to-reward profile.
The distinction is entirely positional. Same shape, same psychology, opposite structural context — so the first question is never "is this a hammer," it is "where in the trend did this hammer form."
In short, the hammer is not bullish or bearish by shape. Its meaning is set by where it appears in the trend, whether it forms at a level that matters, and whether the next candle confirms the move..
Trading Hammer Candlestick Pattern Setup with Real Examples
XAUUSD Bullish Reversal example
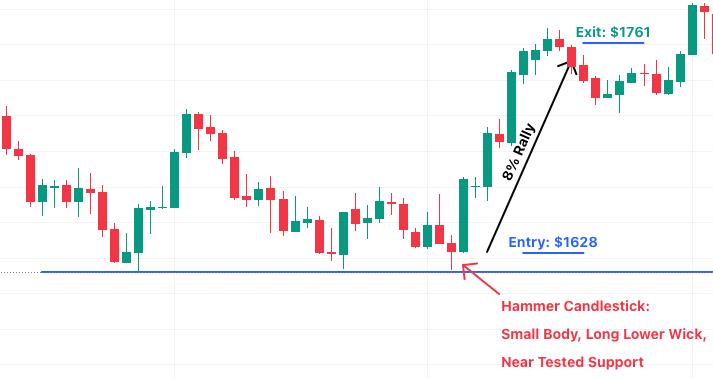
This example shows how a hammer candlestick can support a bullish reversal after a decline.
Identify:
A classic hammer candlestick forms after a downtrend and appears near a tested support level. The candle has a small real body near the top and a long lower wick, showing that sellers pushed price sharply lower but buyers stepped in and drove the close back up. The next bullish candle then helps confirm that reversal pressure is building.
Entry:
A common entry is above the high of the hammer or after the next bullish candle confirms the move higher. A more conservative approach is to wait for a small pullback or retest after confirmation.
Stop loss:
Stop loss is usually placed below the low of the hammer wick, because a break below that level weakens the bullish reversal idea.
Take profit:
Take profit can be set at the next resistance zone or based on a minimum 2:1 risk to reward ratio. In stronger moves, traders may also scale out at the first target and leave part of the position open for further upside.
XAUUSD Bullish Reversal example
This example shows the same candle working as a continuation signal rather than a reversal.
Identify:
GBPUSD is trending higher on the 4-hour chart, holding above a rising trendline that has already been tested twice. Price pulls back into that trendline and prints a hammer: small body near the top, long lower wick that pierces slightly into the line but closes back above it. The wick shows sellers driving price into the level and failing to close it below.
Entry:
The trendline holding is the structural confirmation; the candle confirmation is the next 4-hour candle closing above the hammer's high. Entry is on that close. There is no reversal to wait for here — the trend was already up, and the hammer is signalling that the pullback has ended.
Stop loss:
Below the hammer's wick low, which also sits below the trendline. A close beneath the trendline invalidates both the candle and the trend structure at once, which is what makes trendline continuation setups efficient — one level does two jobs.
Take profit:
The prior swing high is the first logical target. Traders holding for a trend extension often trail the stop under each subsequent higher low and exit on a close below the trendline instead of at a fixed level.
The lesson is that the hammer did not need to reverse anything to be tradeable. It needed to form at a level that mattered, and it needed a close above its high.
What Confirms a Hammer Candlestick Signal?
Confirmation for a hammer starts with one thing: the next candle closing above the hammer's high. Everything else in this section raises or lowers the odds around that close — none of it replaces it.
Volume. A hammer candle that forms on higher than average volume, indicates that real buying/selling pressure has participated in the rejection. A hammer that forms on thin volume should be considered noise. In decentralised markets like forex, tick volume on your platform is practically considered as the volume.
Level confluence. A hammer candle carries much more weight when the wick tested a support level and went back up to form a small body. Other support strength indicating confluences include a key moving average such as the 50 or 200 period.
Retracement levels. A hammer forming at a well-established fibonacci retracement level inside an existing trend gives you strong confluence as well.
How Reliable Is the Hammer Candlestick Pattern?
The hammer is moderately reliable on its own and considerably more reliable in context. Treating it as a standalone entry trigger is the single most common way traders lose money with it. Below are the conditions that break the pattern.
It has an explicit failure rule. A hammer fails when the next candle makes a new low below the hammer's wick. The opposite applies to the bearish hanging man as well, where it fails when the next candle makes a new high.
The preceding move sets the ceiling. A hammer after a steep, sustained decline is a meaningful rejection. A hammer after a shallow drift lower is close to meaningless, because there was no real selling pressure to absorb in the first place.
Timeframe scales significance. A hammer on a daily or weekly chart represents a full day or week session of participants rejecting a price, which carries the most weight. A hammer on a one-minute chart may represent a few orders, hence carries no weight. Since the shape is identical on every timeframe, the context behind it is highlyaffected by timeframe alone.
Thin liquidity & Gap Risk distorts the candle itself. Around session rollovers, holidays, and the minutes surrounding high-impact news, spreads widen and quotes gap. A wick printed in those conditions may be a spread artifact rather than a genuine trend reversal. This is a specific risk on low-timeframe charts around the New York close and during the Asian session on non-JPY pairs, and it is why execution quality and raw spread conditions materially affect how much you can trust a candle's extremes.
FAQ
Is a hammer candlestick always bullish?
No. A hammer candlestick is often bullish after a downtrend, but the same shape after an uptrend is usually treated as a hanging man candlestick, which has bearish implications.
Is reverse hammer candlestick different from inverted hammer candlestick?
In most trading usage, reverse hammer candlestick and inverted hammer candlestick refer to the same candle structure. The standard textbook term is usually inverted hammer candlestick.
What is the difference between a hammer candlestick and a doji?
A doji has a very small real body with the open and close nearly identical, and it can appear anywhere on a chart — it signals indecision with no directional bias. A hammer has a clearly defined body near the top of the candle and a long lower wick, and it only carries meaning relative to the trend it forms in.




















