Introduction
Price action is the study of raw price movement on a chart without relying on lagging technical indicators. Traders who practice technical analysis use it to read market structure, mark support and resistance, and judge whether buyers or sellers control the next move.
What Is Price Action Trading?
Price action trading is a method of reading the market through price data behaviour itself. Traders will focus on candles, swing highs and lows, support, resistance, breakouts, and rejection instead of building decisions around derived indicators.
This school of practice gained popularity mainly because price is the base input behind every indicator, therefore reading price data directly removes one layer of delay and keeps analysis focused without additional noise.
Important
Price action works across all liquid markets, including stocks, forex, futures, and cryptocurrencies, because recurring trading psychology produces similar price behaviour across asset classes.
How to Read Price Action in Trading?
Every candlestick shows four values: open, high, low, and close. The body shows where price opened and closed, while the wicks show where price moved but failed to hold.
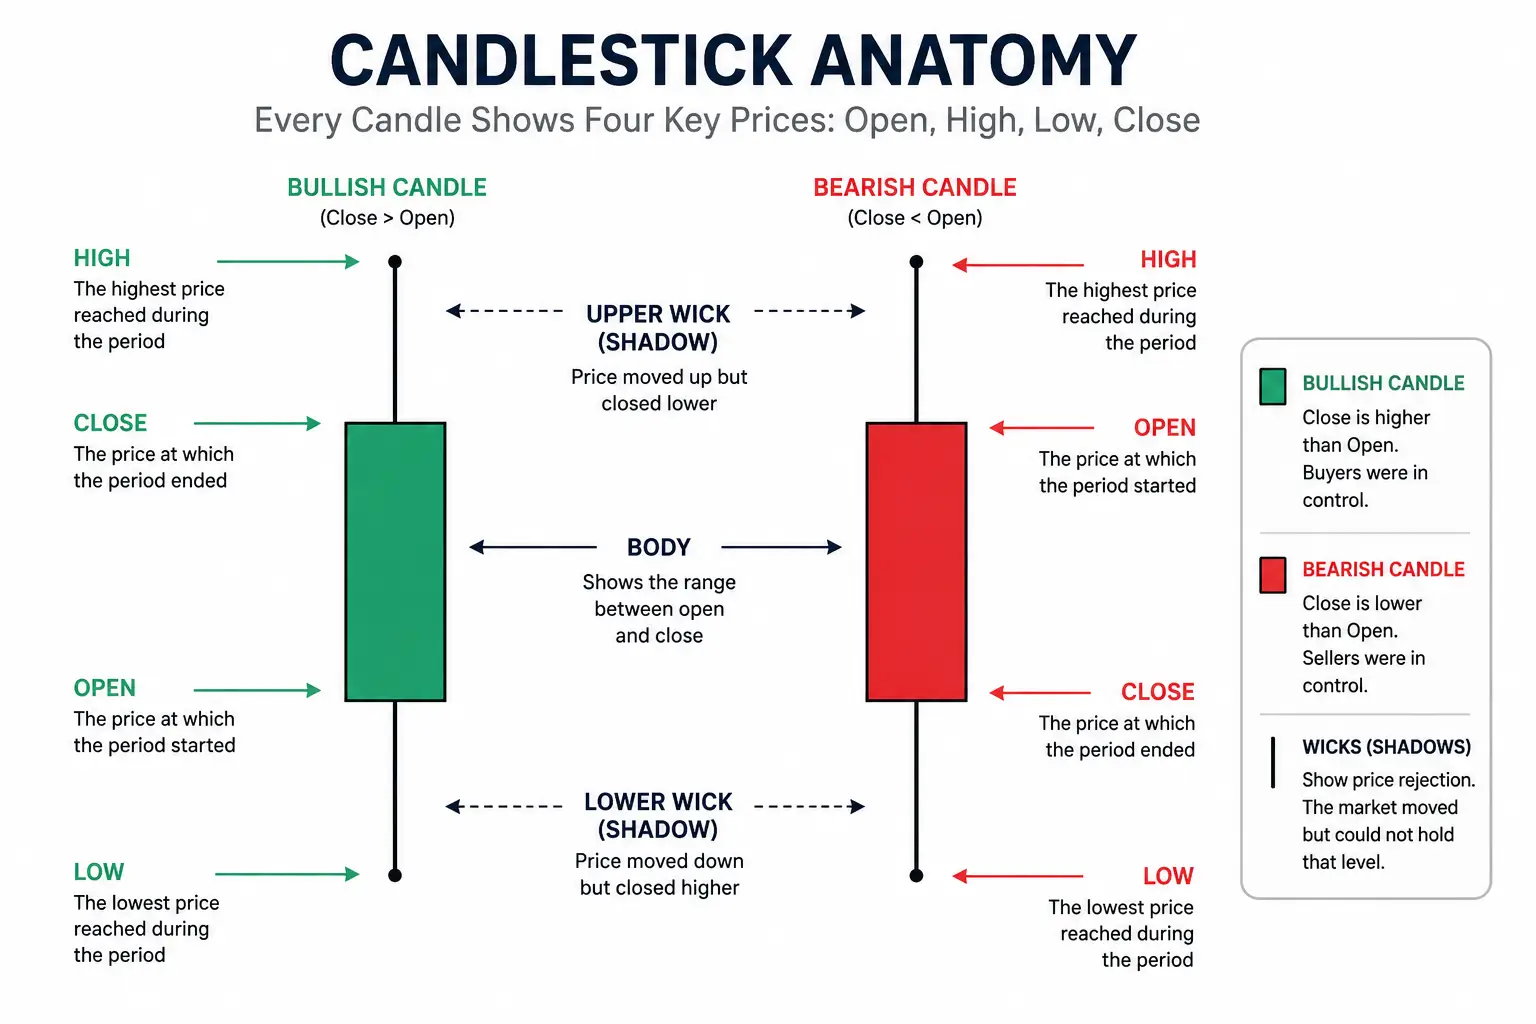
Reading multiple candles together reveals candlestick patterns and chart patterns that tell a story about buyer and seller behavior. Large bodies show aggressive buying, while long wicks show price rejection, and small candles often show hesitation or balance in opposing forces.
Understanding Timeframes and Market Structure in Price Action Trading
Market structure is the bias or story that is derived from price action analysis, where traders read the sequence of swing highs and swing lows or the lack thereof, to determine if the market is in an uptrend, downtrend or sideways.
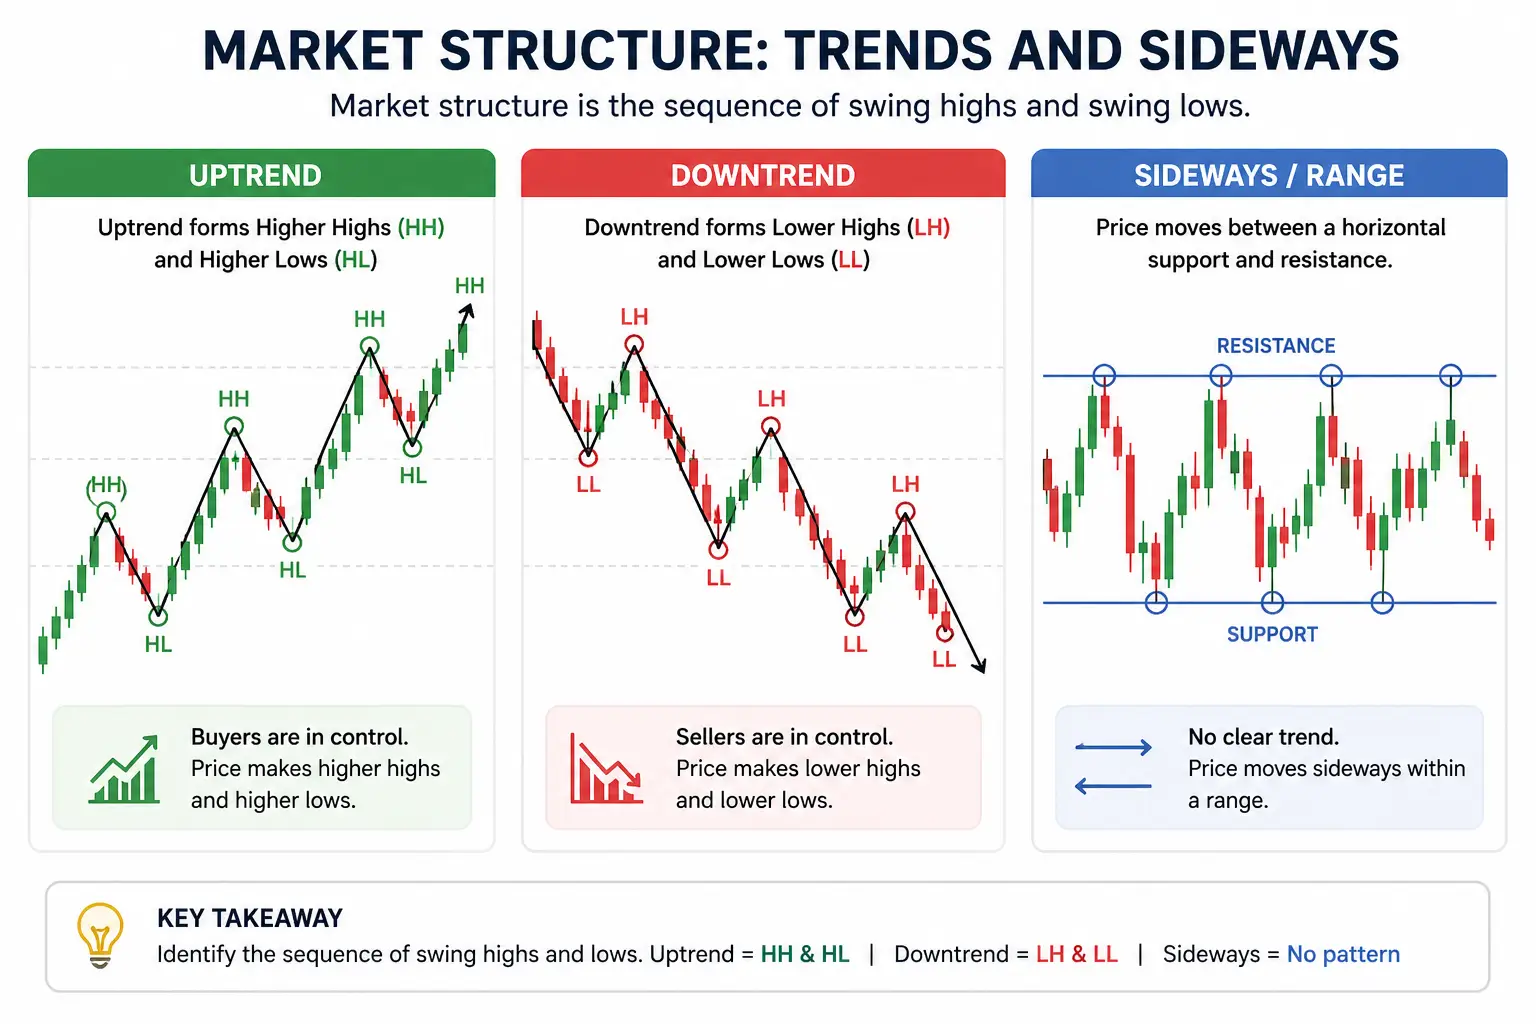
An uptrend forms higher highs and higher lows. A downtrend forms lower highs and lower lows.
Sideways markets occur when prices oscillate within a range without forming higher or lower swing points hence not in an obvious trend.
Multi-Timeframe Analysis in Price Action Trading
Mult-timeframe analysis begins with understanding the math logic.
One daily candle contains six 4 hour candles and twenty four 1 hour candles. In crypto, one weekly candle contains seven daily candles.
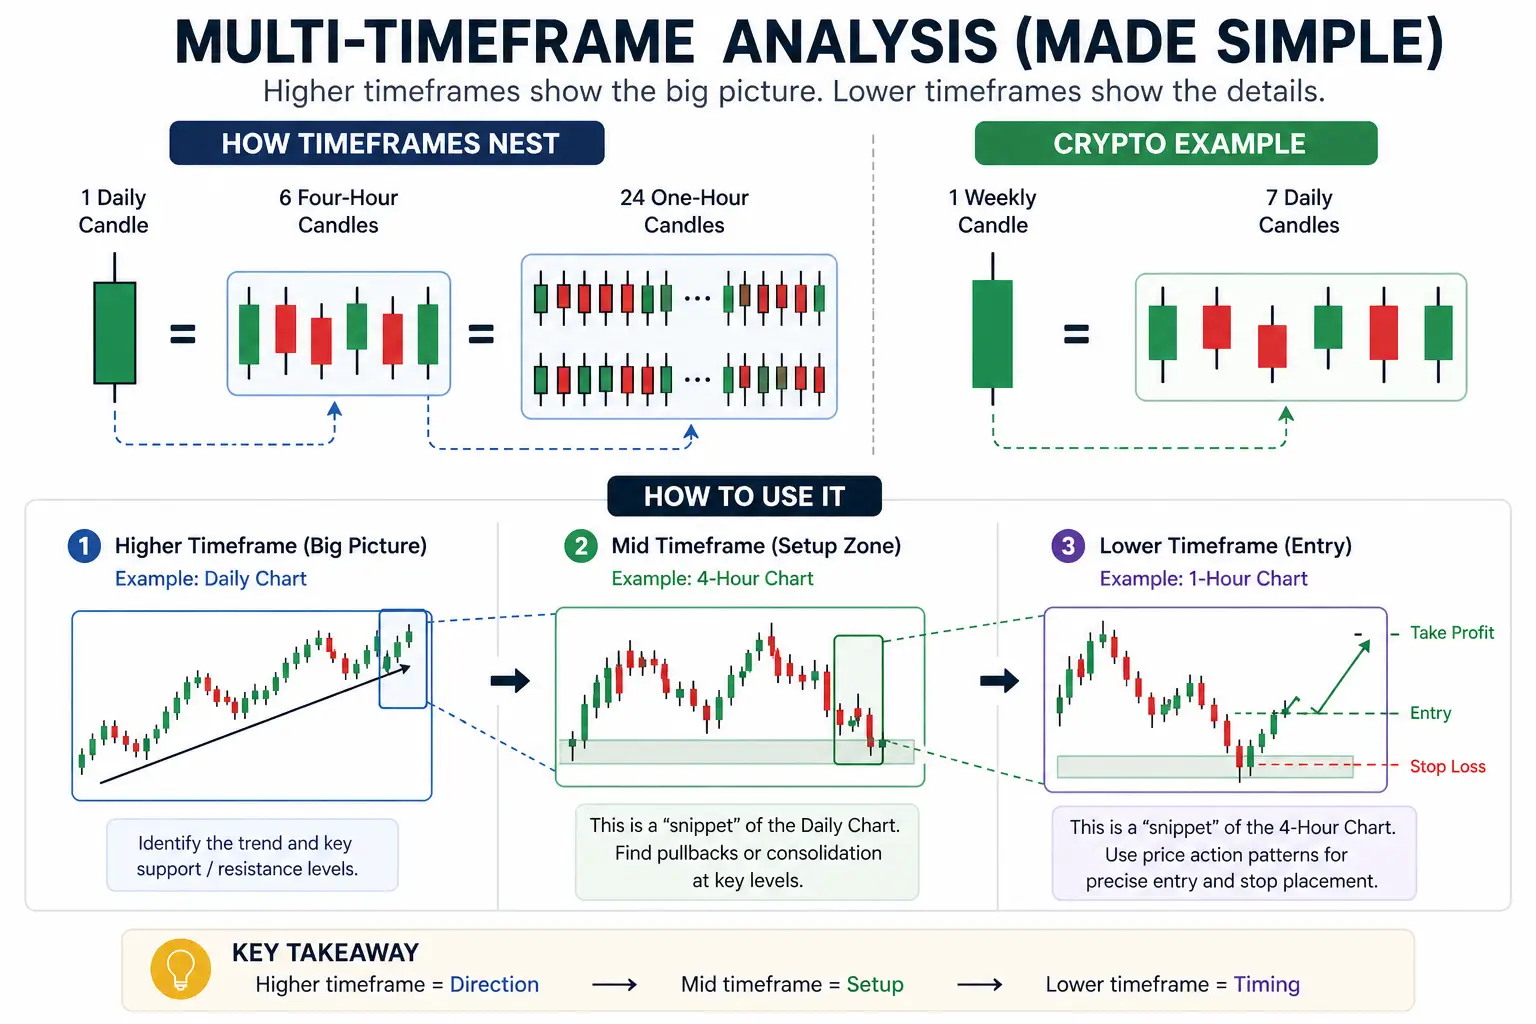
That allows lower timeframe trends, pullbacks, and patterns to form and complete inside a single higher timeframe candle. Several smaller cycles of accumulation and distribution can finish without changing the larger weekly structure.
The higher timeframe sets the broader directional context when a clear bias exists. The lower timeframe shows how price is moving inside that larger wave.
A seasoned trader reads both together. The higher timeframe defines trend and structure. The lower timeframe helps with timing, entry, and invalidation.
Psychology Behind Price Action Analysis
Price action reflects mass psychology cycles between fear and greed. Uptrends end when greed peaks and no new buyers join the trend while downtrends end when fear exhausts sellers. Reversal patterns capture this emotional extreme.
Large candles often reflect strong emotions —panic selling or FOMO buying. A shift from small to large candles signals growing conviction while a shift from large to small candles after an extended move suggests exhaustion.
How Do Traders use Support and Resistance in Price Action?
Support is an area where buying has repeatedly interrupted selling. Resistance is an area where selling has repeatedly interrupted buying.
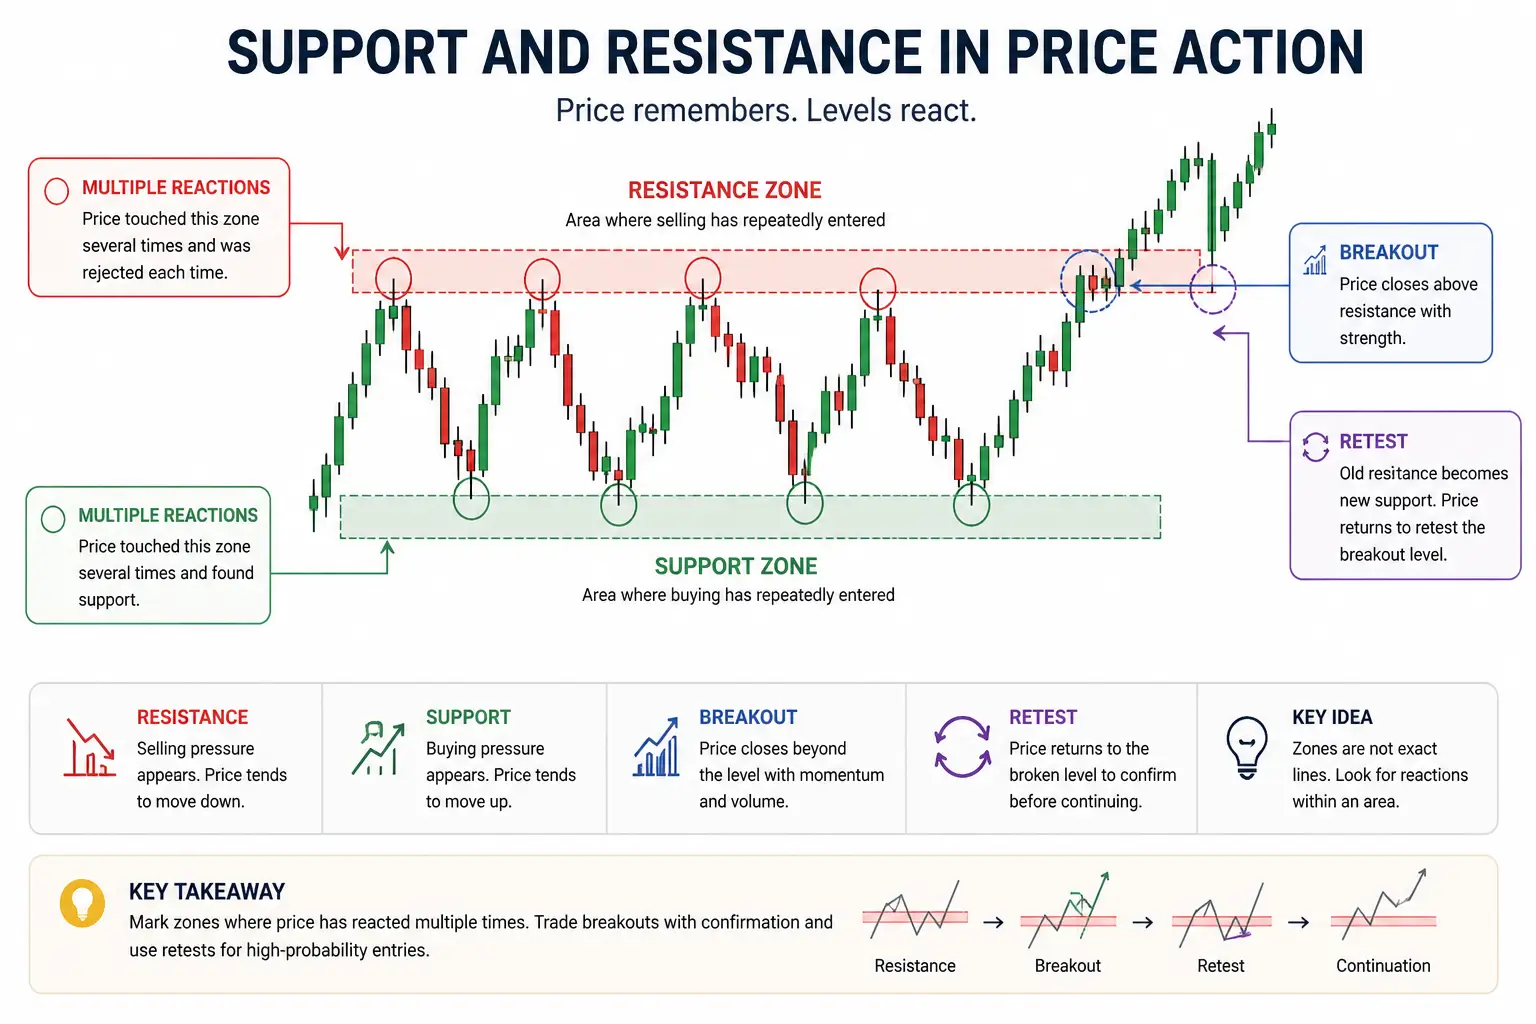
Support and resistance levels exist because traders remember past prices. Round numbers attract orders due to psychological bias. Previous swing highs become resistance because trapped buyers wait to exit at breakeven while old swing lows become new supports because prices have become cheap enough to re-enter, or traders decided to re-enter on retest.
Price action traders then use these levels to help them forecast the potential movement of prices in the future.
How to Trade with Price Action Strategy?
A price action trading strategy starts with context. Traders first mark trend, support, resistance, recent swing points, and nearby barriers. Only after that do they decide whether a pattern is worth trading.
Pro Tip
The strongest price action setups show confluence — a clear level, a clear pattern, and sufficient room to the next barrier, all aligning at once.
Entry and Exit Techniques
The entry level is usually picked at a level after confirmation, like closing beyond an important support/resistance level.
Proper stop placement is typically beyond the pattern's invalidation point. For bullish pin bars, you can place a stop below the pinbar’s wick low. For engulfing patterns, stop below both candles' lows. It is often wise to add a buffer of a few pips beyond the technical level to avoid ‘stop hunting’, which is when institutions purposefully drive prices to reach obvious stop levels to buy up supplies.
Target levels come from recent swing points. In uptrends, exit at the prior swing high. Extend targets in strong trends showing no exhaustion signs. Use trailing stops to capture extended moves—move the stop to breakeven after a 1:1 risk-reward move, then trail below each new swing low.
Risk-Reward Ratio should meet minimum 1:2 for single-target trades. If risking $100 to the stop, target at least $200 profit. Higher timeframes support larger risk-reward ratios—daily chart trades often achieve 1:3 or 1:4 while low timeframes (5-minute, 15-minute) struggle beyond 1:2.
Position sizing adapts to stop distance. Wider stops require smaller position size to maintain constant dollar risk. A $100 risk trade with a 20-pip stop uses larger size than a 50-pip stop trade. Most traders risk 1-2% of account capital per trade regardless of stop distance.
Reversal patterns include pin bars, engulfing candles, double tops, double bottoms, and head and shoulders. A pin bar is a single candle with a long wick and small body that shows price rejected a level within that same candle — the longer the wick relative to the body, the stronger the rejection. A double top or double bottom forms when price tests the same high or low twice without breaking through, while a head and shoulders pattern shows three swing highs — a taller middle peak flanked by two lower ones — that warns of a reversal once the neckline breaks.
Example: EUR/USD is in an uptrend and pulls back to a swing-low support that has already held twice. A bullish pin bar forms at that level, its long lower wick showing rejection of lower prices. A trader enters on the candle's close, places a stop a few pips below the pin bar's wick low, and targets the most recent swing high — roughly a 1:2.5 risk-reward. Price reclaims that high within three sessions; the stop is trailed to breakeven after the first 1:1 move, and the trade closes at target. The setup worked because the three elements from the Pro Tip above lined up: a respected level, a clear pattern, and enough room before the next barrier.
Best Timeframe for Price Action Trading
Price action works on all timeframes from 1-minute to monthly charts. The method's principles remain constant across scales. Pattern formation, support/resistance respect, and trend structure appear identically on daily and 5-minute charts.
Day traders use 5-minute to 1-hour charts for entries, checking 4-hour and daily for trend context. Shorter timeframes generate more signals but also more noise. 5-minute charts produce many setup opportunities daily in active markets, which also breed more false signals.
Swing traders focus on 4-hour, daily and weekly charts, holding positions from multiple days to weeks, sometimes, even months. Expecting one or two quality daily setups per week per market is very normal.
Scalpers operate on 1-minute to 15-minute charts, capturing small moves multiple times daily. This requires intense focus, strict discipline or bots for high frequency trading. Scalping suits high-liquid markets like forex majors or index futures where bid-ask spreads remain very tight.
Price Action vs. Indicator-Based Trading
Price action traders read raw candles, swing points, support, resistance, and market structure. Indicator based traders use tools derived from price, such as moving averages, RSI, or MACD, to interpret direction or momentum.
The main difference is timing. Price action shows what the market is doing now, while indicators summarize what price has already done. That makes indicators useful for confirmation, but slower to react than price itself.
Pure price action keeps the chart clean and reduces signal conflict. Traders can focus on rejection, breakout behavior, and trend structure instead of balancing mixed readings from multiple tools.
Indicators still have value when they serve a clear purpose. A moving average can be used as a dynamic support/resistance level if the asset is in the price discovery zone, while volume can help confirm a breakout. In practice, price should lead the analysis, while indicators should support it rather than replace it.
Modern pattern-recognition tools can support this process alongside manual reading of price. TMGM's AI Arena and Market Buzz, for example, scan multiple markets for developing setups and shifting sentiment, though the judgment described above — weighing the level, the pattern, and room to the next barrier — still decides whether a signal is worth acting on.
Price Action Charts and Trading Patterns
Most price action trading patterns fall into three groups: reversal, continuation, and breakout.
Reversal Patterns
Reversal candlestick patterns include pin bars, engulfing candles, and reversal chart patterns include double tops, double bottoms, and head and shoulders. A pin bar is a single candle with a long wick and small body that shows price rejected a level within that same candle — the longer the wick relative to the body, the stronger the rejection. A double top or double bottom forms when price tests the same high or low twice without breaking through, while a head and shoulders pattern shows three swing highs — a taller middle peak flanked by two lower ones — that warns of a reversal once the neckline breaks.
Continuation Patterns
Continuation candlestick patterns are patterns like inside bars, whereas continuation chart patterns include ascending triangle, flags, and pennants. An inside bar sits entirely within the prior candle's high-low range, showing a pause before the trend resumes, while flags and pennants form as tight consolidations after a sharp move — rectangular for flags, triangular for pennants. They appear most when price pauses inside an existing trend and then resumes that trend.
Breakout Patterns
Breakout patterns happen when price closes through a boundary like major support/resistance or a channel and continues the trend beyond it.
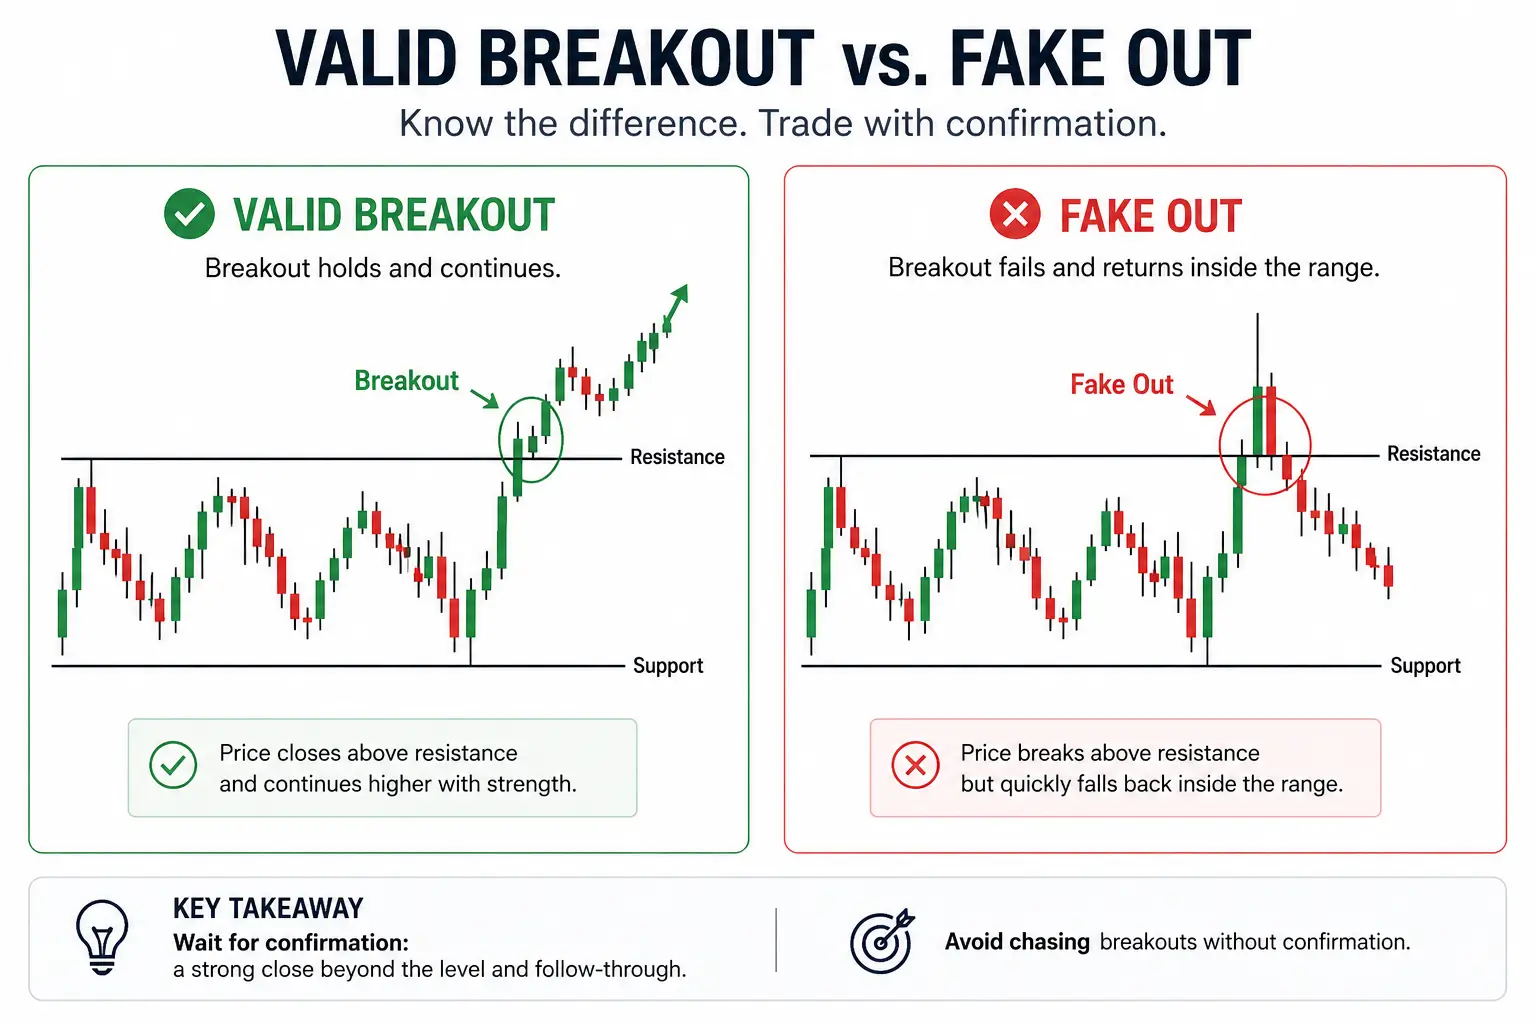
A ‘fake out’, or fake breakout is when a breakout breaks a trendline and quickly falls back into the range, which usually happens with institutional supply sweep.
What Are the Benefits and Limitations of Price Action Trading?
The main benefit of price action is that it is direct. It works across liquid markets, keeps charts clean, and helps traders focus on structure, rejection, and momentum instead of waiting for lagging signals.
The main limitation is subjectivity. Two traders can draw different levels, read the same pattern differently, or force trades in choppy conditions. Price action also demands screen time, patience, and discipline because not every visible pattern is tradeable.
What is Price Action in Trading Frequently Asked Questions
What is Price Action in Trading?
Price action in trading is the study of raw price movement on a chart (candles, swing highs and lows, support, resistance, and chart pattern) without relying on technical indicators to judge direction, rejection, and breakout behavior.
What is the difference between price action and technical analysis?
Price action is a part of technical analysis. It focuses on raw price movement, while technical analysis also includes indicators, oscillators, and other chart tools.
How long does it take to learn price action trading?
Most traders can grasp the core concepts within a few weeks of focused chart study, but consistent execution — reading levels correctly and trading patterns with discipline — usually takes several months of demo practice before real capital should be involved.
Can price action trading be automated?
Partially. Price action depends on trader judgment to weigh context, confluence, and market structure, which is hard to fully automate, though elements like pattern scanning and alerts can be — with the final trade decision usually still left to the trader.
Which Is Better, Price Action Trading or Indicator Based Trading?
Neither is always better. Price action trading is more direct because it reads price itself, while indicator based trading can help confirm trend or momentum. Many traders use price action as the main framework and add a small number of indicators only for confirmation.