


Key Takeaways
- Scalpers capitalize on numerous small intraday price fluctuations to accumulate incremental profits, requiring rapid execution, disciplined strategies, and an understanding that transaction costs and slippage can quickly negate gains.
- Scalping involves holding positions for minutes or less to “recover the spread plus a modest profit,” with profitability scaling alongside trade frequency and size, though risk and costs increase proportionally.
- Common entry techniques include Stochastic crossovers, SMA/EMA crossovers, RSI extremes, and support– and resistance bounces, implemented with predefined stop-losses and conservative leverage to limit downside exposure.
- Partnering with a regulated broker offering MT4/MT5 platforms, tight spreads, deep liquidity, and low-latency execution (e.g., NY4 data center routing) enables scalpers to consistently apply strategies and safely practice via demo accounts.
1. Market making style scalping
In this method, you place both buy and sell orders around the current price and attempt to capture the spread in between.
Example
You quote both sides on a very liquid NSE stock:
Place a buy limit slightly below the current price
Place a sell limit slightly above the current price
If both fill, you pocket the difference before brokerage and charges.
This requires:
Extremely tight spreads
High confidence in your execution speed and risk control
Awareness that institutions and HFT firms dominate true market making
2. Large position scalping
Here you take meaningful size in a liquid instrument and exit after a small favourable move.
Example
You buy several lots of NIFTY futures after a breakout with a three to five point target and a tight stop. Because your stop is small, you need to be very accurate and strict with exits.
This approach relies on:
Strong liquidity in NIFTY or BANK NIFTY
Quick reaction to any sign of failure
Strict daily loss and max position size rules
3. Signal based scalping
Signal based scalping is the most common style for Indian retail traders. You:
Watch for specific patterns such as breakouts, pullbacks to VWAP, or quick RSI flips.
Enter as soon as your conditions are met.
Exit either at a predefined target or when the opposite signal appears.
Example
On a three minute BANK NIFTY chart, price pulls back to VWAP and prints a bullish engulfing candle after an uptrend. You buy with a tight stop below the candle low, targeting a short continuation move of 20 to 40 points.
Recommended image: BANK NIFTY three minute chart annotated with a VWAP pullback scalping entry, stop and target.
Alt text: “BANK NIFTY scalping setup using VWAP pullback and candlestick confirmation.”
Best Scalping Strategy for Beginners Trading CFDs
The ideal scalping strategy depends on the specific financial markets you trade, the technical analysis tools and price action patterns you select, as well as your risk appetite. To guide your decision, let’s review some effective scalping strategies.
Scalping Trading Strategy: The Stochastic Oscillator
The Stochastic Oscillator technique utilizes the stochastic indicator, available on MT4 for forex trading. This indicator is a short-term momentum oscillator (similar to the Moving Average Convergence Divergence (MACD)), calculated based on the closing prices over a prior period.
The indicator consists of two lines: — the faster, more responsive %K line and the slightly slower, smoother %D line. Scalpers focus on the interaction between these lines, as each reflects market momentum over slightly different timeframes.
As an oscillator, its values range between 0 and 100. It is commonly used to identify “oversold” conditions (below 30) and “overbought” conditions (above 70). However, scalpers apply the oscillator differently.
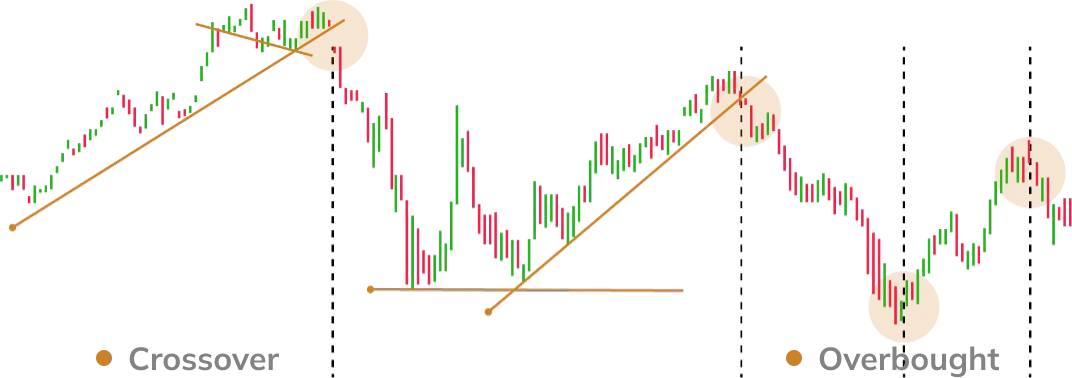
A scalping trader maintains the position until the lines cross in the opposite direction and stabilize, signaling a new trade opportunity. A long position is entered when the fast line crosses above the slow line and held until the fast line crosses below the slow line. Conversely, a short position is initiated when the fast line crosses below the slow line and closed when it crosses back above.
Simple Moving Averages: A Potential Best Scalping Strategy
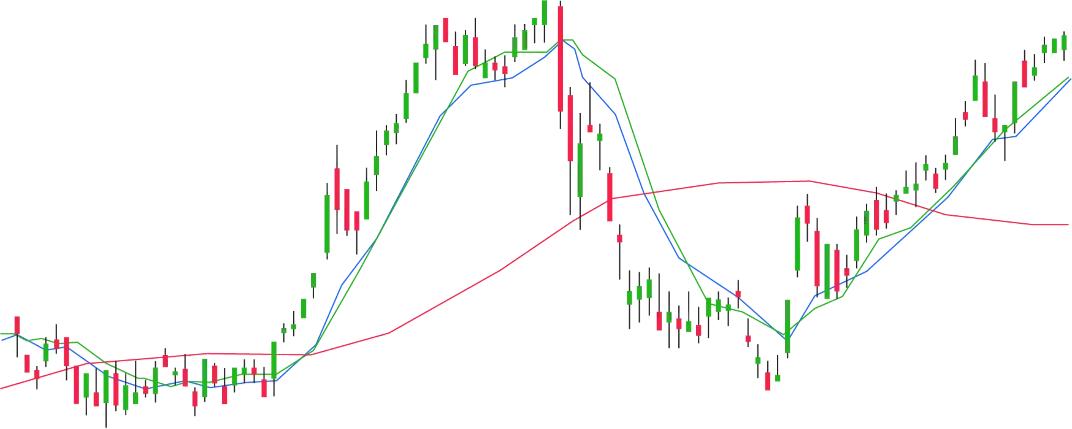
Many scalpers, including some swing traders, utilize Simple Moving Averages (SMAs) to gauge market momentum by averaging prices over a set number of periods (e.g., a 5-period SMA, which equates roughly to one trading week for stock traders since markets are closed on weekends). Traders often use two or three SMAs, such as a short-term average over five periods and a longer-term average over 10 or 20 periods.
A bullish signal occurs when the short-term SMA crosses above the longer-term SMA, prompting scalpers to enter long positions for quick gains. Conversely, when the longer-term SMA crosses below the short-term SMA, traders may consider short positions to capitalize on downward price movements.
You may choose between SMAs or Exponential Moving Averages (EMAs), which assign greater weight to recent price data. EMAs are more sensitive and often preferred by scalpers for earlier market entry signals.
Relative Strength Index (RSI) in CFD Scalping Trading
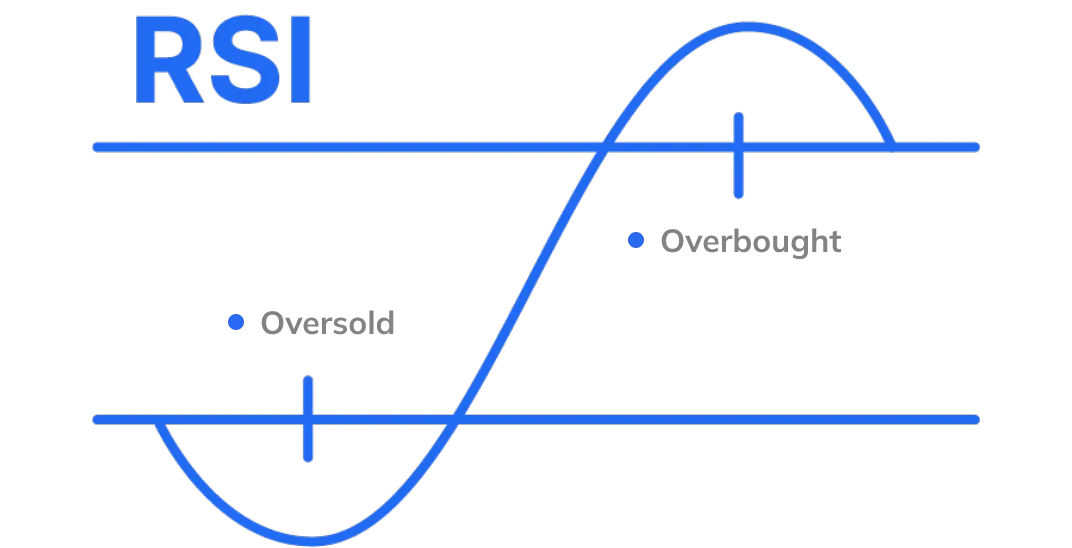
The Relative Strength Index (RSI) is another momentum indicator measuring market supply and demand. Like the Stochastic Oscillator, it operates on a 0-100 scale. Many traders find the RSI easier to interpret due to its smoother line. The market is considered overbought when the RSI exceeds 70 and oversold when it falls below 30.
Similar to the stochastic approach, scalpers exit trades once the RSI reaches the opposite extreme.
Support and Resistance Levels in Scalping Trading
Scalping strategies also incorporate key support and resistance levels where price reversals often occur. Scalpers plot these levels on charts and combine them with indicator signals or candlestick patterns when price approaches these zones.
TMGM - Specialists in Scalping Trading for Beginners
Before starting scalping, traders should conduct thorough research to select a regulated, reputable broker offering advanced tools. At TMGM, we provide access to MetaTrader 4 and MetaTrader 5, delivering the charting capabilities and rapid execution essential for scalping strategies.
We also connect to over 10 liquidity providers and utilize NY4 data centers to ensure ultra-low latency trade execution.
If you are interested in scalping trading, visit TMGM to open an account today.


