What is RSI in Trading? The Relative Strength Index
What is RSI full form and what is rsi in stock market? RSI means The Relative Strength Index (RSI), it is a widely utilized technical indicator in the category of momentum oscillator that quantifies the velocity and magnitude of price movements. It was developed by J. Welles Wilder Jr. and introduced in his 1978 book, New Concepts in Technical Trading Systems with the aim of using RSI in Stock Market. It remains one of the most widely used indicators in technical analysis today. It calculates the ratio of recent average gains to average losses over a defined period, typically 14 bars, this is what ‘RSI 14’ means if a trader talks about it. RSI indicator is especially popular in the share market because it is a straightforward yet powerful indicator that enables stock traders who practice technical analysis, to detect overbought and oversold market conditions, potential trend reversals, and confirm trend strength.
How is RSI Calculated using a Formula?
RSI Formula & RSI Calculation:
The RSI Indicator formula is very simple & straightforward
*Where RS means Relative Strength.
The first calculation gives the initial RSI. After the first 14 periods, most platforms apply a second, smoothing step so the RSI only approaches 0 or 100 in a strongly trending market:
RSI = 100 − [100 / (1 + ((Previous Average Gain × 13 + Current Gain) / (Previous Average Loss × 13 + Current Loss)))]
You never have to calculate this by hand — your platform does it automatically — but knowing there are two stages explains why the RSI reacts smoothly rather than jumping on a single large candle.
What do RSI Readings and RSI Ranges Mean?
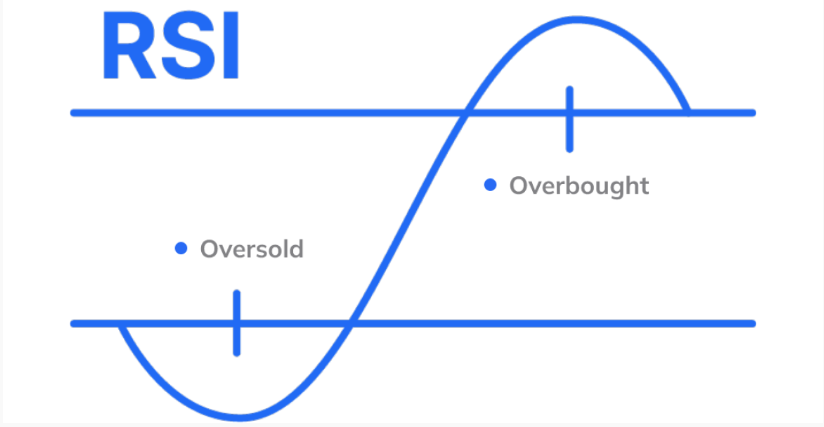
So now we know that, the Relative Strength Index formula yields a value ranging from 0 to 100. So what do RSI Indicator Readings mean? Here's a straightforward answer for you:
RSI Reading Above 70:
- Signals the asset may be overbought and could be poised for a corrective pullback.
RSI Reading Below 30:
Indicates the asset may be oversold, suggesting a potential upward price correction.
RSI Reading Between 30–and 70:
Represents a neutral zone where traders often seek additional confirmation before making decisions.
Example: If a stock’s RSI surpasses 70, it may be deemed overbought, increasing the probability of a price decline. Conversely, an RSI below 30 could indicate oversold conditions and a potential rebound.
Worked RSI Calculation Example
Suppose that over the last 14 days a stock closed higher on 7 days with an average gain of 1%, and lower on 7 days with an average loss of 0.8%. Plugging these into the formula:
RSI = 100 − [100 / (1 + ((1% / 14) / (0.8% / 14)))] = 55.55
An RSI of 55.55 sits in the neutral 30–70 band, leaning slightly bullish because average gains modestly outweighed average losses over the period.
Key Takeaways (RSI Indicator)
The RSI is a momentum oscillator that indicates when assets are overbought or oversold.
It assists in identifying trend reversals, trend strength, and optimal entry and exit points.
Best applied alongside technical tools such as moving averages, Fibonacci retracement levels, MACD, and trendlines.
Traders should always consider the overall market context and implement sound risk management practices.
RSI performs effectively across forex, equities, and commodities, making it a versatile indicator for all types of traders.
How to use RSI Indicator to Identify Trends
The RSI does not move through its whole 0–100 scale evenly — it settles into a range that depends on the trend:
In an uptrend (bullish range), the RSI level typically stays between 40 and 90, with the 40–50 zone acting as support on pullbacks and dips below 30 being rare.
In a downtrend (bearish range), the RSI level typically stays between 10 and 60, with the 50–60 zone acting as resistance and moves above 70 being rare.
Reading the RSI levels against its expected RSI range — rather than a fixed 70/30 line — is what separates a beginner from a trader who understands market context.
RSI level | What it signals |
|---|---|
0–30 | Oversold — potential bounce / undervalued |
30–50 | Lower neutral; 40–50 is uptrend support |
50 | Momentum centreline — above is bullish, below is bearish |
50–70 | Upper neutral; 50–60 is downtrend resistance |
70–100 | Overbought — potential pullback / overvalued |
RSI is valuable not only for timing entries and exits but also for confirming trend strength.
In Uptrends: RSI generally remains above 50, supporting bullish momentum.
In Downtrends: RSI typically stays below 50, indicating bearish momentum. As a simple signal framework, a move back above 30 from oversold can be read as a potential buy signal and a move back below 70 from overbought as a potential sell signal — strongest when they align with the prevailing trend rather than fighting it.
Example: During a sustained EUR/USD rally, if RSI holds above 50, it reinforces the rationale for maintaining long positions.
What Are RSI Divergence and Convergence?
Bullish and Bearish RSI Divergence
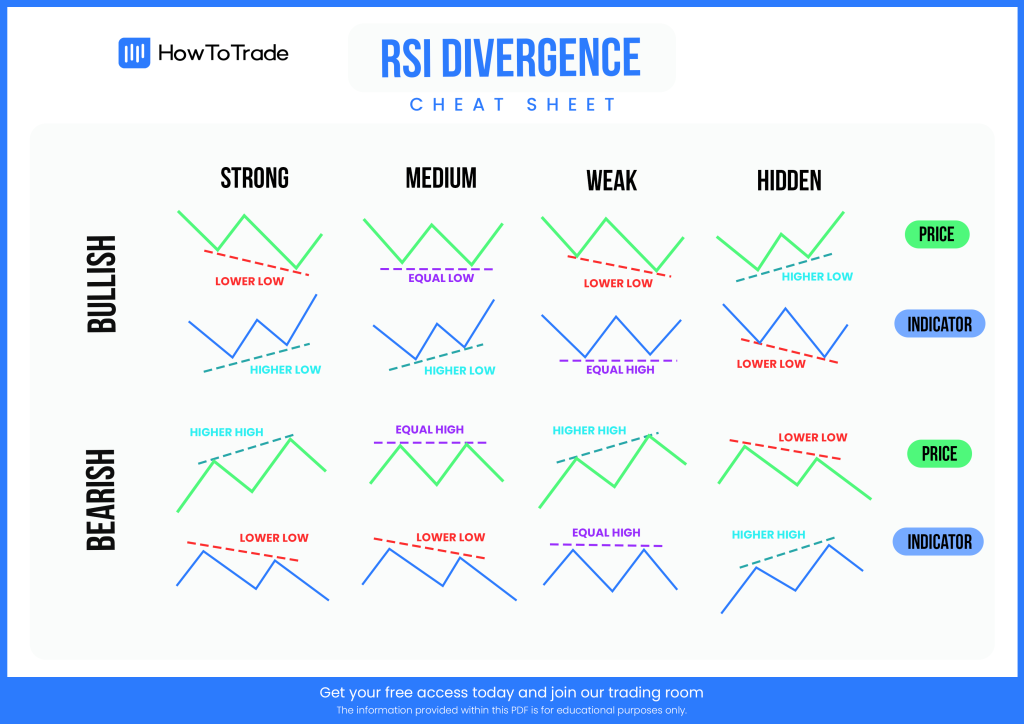
Divergences between price action and RSI can signal weakening trends or imminent reversals.
Bearish Divergence: Price forms higher highs while RSI forms lower highs, warning of diminishing momentum and a possible sell-off.
Bullish Divergence: Price makes lower lows while RSI makes higher lows, suggesting that bearish momentum is waning and a reversal may be near.
Example: If GBP/USD sets a new low but RSI does not, traders might anticipate a bullish reversal setup.
RSI Convergence
Convergence is the opposite situation to divergence where price and the RSI move in agreement, both confirming the same direction. The term is used most often near the end of a downtrend, when the RSI stops making new lows alongside price and the two begin to turn up together — an early hint that selling pressure is fading and a reversal higher may be forming. Because convergence often appears before the price reversal is obvious, traders treat it as an early signal, but like every RSI reading it needs confirmation from price action or another indicator before acting on it.
In short: divergence warns that a trend is weakening (price and RSI disagree); convergence suggests a trend is being confirmed or is about to reverse in the RSI's direction (price and RSI agree).
Positive and Negative RSI Reversals
RSI reversals are the mirror image of divergences and are easy to confuse with them. A positive RSI reversal forms when the RSI makes a lower low while price makes a higher low — read as a bullish sign and a potential buy signal. A negative RSI reversal forms when the RSI makes a higher high while price makes a lower high — a bearish sign and a potential sell signal. The distinction from divergence is which side lags: in a divergence the indicator lags the price, while in a reversal the price lags the indicator.
RSI Swing Rejections
A swing rejection is a signal that watches how the RSI behaves as it leaves overbought or oversold territory, rather than the crossing itself. A bullish swing rejection has four parts: the RSI drops into oversold territory (below 30); it crosses back above 30; it forms a second dip that stays above 30; and it then breaks above its most recent high. The bearish version is the mirror: the RSI rises into overbought territory (above 70), crosses back below 70, forms a lower high that stays below 70, then breaks below its recent low. Like all RSI techniques, swing rejections are most reliable when they align with the prevailing trend.
What Are the Best RSI Settings?
The default RSI setting is 14 periods, which balances responsiveness and noise hence it suits swing and position trading styles better. There is no single "best" setting — it depends on your style:
- 5–9 periods: more sensitive and faster-reacting, favoured by day traders capturing quick momentum shifts, at the cost of more false signals.
- 14 periods: the standard, well-suited to swing and position trading.
- 21–30 periods: smoother and slower, favoured by longer-term traders tracking major trends.
On shorter intraday timeframes (5-minute or 15-minute charts), many traders keep the 14-period setting but read the RSI against the shorter chart's structure.
RSI vs MACD: What's the Difference?
The RSI and the MACD (Moving Average Convergence Divergence) are both momentum indicators, but they measure different things and are strongest when used together. The RSI measures the speed and size of recent price changes on a fixed 0–100 scale, and is built to flag overbought and oversold conditions. The MACD measures the relationship between two moving averages — it subtracts the 26-period EMA from the 12-period EMA to form the MACD line, then plots a 9-period EMA of that line as a signal line; crossovers between the two generate buy and sell signals.
In practice: reach for the RSI to judge whether a move is overextended and due for a pullback, and for the MACD to confirm the direction and momentum of the broader trend through its crossovers. Because they measure different factors, they can sometimes disagree — the RSI may read overbought while the MACD still shows building momentum — and that disagreement is itself useful information.
Advantages of using RSI Indicator in Trading
The RSI indicator is effective across various asset classes like forex, shares and commodity:
Forex Trading:
Forex trading experiences continuous price fluctuations, RSI helps identify when currency pairs are overbought (above 70) or oversold (below 30).
Equity Trading:
RSI helps stock traders observe stocks that are overextended or undervalued based on recent price action.
An RSI consistently above 70 may indicate overbought conditions, while below 30 could signal undervaluation and potential buying opportunities.
Commodity Trading:
Commodities such as gold, oil, and silver exhibit strong cyclical patterns. RSI helps identify potential cycle shifts.
Example: An RSI above 70 during a gold rally may signal an opportune moment to take profits.
Combining the RSI Indicator with Other Indicators
How to integrate RSI with other indicators?
RSI’s effectiveness increases when used in conjunction with complementary technical tools.
RSI + Moving Averages: An overbought RSI signal near a 200-day moving average resistance can reinforce the case for initiating a short position.
RSI + Fibonacci Retracement: An oversold RSI at the 61.8% Fibonacci Retracement level may indicate a high-probability buying opportunity.
RSI + Trendlines: Confirm RSI signals with bounces or breaks of clearly defined trendlines.
RSI + Bollinger Bands: Identify volatility expansions or contractions alongside RSI levels.
RSI + MACD: Use RSI to gauge momentum strength and MACD (Moving Average Convergence Divergence) for crossover confirmations.
Common RSI Indicator Mistakes to Avoid
Overreliance on RSI:
Traders who depend solely on RSI risk false signals. RSI should be integrated into a comprehensive strategy that includes trend analysis, support and resistance levels, and volume confirmation.
Limitations & mistakes:
In strong trending markets, RSI can remain in overbought or oversold zones for extended durations. Context is crucial — don't automatically sell just because RSI exceeds 70 during a bullish trend. The RSI is most reliable in ranging or oscillating markets and least reliable in strong trends, where signals are often false. Some traders address this by adjusting the levels — raising overbought to 80 in a strong uptrend, for example — so the threshold reflects the prevailing trend. Remember too that the RSI is a lagging indicator built from past price data, so it confirms momentum rather than predicting it.
Chart Patterns and Support/Resistance on the RSI:
The RSI line itself can form the same chart patterns you look for on price — double tops, double bottoms, and trendlines — and these sometimes appear on the RSI before they show up on the price chart. You can also draw support and resistance directly on the RSI. A break of an RSI trendline or a double top on the RSI can give an earlier warning than waiting for price to confirm.
Poor Risk Management:
RSI signals are not certainties. Always employ stop-loss orders and appropriate position sizing. For example: RSI overbought combined with a short position should include a stop-loss above recent highs.
RSI Indicator Across Different Markets: Forex, Shares, and Commodities
The RSI’’s adaptability makes it suitable for diverse markets beyond forex. Here’’s how it can be effectively applied in equity and commodity trading:
Equity Trading:
Use RSI to identify exhaustion during earnings-driven rallies or panic selling.
Divergences during earnings seasons can provide early signals of trend reversals.
Commodity Trading:
RSI assists in navigating sharp commodity price swings driven by supply disruptions or geopolitical events.
Example: RSI divergence during an oil price spike may indicate a speculative top
The Relative Strength Index (RSI) is an indispensable tool for traders. It provides a clear, straightforward method to evaluate market momentum and anticipate potential price reversals. Due to its simplicity and effectiveness across multiple markets, including forex, equities, and commodities, it is especially beneficial for novice traders.
Applying the RSI Indicator on TMGM’s Platform
Trading with TMGM, a leading global CFD provider, offers numerous advantages, particularly for beginner traders seeking to utilize technical indicators like the Relative Strength Index (RSI). TMGM’’s platform is designed for ease of use, delivering a seamless trading experience across forex, equities, and commodities.
Here’s how TMGM enhances RSI-based trading:
Customize RSI Periods: Adjust the RSI timeframe to suit scalping strategies or extend it for swing trading—TMGM enables you to tailor settings to your trading style.
Overlay with Other Indicators: Combine RSI with moving averages, Bollinger Bands, or MACD using TMGM’’s advanced charting capabilities.
Real-Time RSI Monitoring: Respond swiftly to overbought or oversold signals thanks to TMGM’’s low-latency infrastructure and rapid order execution.
Learn as You Trade: TMGM provides tutorials, webinars, and articles to help you master RSI and integrate it into a comprehensive technical strategy.
Educational Resources:
New traders can access step-by-step tutorials, webinars, and live trading examples to learn how to interpret RSI signals and combine them effectively with other technical indicators.
Optimized for Beginners
TMGM’’s platform is designed to accommodate traders of all experience levels, with particular benefits for beginners. The platform’s intuitive interface and extensive educational materials make it an excellent choice for those new to trading. By leveraging RSI on TMGM, beginners can build a strong foundation in technical analysis within a supportive and efficient trading environment.
Ready to start trading on a platform that offers powerful tools like RSI and much more? Visit TMGM today to explore their platform and elevate your trading. Whether you’re just beginning or aiming to refine your strategy, TMGM provides the tools and support necessary to succeed in the markets.