


Key Takeaways:
- The MACD is a trend-following momentum indicator designed to assist in timing trade entries and exits, as well as identifying potential reversals across day trading, swing trading, and spot trading by analyzing the relationship between two EMAs and their signal line.
- It consists of the MACD line (the difference between the fast EMA and slow EMA), a 9-period signal EMA, and a histogram that visualizes the difference between these two lines to highlight momentum shifts.
- By default, the MACD line is calculated using 12- and 26-period EMAs, the signal line is a 9-period EMA, and the histogram equals the MACD minus the signal line, illustrating the balance between speed and smoothing.
- Bullish and bearish crossovers, along with positive and negative divergences, indicate potential momentum shifts, while expansions or contractions in the histogram reflect the strength of the move.
- Sustained readings above or below the zero line and consecutive bullish or bearish crossovers help confirm trend direction, with rising histogram bars signaling acceleration and falling bars indicating weakening momentum.
- Combine MACD with moving average crossovers, RSI extremes, volume confirmation, Fibonacci retracement levels, and trendlines to enhance signal reliability and filter out false signals on TMGM’’s trading platform.
- Select appropriate timeframes, avoid trading in choppy or sideways markets, implement stop-loss and take-profit orders, test strategies on a demo account first, and maintain documented trading rules to apply MACD consistently on TMGM’’s platform.
What is the MACD Indicator?
The MACD is a momentum oscillator that illustrates the relationship between two exponential moving averages (EMAs) of an asset’s price.’
The MACD comprises three primary components:
MACD Line: The difference between the short-term and long-term EMAs, signaling potential trend shifts.
Signal Line: A 9-period EMA of the MACD line, which generates buy or sell signals.
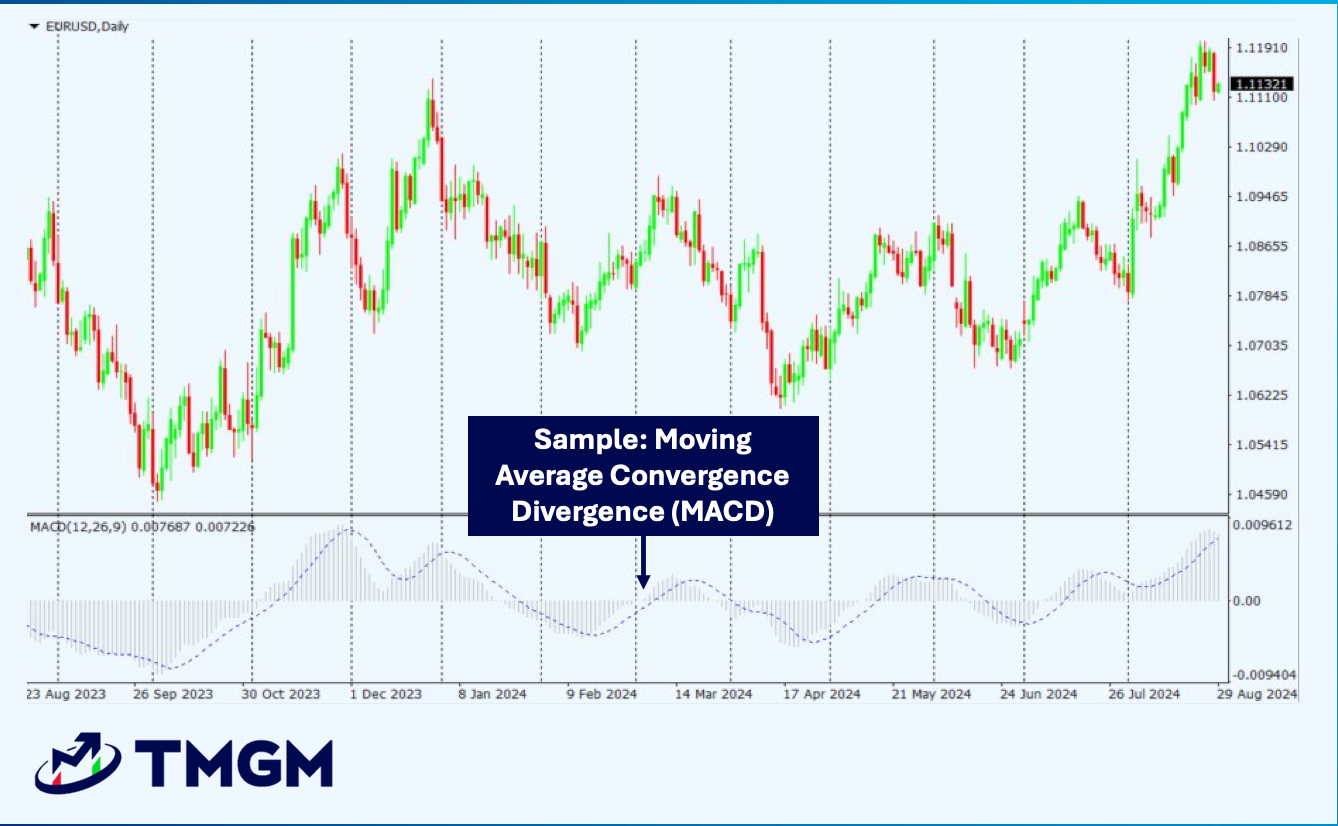
Histogram/Price Chart: A graphical representation of the difference between the MACD and signal lines, indicating momentum strength.
How is the MACD Calculated?
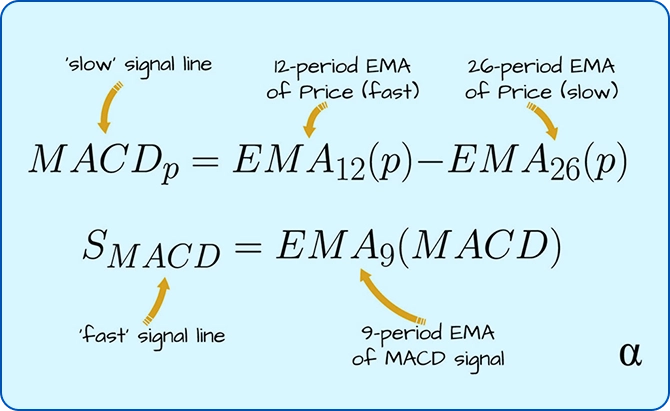
Short-Term EMA: A fast-reacting EMA that responds quickly to recent price changes.
Long-Term EMA: A slower EMA that smooths out short-term price fluctuations.
MACD Line: Calculated as the short-term EMA minus the long-term EMA.
Signal Line: A 9-period EMA of the MACD line.
Histogram: The difference between the MACD line and the signal line.
Interpreting MACD Signals
1. MACD Crossovers:
Bullish Crossover: Occurs when the MACD line crosses above the signal line, indicating potential upward momentum.
Bearish Crossover: Occurs when the MACD line crosses below the signal line, suggesting potential downward momentum.
2. MACD Divergence:
Positive Divergence: When price forms lower lows but the MACD forms higher lows, indicating a possible bullish reversal.
Negative Divergence: When price makes higher highs but the MACD forms lower highs, signaling a potential bearish reversal.
Using MACD for Trend Identification
The MACD is a valuable tool for identifying trends and timing entries and exits:
Bullish Crossovers: May indicate the onset of a short-term bullish trend.
Bearish Crossovers: May signal a downward trend reversal.
Histogram Analysis: Increasing histogram bars suggest strengthening momentum; decreasing bars indicate weakening momentum.
Combining MACD with Other Indicators
Combining MACD with Moving Averages
Overlay moving averages to validate MACD signals:
Golden Cross: When the short-term moving average crosses above the long-term moving average, it is a bullish signal.
Death Cross: When the short-term moving average crosses below the long-term moving average, it is a bearish signal.
Using MACD and RSI (Relative Strength Index)
Use RSI (Relative Strength Indicator) to identify overbought or oversold zones:
Overbought RSI + bearish MACD crossover = potential downtrend.
Oversold RSI + bullish MACD crossover = potential uptrend.
Volume Analysis
Analyze trading volume alongside MACD signals using TMGM’s best trading platform and trading tools:
- Rising volume with bullish MACD = stronger uptrend.
- Falling volume with bearish MACD = confirms weakening price action.
Fibonacci Retracement
Fibonacci retracement levels can act as dynamic support and resistance areas. When paired with MACD:
A bullish MACD crossover near a key Fibonacci support level can signal a strong long setup.
A bearish MACD signal near a retracement resistance level strongly suggests a sell opportunity.
Trendline Trading Strategy
Drawing trend lines helps traders visualize potential support or resistance. When used with MACD:
A MACD crossover that aligns with a trendline trading signal or opportunity increases confidence in a trade entry.
Trendline breaks combined with MACD divergence can suggest early signs of trend reversal.
Popular MACD Strategies
Choose the Right Timeframe: TMGM’s flexible charting options allow you to select timeframes that align with your trading strategy, whether short-term or long-term.
Combine Indicators: To confirm MACD signals, use TMGM’s extensive technical tools, such as Bollinger Bands or Fibonacci retracements.
Avoid Sideways Markets: TMGM’s real-time market data helps identify clear trends, avoiding unreliable MACD signals in choppy markets.
Implement Risk Management: Use TMGM’s stop-loss and take-profit features to protect your capital and secure gains.
Practice with a Demo Account: You can test MACD strategies risk-free on TMGM’s demo account before applying them to live markets.
MACD Trading Strategies Example:
A trader sees a bullish MACD crossover confirmed by rising volume and an oversold RSI. They may choose to enter a long position with a stop-loss placed below recent support.
Key Takeaways:
MACD is a momentum indicator that reveals the relationship between two EMAs.
Traders use the MACD indicator to identify trends, reversals, and entry/exit signals.
MACD divergence can warn of potential trend reversals.
Key strategies include the MACD crossover, histogram analysis, and zero-line cross.
Combining MACD with RSI, Fibonacci Retracement, Moving Averages, and Volume Analysis adds confirmation and reduces false signals.
Use risk management and avoid trading MACD in sideways or choppy markets.
Want to Practice MACD Strategies Risk-Free?
Test your MACD strategy with a demo account before entering live trades. Practice combining MACD with other indicators and timeframes to build confidence.
Why Trade with TMGM?
TMGM offers a suite of tools and resources to maximize the effectiveness of your trading strategies:
Advanced Charting Tools: Customize your MACD analysis with detailed charts and overlays.
Diverse Asset Selection: Trade forex, indices, commodities, and more, including popular cryptocurrencies.
Fast Execution: Experience lightning-fast trade execution for optimal entry and exit.
Educational Resources: Access webinars, tutorials, and guides to improve your trading skills.


