

Trading
Explore a wide range of markets with competitive pricing, deep liquidity, and advanced trading tools.
Learn More 
Platform
Trade seamlessly with TMGM's powerful platform, built for speed, precision, and a superior trading experience.
Learn More Trading Platform
Academy
Learn the fundamentals of trading with beginner-friendly resources, including guides, webinars, and market insights.
Learn More News & Analysis
Get real-time market updates and expert analysis to stay ahead of trading opportunities
Learn More News & Analysis
About
Learn what sets TMGM apart — our global presence, regulatory strength, and commitment to innovation in trading.
Learn More Why Choose TMGM
Sponsorship
EUR/USD Price Forecast: Fresh decline below 1.1100 gathers support from a stronger US Dollar
- Broad US Dollar strength pushes EUR/USD lower towards 1.1138.
- Persistently elevated US core CPI prompts traders to step up bets on a hawkish Fed.
- Christine Lagarde to be replaced as ECB President by Klass Knot.
Pressure from a firmer US Dollar (USD) leaves the Euro (EUR) 0.2% lower at around 1.1138 in Wednesday’s European session. Weighing on EUR/USD are concerns that the Federal Reserve (Fed) could pursue an aggressive monetary tightening cycle to curb inflationary pressures that continue to accelerate, lending support to the US Dollar.

How Is The US Dollar Performing Today?
Today’s percentage moves in the US Dollar (USD) against the major currencies listed are set out below. The Swiss Franc recorded the largest decline against the US Dollar.
| USD | EUR | GBP | JPY | CAD | AUD | NZD | CHF | |
|---|---|---|---|---|---|---|---|---|
| USD | 0.22% | 0.21% | 0.16% | 0.23% | -0.03% | 0.24% | 0.47% | |
| EUR | -0.22% | -0.01% | -0.05% | 0.01% | -0.26% | 0.02% | 0.24% | |
| GBP | -0.21% | 0.01% | -0.04% | 0.02% | -0.24% | 0.04% | 0.26% | |
| JPY | -0.16% | 0.05% | 0.04% | 0.07% | -0.19% | 0.07% | 0.30% | |
| CAD | -0.23% | -0.01% | -0.02% | -0.07% | -0.26% | 0.00% | 0.23% | |
| AUD | 0.03% | 0.26% | 0.24% | 0.19% | 0.26% | 0.28% | 0.50% | |
| NZD | -0.24% | -0.02% | -0.04% | -0.07% | -0.01% | -0.28% | 0.23% | |
| CHF | -0.47% | -0.24% | -0.26% | -0.30% | -0.23% | -0.50% | -0.23% |
Percentage movements between major currencies are displayed in the heat map. Select the base currency in the left-hand column and the quote currency in the top row. For instance, selecting the US Dollar on the left and following that row across to the Japanese Yen gives the percentage change for USD (base)/JPY (quote) in the corresponding cell.
A rise to 102.51 takes the US Dollar Index (DXY) to a fresh high of almost four weeks during European trading. The index tracks the Greenback against a basket of six major currencies.
Following October’s stronger-than-forecast United States (US) Consumer Price Index (CPI) release, financial markets have begun factoring in a December interest rate increase of 50 basis points (bps), according to the CME FedWatch tool. The probability nevertheless remains modest, at around 13.5%.
In a note, Deutsche Bank strategists observed that the “monthly core CPI print for October was above consensus at +0.30% (vs. +0.2% expected).” The bank further noted that “it was the third consecutive month with core CPI at +0.3%, and if you take those three months together, the annualised pace for core CPI is running at +3.75%.” Describing the significance of the figures, the bank said “that’s the fastest pace on that measure since April 2024, so it made it increasingly difficult to dismiss this as a blip.”
Turning to headline inflation, the bank also highlighted that “meanwhile, the headline CPI numbers were faster still, with monthly headline CPI at +0.35% (vs. +0.3% expected), with the 3-month annualised pace at +5.72%.”
For the Euro, the anticipated leadership transition at the European Central Bank (ECB) is expected to sustain high volatility.
What does Klaas Knot’s crisis-readiness signal mean for ECB succession?
A Financial Times interview with Dutch central banker Klaas Knot, a leading contender to succeed ECB President Christine Lagarde, drew attention from Rabobank. The bank highlights his emphasis on the Governing Council’s crisis-management credentials and his assertion that “If circumstances require it, we will not hesitate to take action.” Rather than suggesting a return to “50bps rate hikes due to geopolitically driven inflation,” analysts interpret his comments as addressing the reverse scenario: a future European crisis “of a different nature.” Against that backdrop, Rabobank notes that Knot “would not rule out developing another, more tailored instrument,” suggesting the possibility of new policy tools if conditions worsen again.
EUR/USD Technical Analysis: Can The Pair Stabilise?
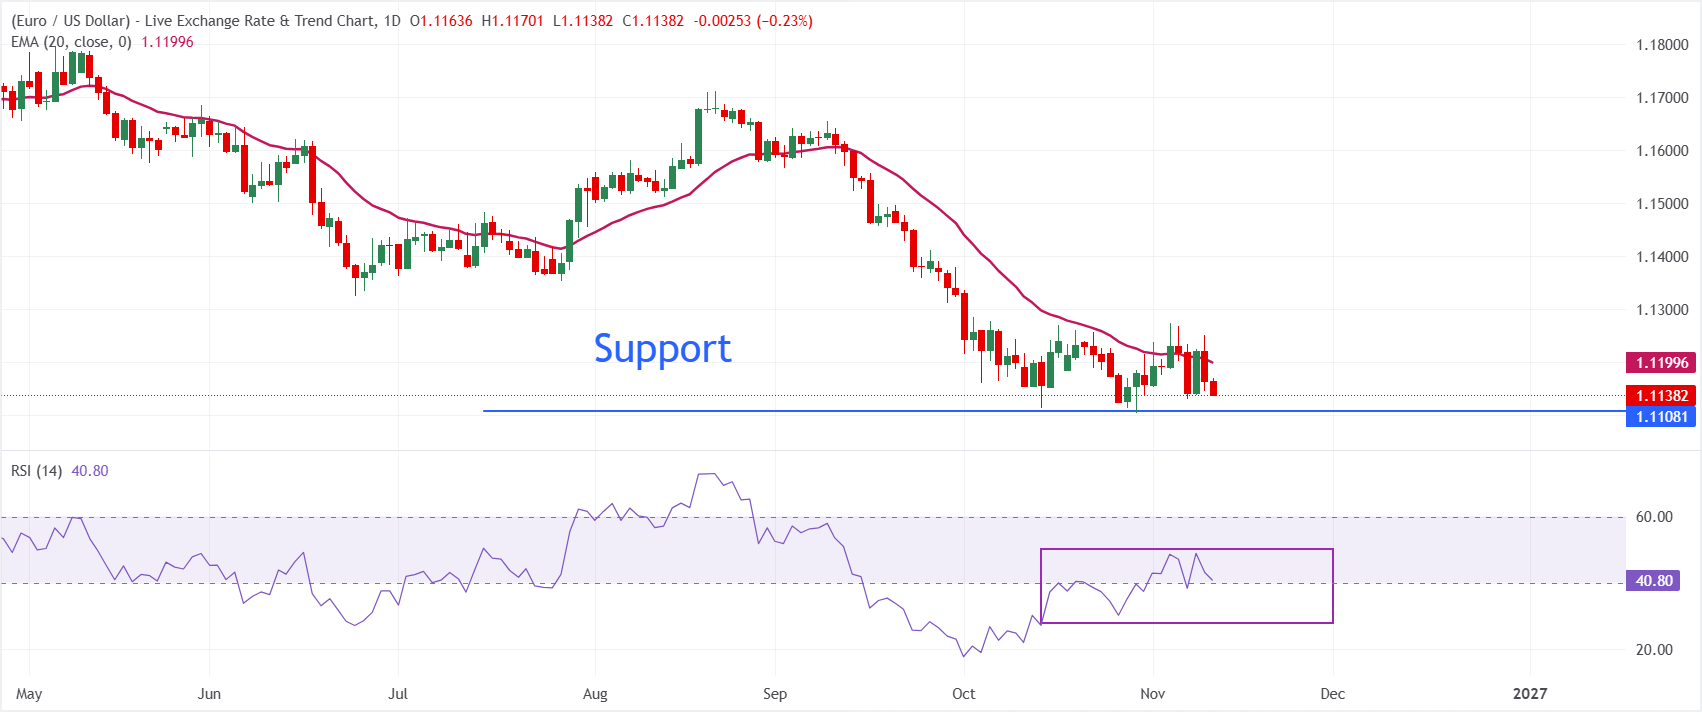
Trading at 1.1138 on the daily chart, EUR/USD retains a mildly bearish bias. The pair remains below recent closing levels and just beneath its 20-day exponential moving average (EMA) of 1.1200, now a nearby barrier.
Despite an easing of the oversold conditions recorded earlier in the month, the 14-day Relative Strength Index (RSI) suggests selling pressure still dominates. It stands near 41, below the neutral threshold of 50.
Immediate downside support lies at the recent low of 1.1104, with a breach leaving 1.1000 exposed. Conversely, an initial indication of stabilisation would come from a rebound towards the 20-day EMA support zone around 1.1200. To temper the prevailing bearish bias and allow a wider corrective recovery, the pair would need to hold above that level.
(The technical analysis of this story was written with the help of an AI tool. Know more.)
Economic Data Indicator
Consumer Price Index excluding Food & Energy (MoM)
By periodically adding up prices across a representative basket of goods and services, the Consumer Price Index (CPI) measures inflationary or deflationary trends. The US Department of Labor Statistics compiles and publishes the figures monthly. Its month-on-month (MoM) reading compares goods prices in the reference month with those in the preceding month. For a more accurate gauge of price pressures, the CPI Ex Food & Energy leaves out the food and energy components, which are considered more volatile. A higher reading is generally regarded as supportive of the US Dollar (USD), whereas a lower reading is viewed as negative.
Explore further.Latest release: Tue 10 Nov 2026 13:30
Release frequency: Monthly
Reported figure: 0.3%
Consensus estimate: 0.2%
Prior reading: 0.3%
Data source: US Bureau of Labor Statistics
An aggressive stance is expected to remain in place at the US Federal Reserve for the foreseeable future, following the measures it has already taken to curb inflation. The central bank’s dual mandate combines price stability with maximum employment, with inflation intended to stay around 2% YoY. Since the onset of the pandemic, which continues to this day, inflation has become the weakest aspect of that mandate. Supply-chain disruptions and bottlenecks continue to drive price pressures higher, leaving the Consumer Price Index (CPI) at multi-decade highs.
POPULAR ARTICLES
1EUR/USD: Range persists as Dollar outperforms – Societe Generale2Is the United States Dollar Index extending its rally on stronger prospects of a 50 bps Fed rate hike?3Ripple Price Forecast: XRP recovery potential remains constrained despite pause in correction4US Dollar: Why Rate Hike Repricing Is Raising Upside Risks – MUFG5US Treasuries: How did the CPI shock drive yields sharply higher? – Deutsche Bank6Gold Price Forecast: Can XAU/USD extend gains with bulls held below $4,050?7Gold faces pressure near $4,050 as bets on Fed rate hikes gather momentum8EUR/USD Price Forecast: Fresh decline below 1.1100 gathers support from a stronger US Dollar9Why Does Societe Generale See the Australian Dollar as Vulnerable After Weak Data?


Get Started!
Sign up and access the Global Markets in less than 3 minutes

Connect With Us












The information provided on this website is of a general nature only and does not constitute personal financial advice. Before acting on any information on this website, you should consider the suitability of the information in relation to your objectives, financial situation and needs. Investing in CFDs and FX Margin Contracts carries significant risks and is not suitable for all investors. You may lose more than your initial deposit. You do not own, or have, any interest in the underlying asset. We recommend that you seek independent advice and ensure you fully understand the risks involved before trading. It is important that you read and consider the disclosure document before you acquire any product listed on the website. The information and advertisements offered on this website are not intended for use by any person in any country or jurisdiction where such use would be contrary to local laws and regulations. The Products and Services offered on this website are not intended for residents of the United States, Malaysia and Thailand.
TMGM is authorized and regulated in various jurisdictions.
Trademax Australia Limited, trading as TMGM, is regulated by the Australian Securities and Investments Commission (ASIC), AFSL no. 436416 and is located at Level 28, One International Tower, 100 Barangaroo Avenue, 2000 Sydney, NSW Australia.
Email: support@tmgm.com.au
Trademax Global Limited, trading as TMGM, is authorized and regulated by the Vanuatu Financial Services Commission (VFSC), registration number 40356 and registered at 1276, Kumul Highway, Port Vila, Vanuatu, Republic of Vanuatu.
Email: support@tmgm.com
Trademax Global Markets (SE) Limited, trading as TMGM, is authorized and regulated by the Financial Services Authority (FSA) of Seychelles, with license number SD224. The company is registered at Office No 13, Providence Estate ABIS Centre, Mahe, Seychelles.
Email: support@tmgm.com
Trademax Global Markets (International) Pty Ltd, trading as TMGM, is authorized and regulated by the Financial Services Commission, Mauritius (FSC) with license no. GB22201012, and registered at 33, Edith Cavell Street C/o IQ EQ Fund Services (Mauritius) Ltd Port Louis, 11324 Mauritius.
Email: support@tmgm.com
Copyright © TMGM. All rights reserved