

Trading
Explore a wide range of markets with competitive pricing, deep liquidity, and advanced trading tools.
Learn More 
Platform
Trade seamlessly with TMGM's powerful platform, built for speed, precision, and a superior trading experience.
Learn More Trading Platform
Academy
Learn the fundamentals of trading with beginner-friendly resources, including guides, webinars, and market insights.
Learn More News & Analysis
Get real-time market updates and expert analysis to stay ahead of trading opportunities
Learn More News & Analysis
About
Learn what sets TMGM apart — our global presence, regulatory strength, and commitment to innovation in trading.
Learn More Why Choose TMGM
Sponsorship
Ripple Price Forecast: XRP recovery potential remains constrained despite pause in correction
- Recovery prospects weaken for XRP even as it stays just above the crucial $1.00 support.
- A three-month low of $189 million marks the latest decline in Binance XRP futures open interest.
- Bulls gain some near-term respite as XRP remains above weekly SuperTrend support, although the wider technical picture stays bearish.
A pause in selling pressure has brought some calm to Ripple (XRP), mirroring the broader cryptocurrency market's respite after recent turbulence. The token trades near $1.06 on Wednesday as its correction pauses. Beneath the remittance token, a firm support zone stretches from $0.94 to the prevailing market price, but structural barriers, including key moving averages, continue to constrain its recovery potential.

What Does Binance XRP Open Interest at $189M Signal?
Risk appetite has weakened as XRP futures open interest (OI) on Binance dropped to a three-month low of $189 million on Wednesday, according to a report published on CryptoQuant. By comparison, OI on the same exchange averaged $182 million in August.
Meanwhile, XRP open interest on Bybit rose from $229 million on August 2 to $255 million. On OKX, XRP derivatives volumes stood at approximately $46 million as of November 11.
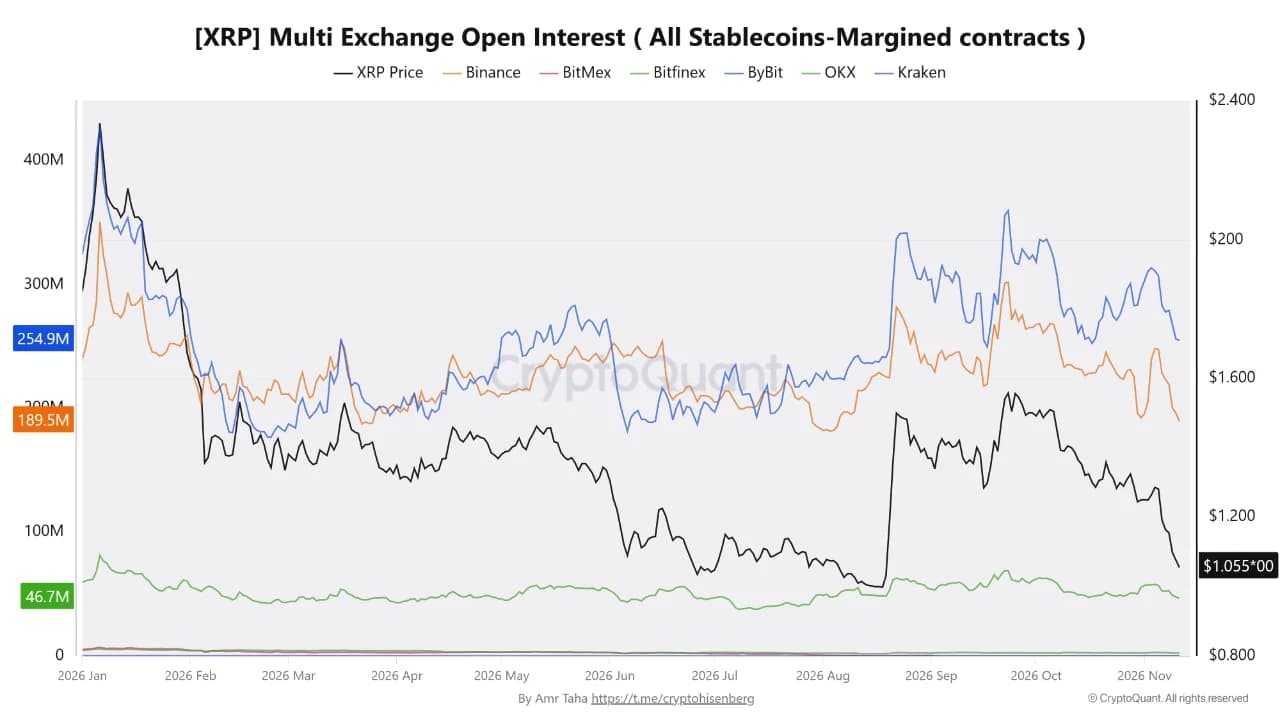
With XRP trading around $1.06, combined open interest across Binance, Bybit and OKX has risen to about $490 million. Derivatives exposure therefore remains uneven across the major exchanges: Binance has returned to levels last seen in early August, whereas Bybit retains a relatively larger outstanding position.
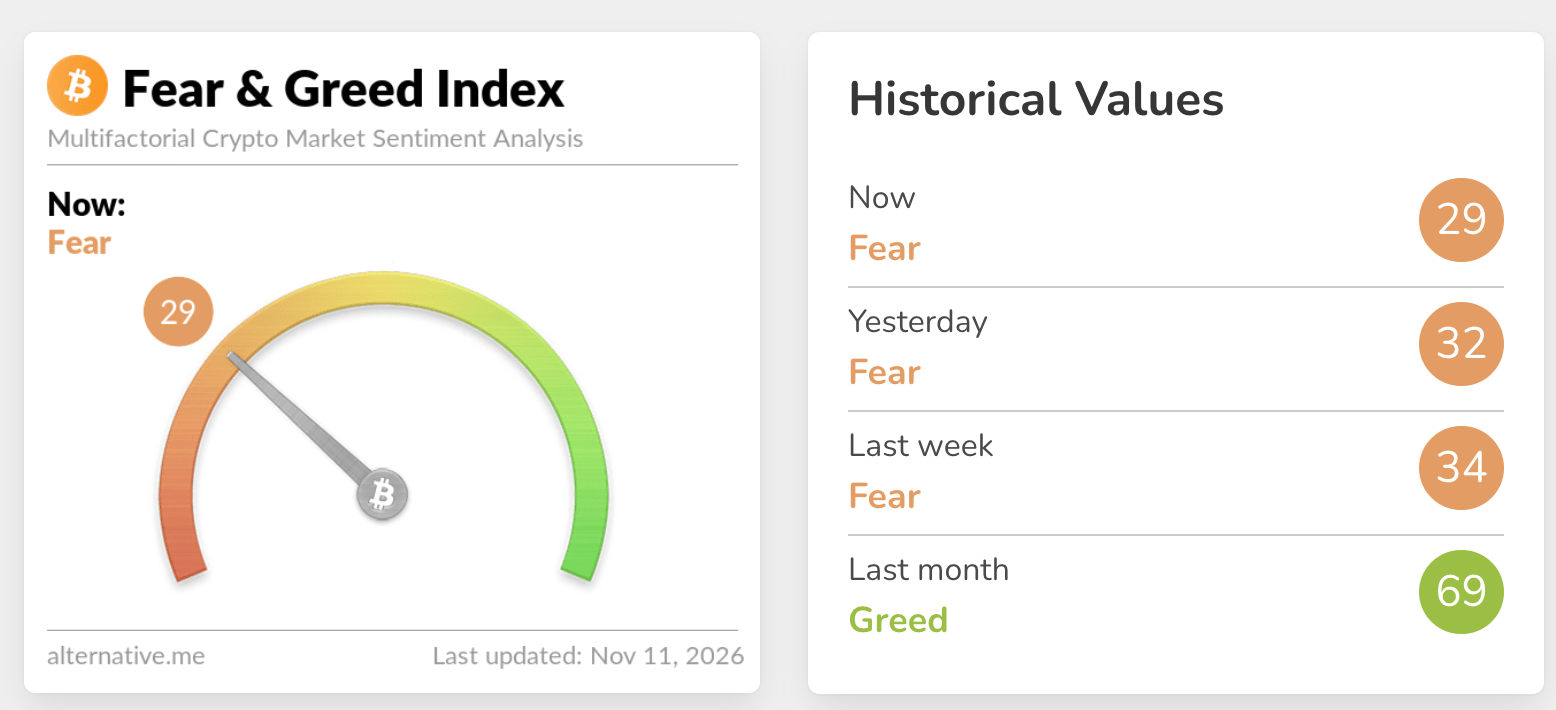
Weak futures OI is also consistent with the Fear & Greed Index reading of 29 on Wednesday, placing it in Fear territory and slightly below the previous day's 32. Last month, by contrast, the index averaged 69 in Greed territory, with the shift weighing on already diminishing investor appetite.
Technical analysis: Can XRP maintain its key support?
The bearish phase remains firmly in place for XRP at $1.06, with the price substantially below the 50-day, 100-day and 200-day Exponential Moving Averages (EMAs), grouped roughly between $1.28 and $1.35. Further reinforcing the downside bias is the SuperTrend indicator at $1.22, above the current market price. At about 24, the Relative Strength Index (RSI) is moving deeper into oversold territory, while the Moving Average Convergence Divergence (MACD) stays negative. Together, these indicators point to bearish momentum that remains persistent but stretched.
The first upside hurdle is the SuperTrend level around $1.22, followed by a closely packed group of EMAs. Within that cluster, the 50-day EMA stands at $1.28, while a nearby descending resistance trendline at $1.29 adds selling pressure. Further resistance comes from the 100-day EMA at $1.30 and the longer-term 200-day EMA at $1.35; reclaiming these levels would be necessary to soften the prevailing bearish outlook. With no clearly established support beneath the spot price, the pair remains exposed to further declines until new demand materialises.
Weekly indicators also retain a bearish tilt. The spot price is substantially below the 50-week, 100-week and 200-week EMAs at $1.46, $1.55 and $1.37, respectively, leaving a broad band of overhead resistance. Adding to that supply is a long-standing descending trendline drawn from previous cycle highs, which projects to around $1.44.
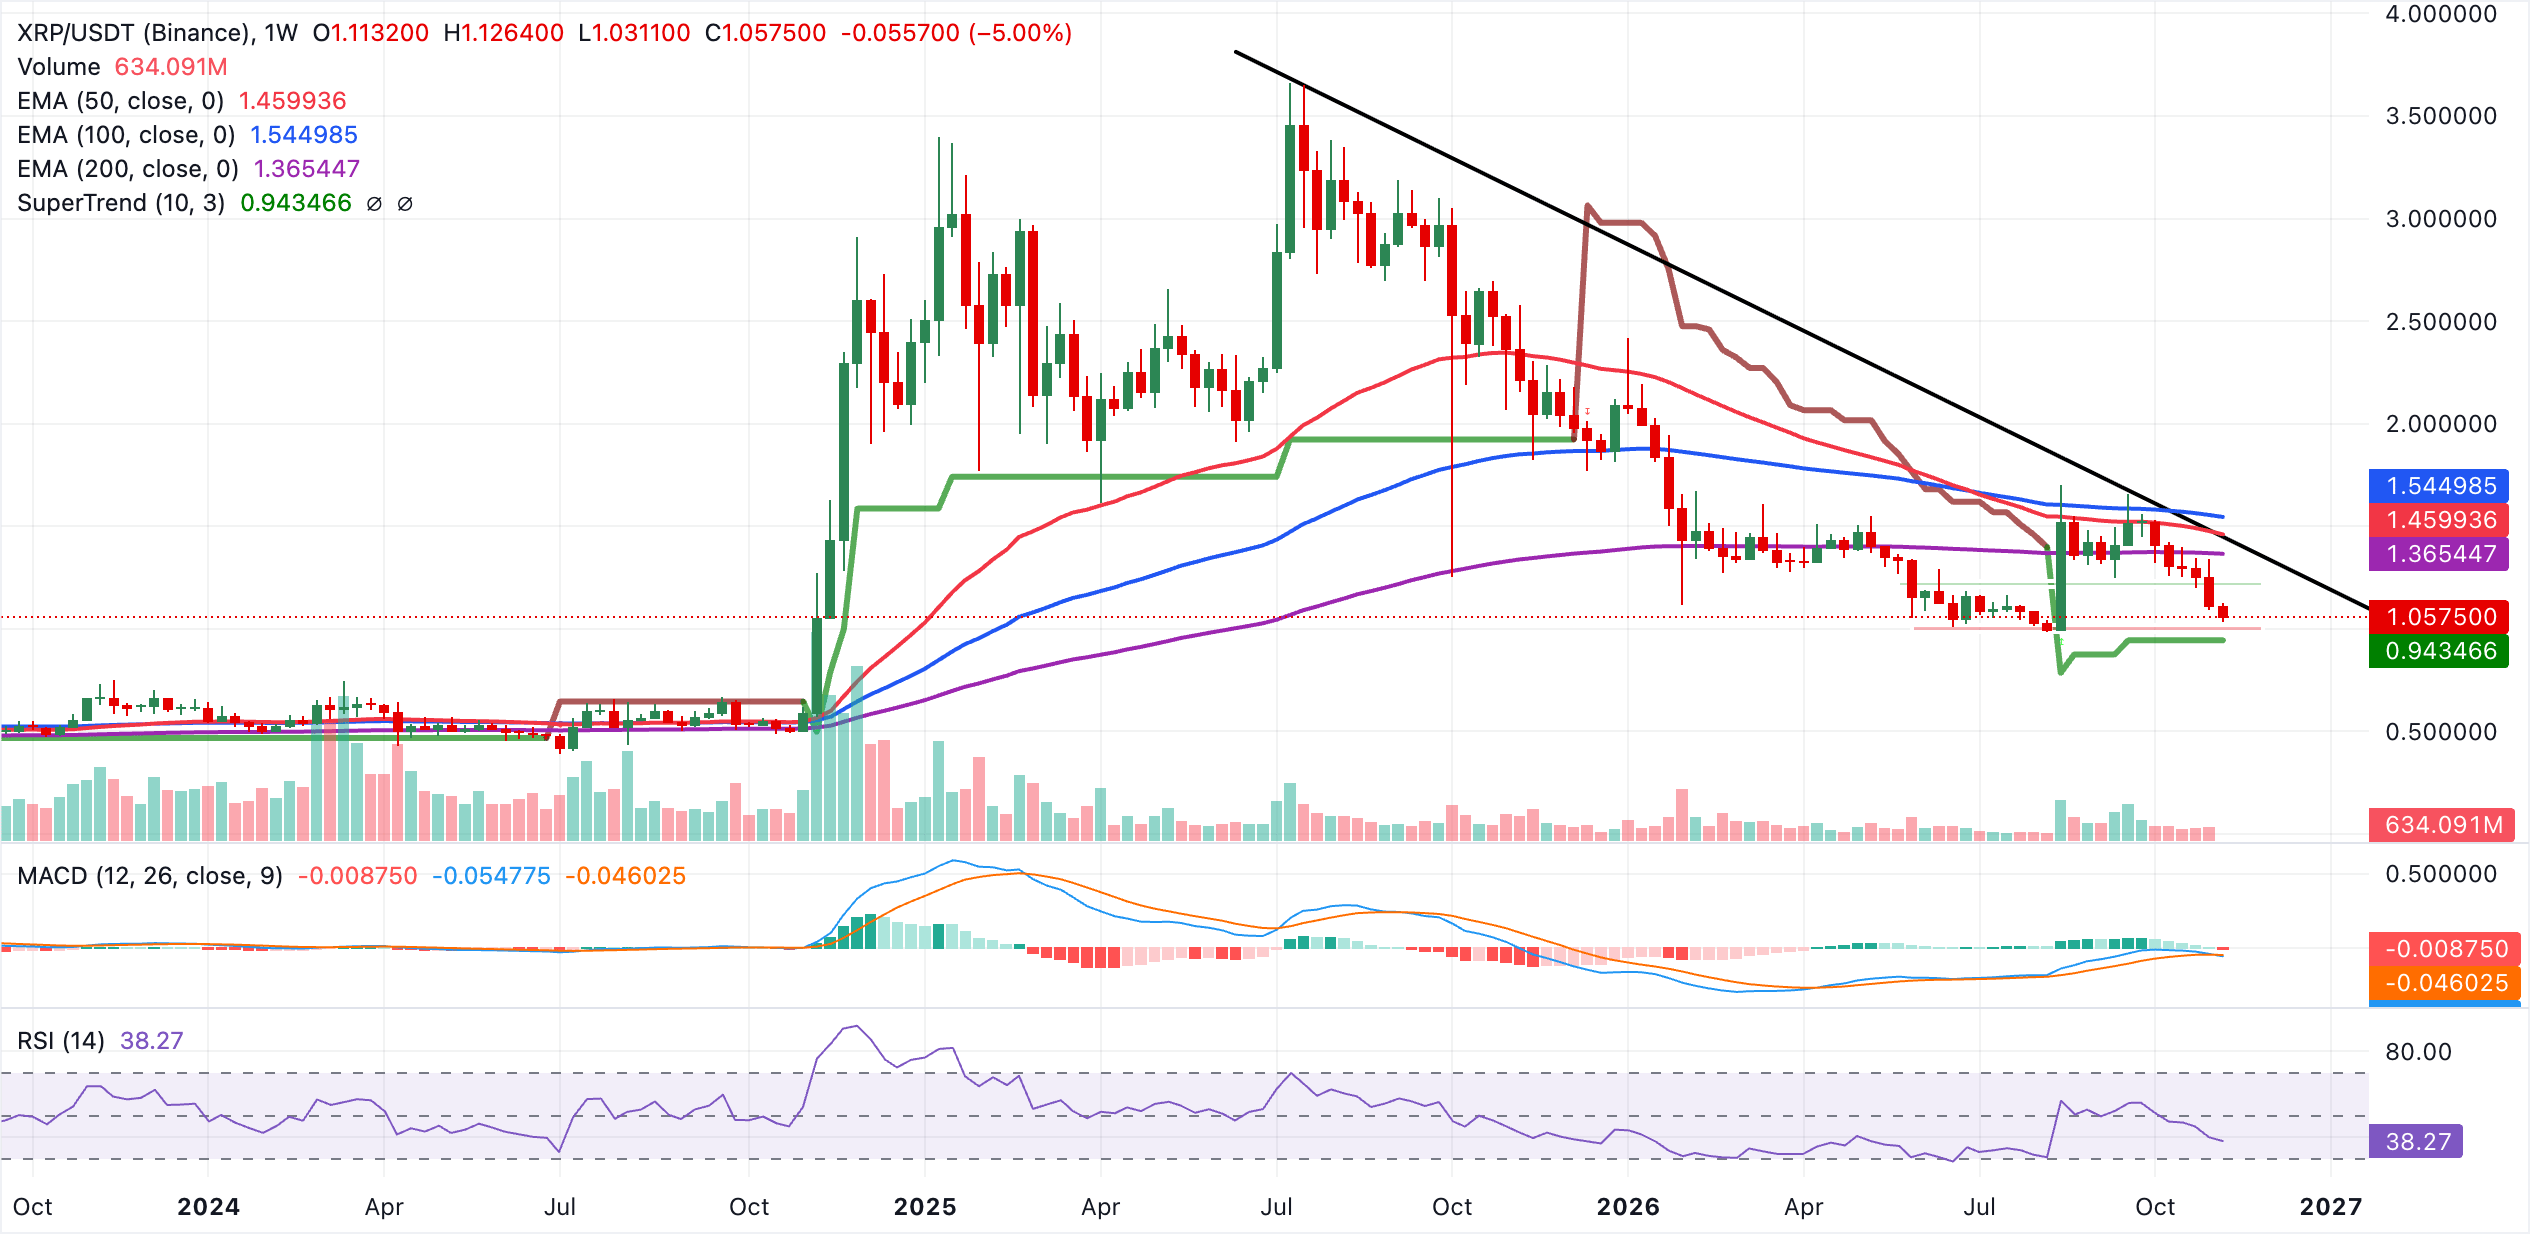
Should sellers tighten their grip, the weekly SuperTrend line near $0.94 provides initial technical support and the first significant demand zone. A recovery, meanwhile, would initially have to test the 200-week EMA around $1.37 before confronting the descending trendline near $1.44. A sustained move above both would bring the higher EMA cluster into view: the 50-week EMA at $1.46, followed by the 100-week EMA around $1.55. These subsequent resistance levels are likely to restrain gains on their first tests.
(The technical analysis of this story was written with the help of an AI tool. Know more.)
FAQs on cryptocurrency metrics
For each cryptocurrency, its developer or creator sets the total number of tokens available to be minted or issued. The underlying blockchain's algorithm determines how many of these assets can be minted through mining, staking or other mechanisms. Circulating supply can also shrink, whether through token burning or assets being mistakenly sent to addresses on incompatible blockchains.
Multiplying an asset's circulating supply by its current market value gives its market capitalisation.
Over a defined trading period, such as 24 hours, trading volume measures the total number of tokens of a particular asset exchanged between buyers and sellers. By combining volumes across centralised and decentralised exchanges, the metric helps assess market sentiment. Rising trading volume often signals demand for an asset, as more participants are buying and selling the cryptocurrency.
To encourage traders to take positions and keep perpetual contract prices aligned with spot markets, exchanges use funding rates. Under this mechanism, periodic payments help futures prices and index prices converge regularly. A positive funding rate indicates that the perpetual contract price exceeds the mark price, so bullish traders holding long positions pay those holding short positions. Conversely, when perpetual prices fall below the mark price, the funding rate is negative and traders with short positions pay those with long positions.
POPULAR ARTICLES
1Canadian Dollar falls to four-week lows at 1.4230 as bets on Fed tightening strengthen the Greenback2As the Japanese Yen slips towards 160.00, why are strategists still betting on it to strengthen?3US inflation fuels Fed hike bets, driving Japanese Yen lower towards 1604WTI Oil holds above $85 as optimism over a Middle East peace agreement begins to wane5EUR/USD: Pair stays range-bound amid Dollar outperformance – Societe Generale6Is the United States Dollar Index extending its rally on stronger prospects of a 50 bps Fed rate hike?7Ripple Price Forecast: XRP recovery potential remains constrained despite pause in correction8US Dollar: Why Rate Hike Repricing Is Raising Upside Risks – MUFG9US Treasuries: How did the CPI shock drive yields sharply higher? – Deutsche Bank


Get Started!
Sign up and access the Global Markets in less than 3 minutes

Connect With Us












The information provided on this website is of a general nature only and does not constitute personal financial advice. Before acting on any information on this website, you should consider the suitability of the information in relation to your objectives, financial situation and needs. Investing in CFDs and FX Margin Contracts carries significant risks and is not suitable for all investors. You may lose more than your initial deposit. You do not own, or have, any interest in the underlying asset. We recommend that you seek independent advice and ensure you fully understand the risks involved before trading. It is important that you read and consider the disclosure document before you acquire any product listed on the website. The information and advertisements offered on this website are not intended for use by any person in any country or jurisdiction where such use would be contrary to local laws and regulations. The Products and Services offered on this website are not intended for residents of the United States, Malaysia and Thailand.
TMGM is authorized and regulated in various jurisdictions.
Trademax Australia Limited, trading as TMGM, is regulated by the Australian Securities and Investments Commission (ASIC), AFSL no. 436416 and is located at Level 28, One International Tower, 100 Barangaroo Avenue, 2000 Sydney, NSW Australia.
Email: support@tmgm.com.au
Trademax Global Limited, trading as TMGM, is authorized and regulated by the Vanuatu Financial Services Commission (VFSC), registration number 40356 and registered at 1276, Kumul Highway, Port Vila, Vanuatu, Republic of Vanuatu.
Email: support@tmgm.com
Trademax Global Markets (SE) Limited, trading as TMGM, is authorized and regulated by the Financial Services Authority (FSA) of Seychelles, with license number SD224. The company is registered at Office No 13, Providence Estate ABIS Centre, Mahe, Seychelles.
Email: support@tmgm.com
Trademax Global Markets (International) Pty Ltd, trading as TMGM, is authorized and regulated by the Financial Services Commission, Mauritius (FSC) with license no. GB22201012, and registered at 33, Edith Cavell Street C/o IQ EQ Fund Services (Mauritius) Ltd Port Louis, 11324 Mauritius.
Email: support@tmgm.com
Copyright © TMGM. All rights reserved