


Key Takeaways
- Swing trading targets multi-day price moves within broader trends, offering the chance for steady gains with less screen time when guided by a structured plan and clear risk limits.
- Building a foundation means learning core charting and indicators, defining entries/exits, and using stop-losses and real-time P&L tracking so decisions follow rules rather than impulses.
- Effective techniques include trend-following, support/resistance, price channels (e.g., Bollinger Bands), ATR-based volatility tactics, and Fibonacci pullbacks, adapted to the instrument and confirmed by volume.
- Discipline and risk management—position sizing, favorable risk-to-reward targets, predefined stops, and a trading journal—protect capital and reduce emotion-driven mistakes.
- Swing trading can be profitable but not guaranteed; outcomes depend on strategy quality, market conditions, and risk control, so expect variability and prioritize continuous testing and refinement.

What Is Swing Trading? Building Your Swing Trading Strategies Foundation
Before you start swinging for a homerun, it’s crucial to lay a solid foundation of swing trading knowledge. This means learning and understanding key concepts such as utilising Technical Analysis tools, interpreting chart patterns, and implementing proper risk management techniques. These methods will help you understand market momentum and make informed decisions to maximise your trading potential.
Swing trading is all about spotting medium-term market movements within longer-term trends. Unlike day trading strategies, where traders only focus on intra-day trends. As the market typically does not move in a perfectly straight line, the goal is to capitalize on dips and hikes by entering and exiting trades to achieve consistent and incremental gains. Mastering these basics will set you up for success as you explore more advanced swing trading strategies and apply advanced technical indicators.
Before you proceed, consider learning how to set up stop-loss orders for swing trading, as this will be an important tool to help you protect your capital and mitigate large downturns in the long-run. You should also consider learning how to track your trading profits and losses in real time for better oversight of your portfolio.
The 3 Most Famous Swing Trading Approaches
In the world of swing trading, thousands of strategies exist, but almost all of them fall into three specific "buckets" based on what the market is doing. Professionals don't just pick a strategy at random; they look at the market condition first, then choose the right tool for the job.
Here are the most common swing trading strategies with examples.
1. Trend Following Strategies (The "Pullback")
This is the most common starting point for beginners because it puts the wind at your back. The goal here is simple: identify a stock that is already going up, wait for it to take a temporary breath (the "pullback"), and buy it before it resumes its climb. By using charts and technical indicators like Moving Average Convergence Divergence and Trendlines, you can gauge the market sentiment and determine whether to enter a long or short position – by spotting whether the asset is moving up, down, or sideways. Direction and momentum are the keys here to maximising potential gains.
The Moving Average Bounce
Many traders watch the 50-day, 200-day Moving Averages as significant support levels across different markets. When a strong stock drops down and touches this line, it very often acts as a dynamic floor. If you see price stabilize or form a green candle right on this line, it is a high-probability signal to enter.
Example: In early 2023, the EUR/USD consistently traded above its 50-day moving average, clearly signaling an upward trend. Traders who entered long positions during this bullish phase saw profitable results due to sustained momentum.
Why It Works: Trend following is effective because it aligns trading decisions with prevailing market conditions. Markets often exhibit clear and sustained directional trends driven by macroeconomic factors, monetary policy changes, or geopolitical events. By trading with the trend, traders minimize the risks associated with countertrend movements, thereby improving the likelihood of profitable outcomes.
The Bull Flag Pattern
This looks exactly like a flag on a pole. The "pole" is a sharp rise in price, and the "flag" is a short period where the price drifts slightly lower on low volume. This drift isn't selling pressure; it’s just early buyers taking profit. Once the price breaks above the top of the flag, the trend typically explodes upward again.
2. Range Trading Strategies (The "Bounce")
Markets don't always trend. roughly 70% of the time, they move sideways, ping-ponging between a high price (Resistance) and a low price (Support). Swing traders love this because the risk points are very clear.
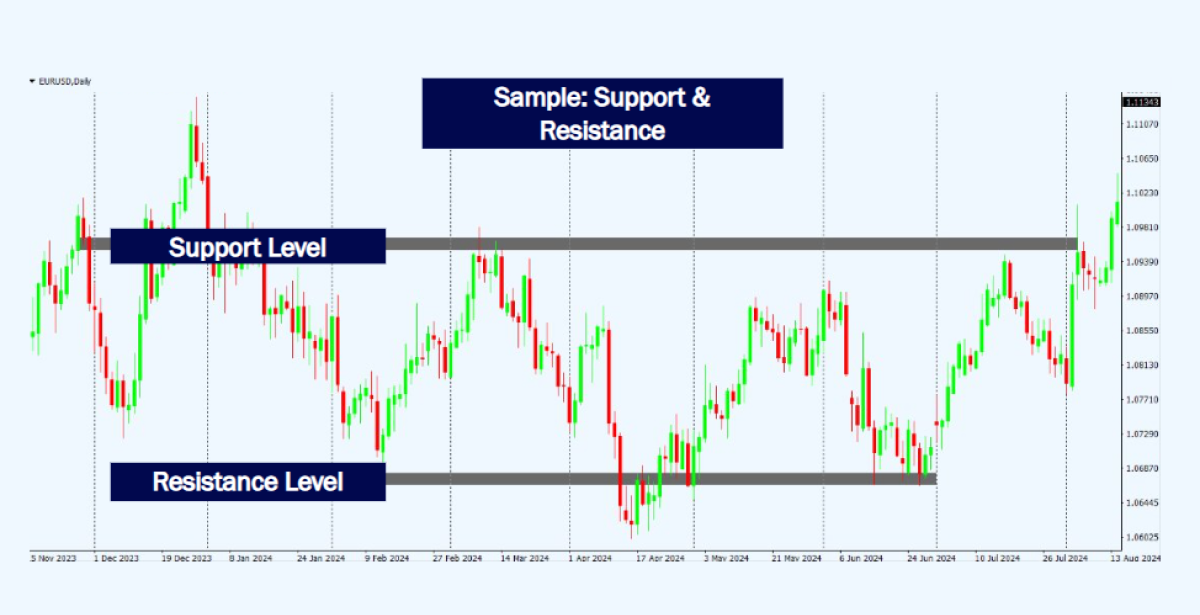
Support & Resistance Reversals
You identify a clear floor where the price has bounced multiple times (Support). You place a buy order just above this floor, with a stop-loss just below it. You profit by selling when it reaches the ceiling (Resistance). The key here is patience: you must wait for the price to actually touch the edge of the range.
Example: In early 2023, gold prices (XAU/USD) repeatedly met resistance around the $2,000 per ounce mark. Traders who observed this level closely recognized an opportunity once the price successfully broke through this barrier, benefiting from subsequent sharp price movements.
Why It Works: Support and resistance levels are grounded in collective market psychology. When a price repeatedly stalls at a certain level, traders anticipate similar behavior in the future. Once a breakout occurs, it signals a shift in market perception, often resulting in significant price moves. Understanding these psychological price points helps traders anticipate and capitalize on market movements effectively.
Bollinger Band Mean Reversion: A Price Channel
Price channels, such as Bollinger Bands, act like an elastic band around the price. In a quiet, sideways market, when the price hits the Lower Band, it is statistically "stretched" too far and is likely to snap back to the middle. This is a favorite for traders who like mathematical signals rather than drawing lines on a chart. By analysing the direction of pricing trends within the channel, traders can infer the direction of a price trend. Typically, traders will utilise price channels like Bollinger Bands together with other technical tools such as chart patterns or MACD to form correlating information in their technical analysis.
Here’s how to interpret Bollinger Bands: the top line is the resistance level which is connected to recent highs, the bottom line connects to recent lows and the third line, the support level, indicates the average.
One common strategy involves buying near the lower band and selling near the upper band, with the addition of stop-loss orders to minimise risk.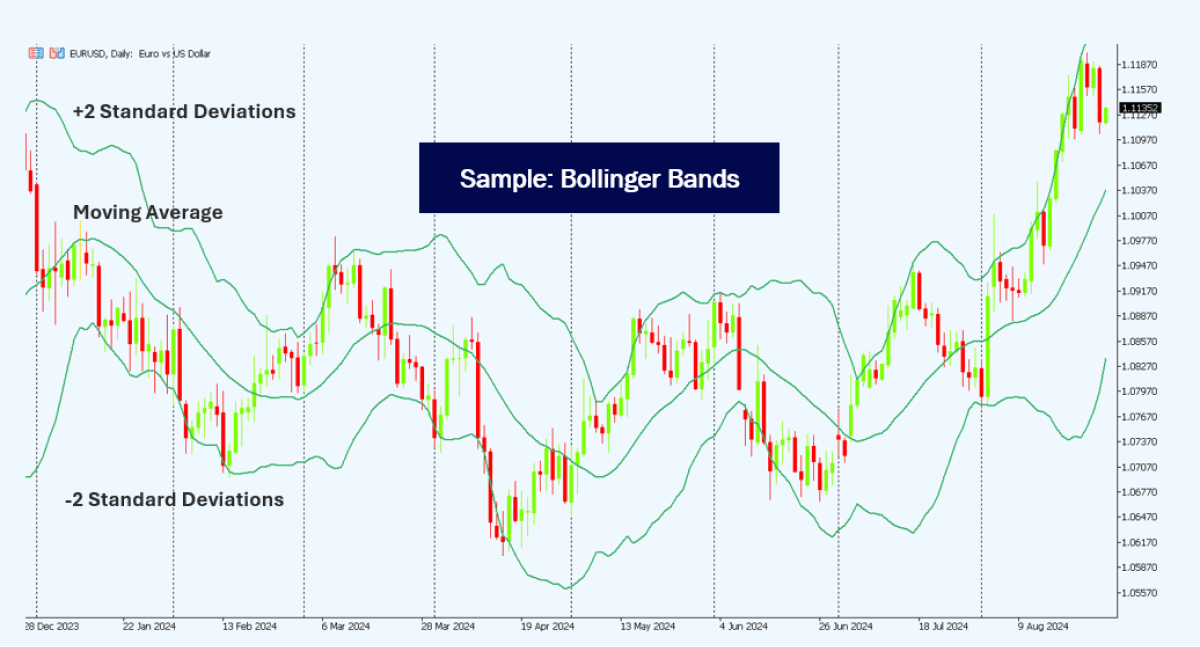
Example: Throughout mid-2022, Ethereum (ETH/USD) moved consistently within clear Bollinger Bands. Traders capitalized by purchasing near the lower boundary (indicative of oversold conditions) and selling near the upper boundary (indicative of overbought conditions).
Why It Works: Price channels provide traders with a structured method to identify overbought and oversold conditions. Because price channels clearly depict volatility and common trading ranges, traders can systematically exploit these patterns for predictable, repeated gains. Utilizing such structured visual tools also reduces emotional biases by providing objective guidelines for trading decisions.
3. Breakout Strategies (The "Explosion")
This strategy requires the most patience but offers the fastest profits. Here, you are watching a stock that has been quiet or "squeezed" into a tight corner. You are betting that when it finally breaks free, the move will be violent and fast.
The Cup and Handle:
As seen in our Henry's swing trading case study, the pattern showed a long period of recovery (the Cup) followed by a final shakeout of weak investors holding positions (the Handle). When price pushes above the handle's rim, it signals that the sellers are exhausted and the buyers are taking full control.
The Average True Range (ATR)
Volatility is a major factor to consider in swing trading. Instead of hitting exactly the high point and low point of an asset’s price range, traders look to take advantage of the movement to capture profits.
The Average True Range (ATR) is a popular indicator for measuring volatility, which tracks how much an asset typically moves in each price candlestick, usually over 14-daily, weekly or monthly price periods. A rise in ATR (or ATR above its moving average) signals increasing volatility, which can accompany breakout phases. Traders typically pair ATR with price action or breakout levels to confirm entries and manage risk.
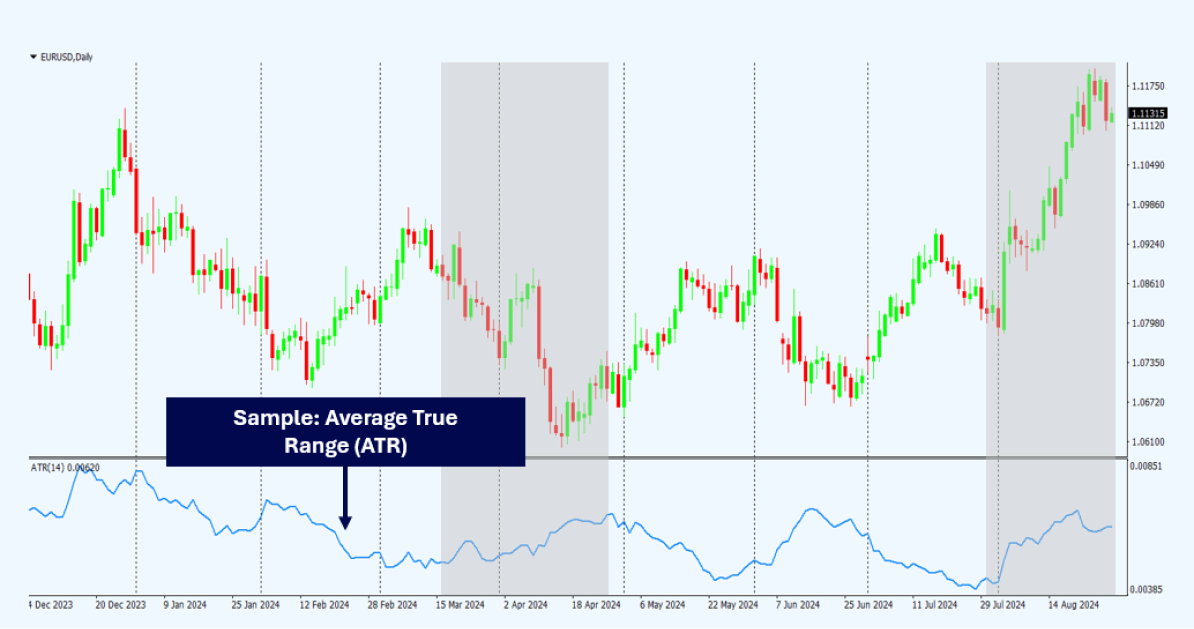
<img src=”https://tmgm-static.oss-cn-hongkong.aliyuncs.com/dateFiles/2025-05-08/vjDBit3xVA.webp” alt=”Candlestick chart annotated with ATR bands to illustrate volatility-based entry points in swing trading strategies.”>
Example: Bitcoin (BTC/USD) exhibited notably high volatility ever since 2020—see how Crypto CFD instruments amplify exposure to these swings reflected in ATR values. Traders who actively monitored ATR changes recognized profitable trading opportunities during periods of increased volatility, maximizing gains from rapid price swings.
Why It Works: Volatility trading thrives because market fluctuations often increase significantly during periods of uncertainty, economic releases, or major news events. By understanding and measuring volatility, traders can strategically position themselves to capture substantial profits during dynamic market conditions, making it particularly suitable for short-term trading strategies.
Fibonacci Retracement: A Core Swing Trading Strategy
Fibonacci Retracement is part of a group of very powerful indicators used to identify support and resistance levels on an asset. By analysing significant price movements and overlaying Fibonacci Ratios, traders can predict possible retracement levels to make informed decisions on when to enter or exit trades. In short, the common retracement levels (38.2%, 50%, and 61.8%) can be referenced to see where the price could move back towards.
You can see how a Fibonacci Retracement happens with the following chart, which shows how the price changes direction while it approaches the resistance and support bands (in red).
Example: During late 2022, GBP/USD experienced a significant rally followed by a retracement to the 50% Fibonacci level. Traders who entered long positions at this level saw profitable returns as the price rebounded from this identified support.
Why It Works: Fibonacci retracements are effective because they leverage common market behaviors and trader psychology. Markets frequently react predictably at these levels due to widespread recognition and use by traders worldwide. This universal acknowledgment creates a self-fulfilling dynamic, increasing the reliability of Fibonacci retracement levels as key reference points for trading decisions.
Discipline & Risk Management in Swing Trading Strategies
Discipline is essential in the execution of a successful trading plan. The relatively short-term nature of swing trading strategies further emphasises the need to maintain a well-defined trading plan – with clear entry and exit strategies. Proper planning will help you to stay focused and minimise emotion-driven decisions. The potential profit or loss also depends on the volatility of the assets in question, which is why utilising Risk-to-Reward Ratios (R/R ratio) and stop-loss orders will really help to protect your capital and ensure a balanced approach risk management.
Example: Suppose a trader identifies a potential swing trade in Gold (XAU/USD), aiming for a profit target of $1,200 while risking a maximum loss of $300, resulting in a favorable Risk-to-Reward Ratio (RRR) of 1:4. By placing a stop-loss order accordingly, traders protect their capital from significant adverse market moves.
Why It Works: Effective risk management and discipline allow traders to maintain trading longevity and profitability. A structured approach mitigates emotional trading decisions and helps preserve capital during inevitable market downturns. Implementing clear risk-to-reward parameters ensures that potential losses are contained, enabling consistent profitability and sustainable trading practices over the long term.
R/R Ratio Illustration
Imagine that you are considering a trade where you could potentially make $2,000. However, you also recognise that the trade could go badly and you might lose $500 if it does not pan out.
- Risk (Loss potential): $500
- Reward (Profit potential): $2,000
- R/R Ratio: 1:4 (risking $1 to potentially gain $4)
In this scenario, the R/R ratio is under 1. This indicated that the reward outweighs the risk, thus making the trade relatively attractive. Conversely, if the ratio were less favourable, such as 1:1 or 2:1, you will be risking more for less reward, which will be less appealing.
Incorporating a R/R ratio in your strategy can help you to make more informed decisions and better manage downside risks. It’s also wise to pair your swing trading strategy together with stop-loss orders to automatically exit trades at a predetermined level to protect your capital.
It is also a good idea to track your trades using a trading journal to help you stay focused and work out your profits. By recording your strategies, outcomes, and insights, whether it is through traditional pen and paper or more dedicated notes or spreadsheets, having a journal can help you to refine your trading approach and improve your performance over time.
Conclusion: Is Swing Trading Profitable?
Swing trading offers a versatile and tailored approach to capturing short-term market momentum. By developing a thorough swing trading plan and mastering the tools and techniques covered in this guide, you will be well equipped to develop a swing trading approach that best suits your style and financial goals.
With a disciplined approach tailored to your trading goals, you can now see how to develop a swing trading plan that best fits your style. The best swing trading strategies can be highly effective with different types of assets and tools involved.
As with all types of investing and trading, a commitment to continuous learning, research, and experimentation are the keys to long-term success. By staying informed and committed on your trading journey, you can unlock the potential of swing trading and work towards achieving your financial ambitions.
Our team is here to guide you through every step of the way. Whether you’re new to trading, or looking to expand your portfolio, we provide the support and expertise you need to succeed and thrive.
Remember: Trading CFDs involves risks—learn how margin trading works and implement proper safeguards—so with the right strategies and mindset, trading can be a rewarding experience.
Ready to Get Started?
Sign up now and gain access to global markets in under 3 minutes.
Start Trading, or Try our Demo Account