

Trading
Explore a wide range of markets with competitive pricing, deep liquidity, and advanced trading tools.
Learn More 
Platform
Trade seamlessly with TMGM's powerful platform, built for speed, precision, and a superior trading experience.
Learn More Trading Platform
Academy
Learn the fundamentals of trading with beginner-friendly resources, including guides, webinars, and market insights.
Learn More News & Analysis
Get real-time market updates and expert analysis to stay ahead of trading opportunities
Learn More News & Analysis
About
Learn what sets TMGM apart — our global presence, regulatory strength, and commitment to innovation in trading.
Learn More Why Choose TMGM
Sponsorship
Meme Coins Price Prediction: Floor Still Eludes Dogecoin, Shiba Inu and Pepe
- $0.0675 is Dogecoin’s approximate level on Thursday. Losses have extended into a seventh consecutive week, taking the coin to a three-year low.
- With downward momentum easing, Shiba Inu trades just above a critical horizontal support level.
- Following the previous day’s 16% fall, Pepe pauses as attention turns to a rising support trendline.
$75,000 gave way for Bitcoin (BTC) this week. Strong US inflation reports drove the decline, compounding last week’s uncertainty about tighter regulation following the Democrats’ midterm victory. Against this risk-off backdrop across cryptocurrencies, sellers continue to target meme coins, including Dogecoin (DOGE), Shiba Inu (SHIB), and Pepe (PEPE).

During past bear market cycles, Bitcoin declines have often triggered steeper retreats in Dogecoin and other meme coins. PEPE, however, has demonstrated longer-term resilience: its year-to-date (YTD) loss is just 7%, compared with declines of over 40% for DOGE and SHIB.
Macroeconomic concerns continue to weigh on Bitcoin, leaving meme coins exposed to further losses. As selling pressure intensifies, the technical picture for DOGE, SHIB, and PEPE puts key support zones in the spotlight.
$0.0651 support in focus: Dogecoin’s falling-knife slide signals further downside risk
A seventh consecutive weekly decline has pushed Dogecoin to a three-year low, reinforcing its bearish trend. Both the 50-day and 200-day Exponential Moving Averages (EMAs), at $0.0785 and $0.0885 respectively, remain well above the meme coin’s price.
Below-zero readings in the Moving Average Convergence Divergence (MACD) point to continued bearish momentum. Meanwhile, the Relative Strength Index (RSI) is near 30, signalling persistent selling pressure and early indications that oversold conditions are approaching.
Applied to the mid-September advance from $0.0784 to $0.1058, the Fibonacci retracement places immediate support at the 161.8% extension of $0.0651, which the price is approaching. A confirmed break beneath this area could bring the 200% level at $0.0580 into play, implying downside risk of more than 10%.
Any recovery would first face resistance around the 100% Fibonacci retracement at $0.0784 and the 50-day EMA at $0.0785. Above that cluster, the 200-day EMA at $0.0885 presents the next barrier.
$0.00000432 support under threat: Shiba Inu’s bearish technical picture
$0.00000436 is Shiba Inu’s approximate trading level on Thursday. The meme coin is steadying after the previous day’s 2% fall, but its six-week downtrend has produced a cumulative loss of over 25%.
On the daily chart, downward pressure is levelling off. The MACD and its signal line are converging below zero as the negative profile diminishes, while the RSI remains sideways at 34, just above oversold territory.
Measuring the mid-September rise from $0.00000474 to $0.00000627, the Fibonacci retracement identifies $0.00000432, the 127.2% retracement, as immediate support. This level stands ahead of the 161.8% extension at $0.00000379.
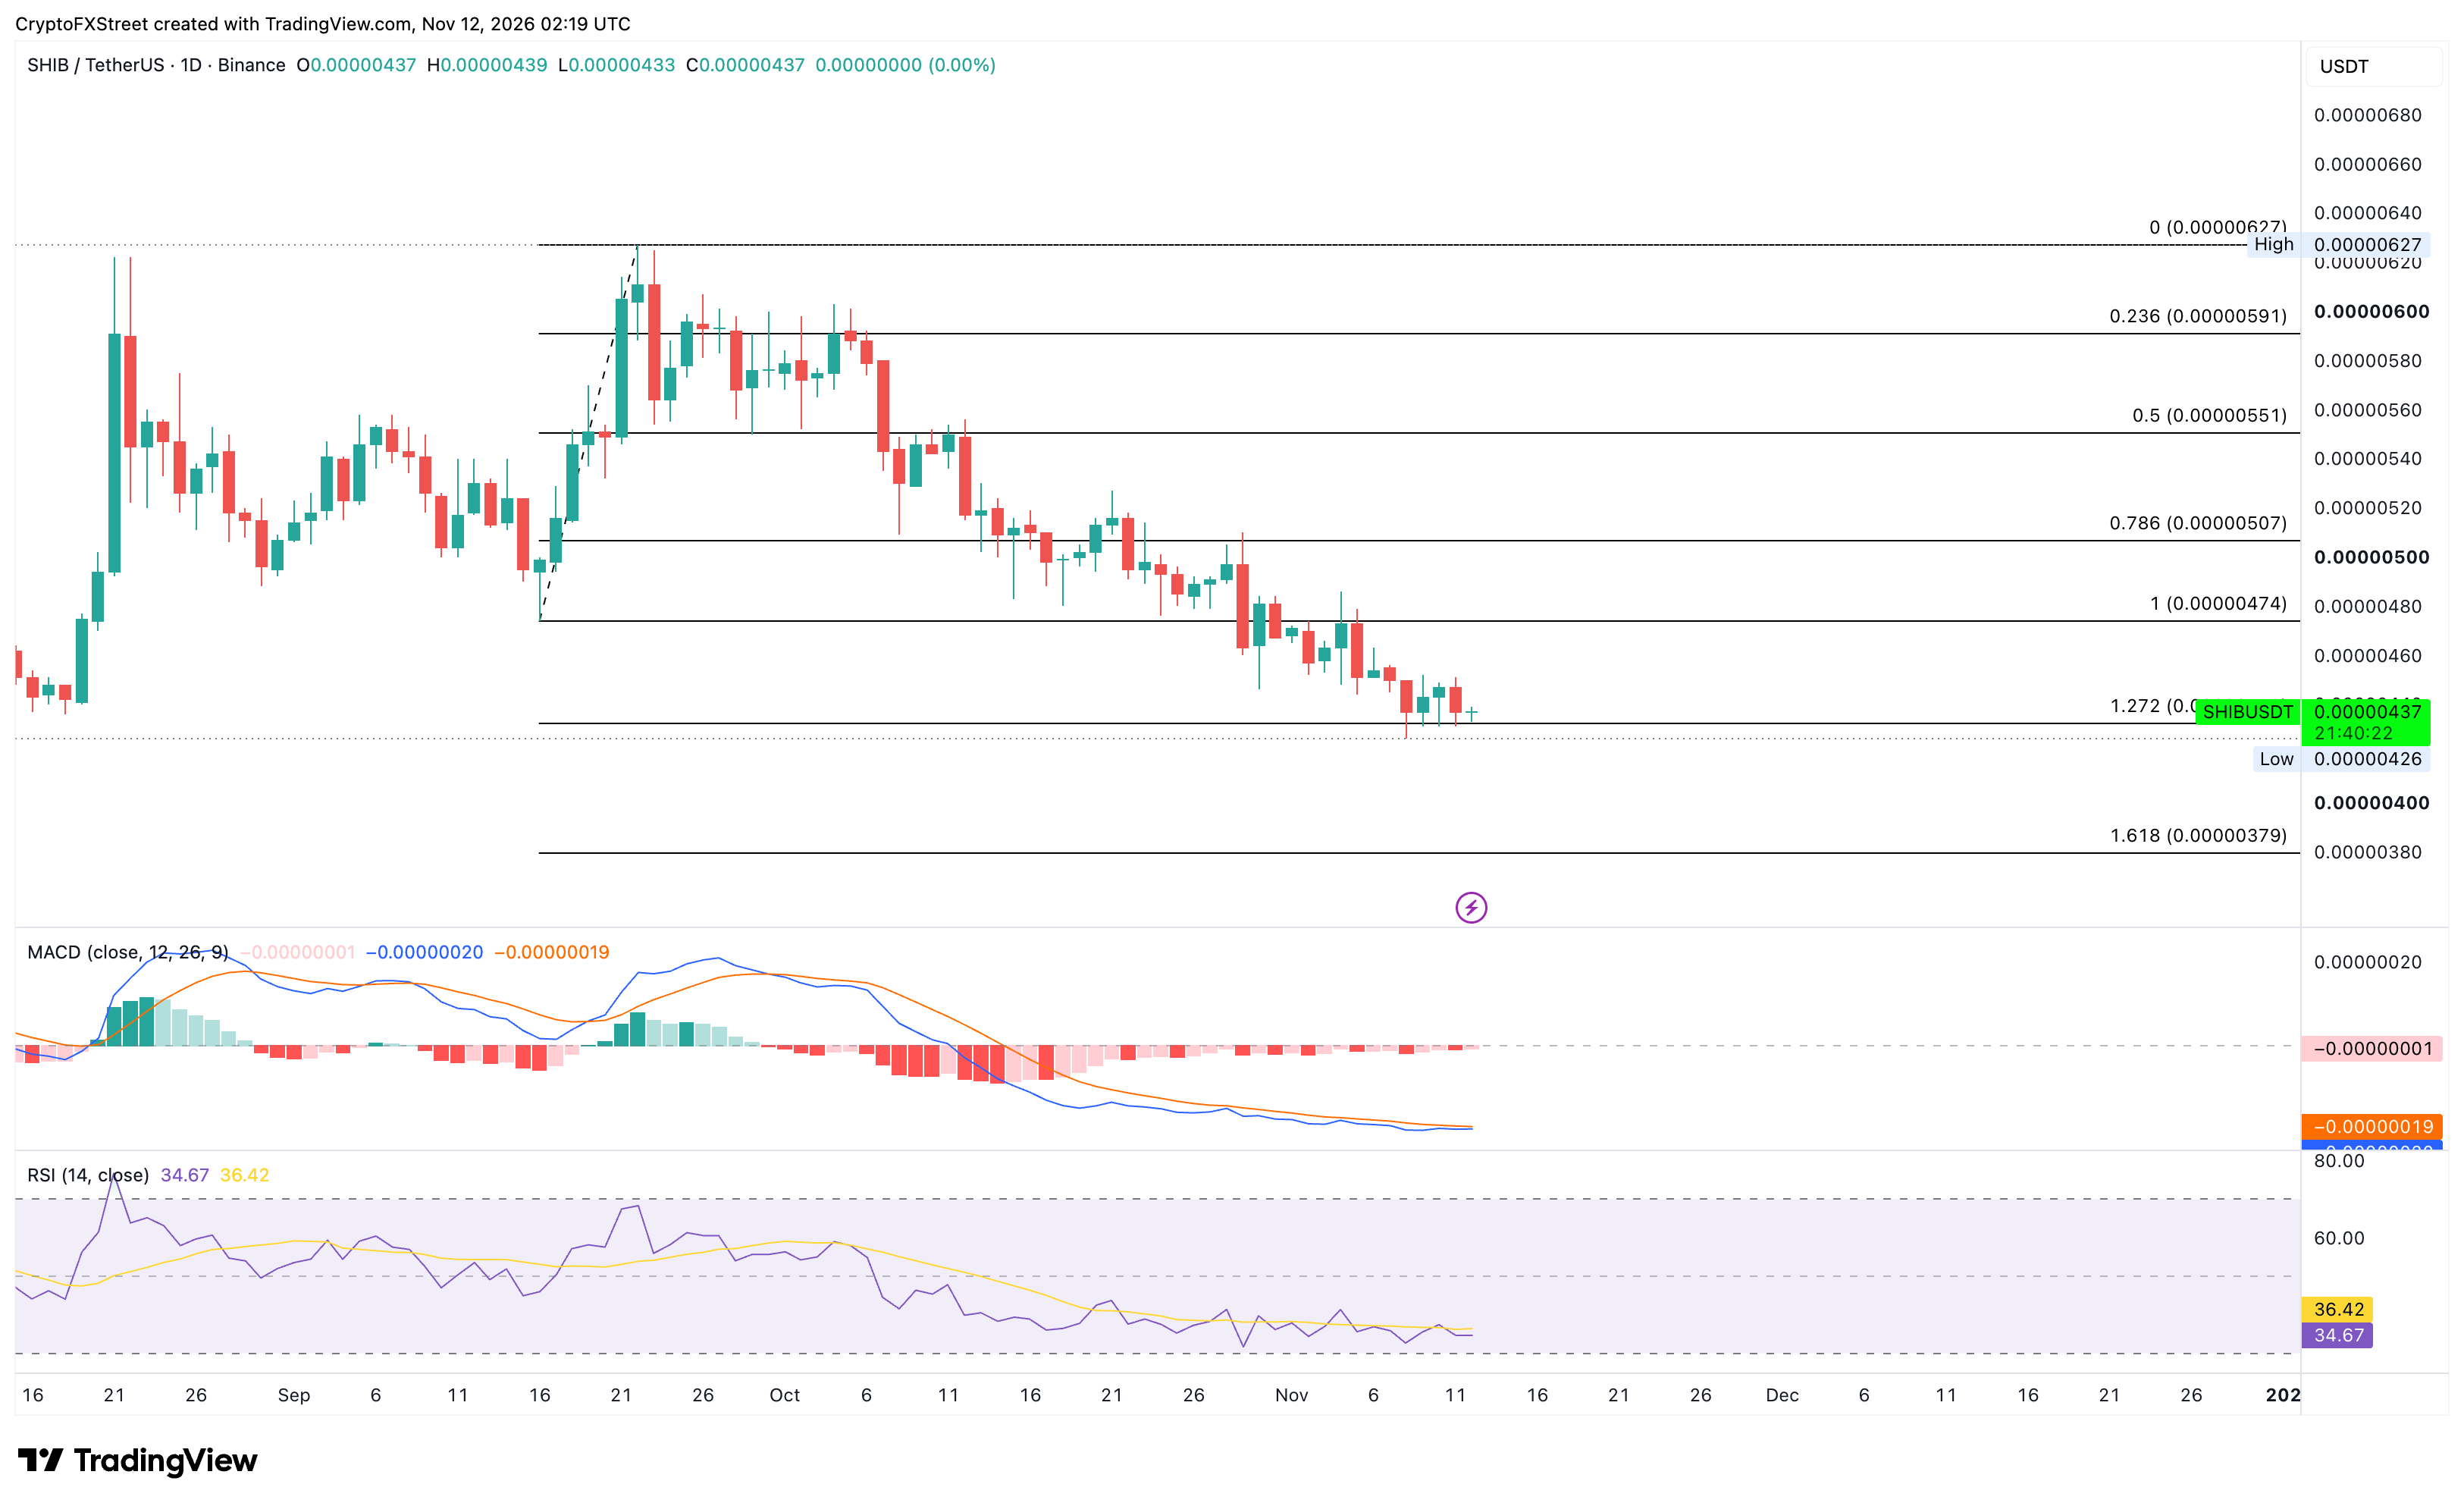
If Shiba Inu rebounds, $0.00000474 could be its first target. A break above that threshold could clear the way towards the psychological $0.00000500 level.
16% pullback turns Pepe’s technical momentum bearish
$0.00000460 was PEPE’s approximate price as it steadied following the previous day’s 16% drop. The retreat is nearing rising trendline support around $0.00000425, linking the lows of 11 September and 8 October. Horizontal support at $0.00000423, defined by the 21 August high, reinforces this area.
Wednesday’s 16% fall shifted momentum in favour of sellers. The MACD moved beneath its signal line, while the RSI slipped through its midpoint to 47.
For the frog-themed meme coin, the easier path appears to be lower towards the $0.0000043 support zone. A confirmed break beneath it would overturn the uptrend underpinned by the rising trendline and expose $0.00000364, the low recorded on 8 October.
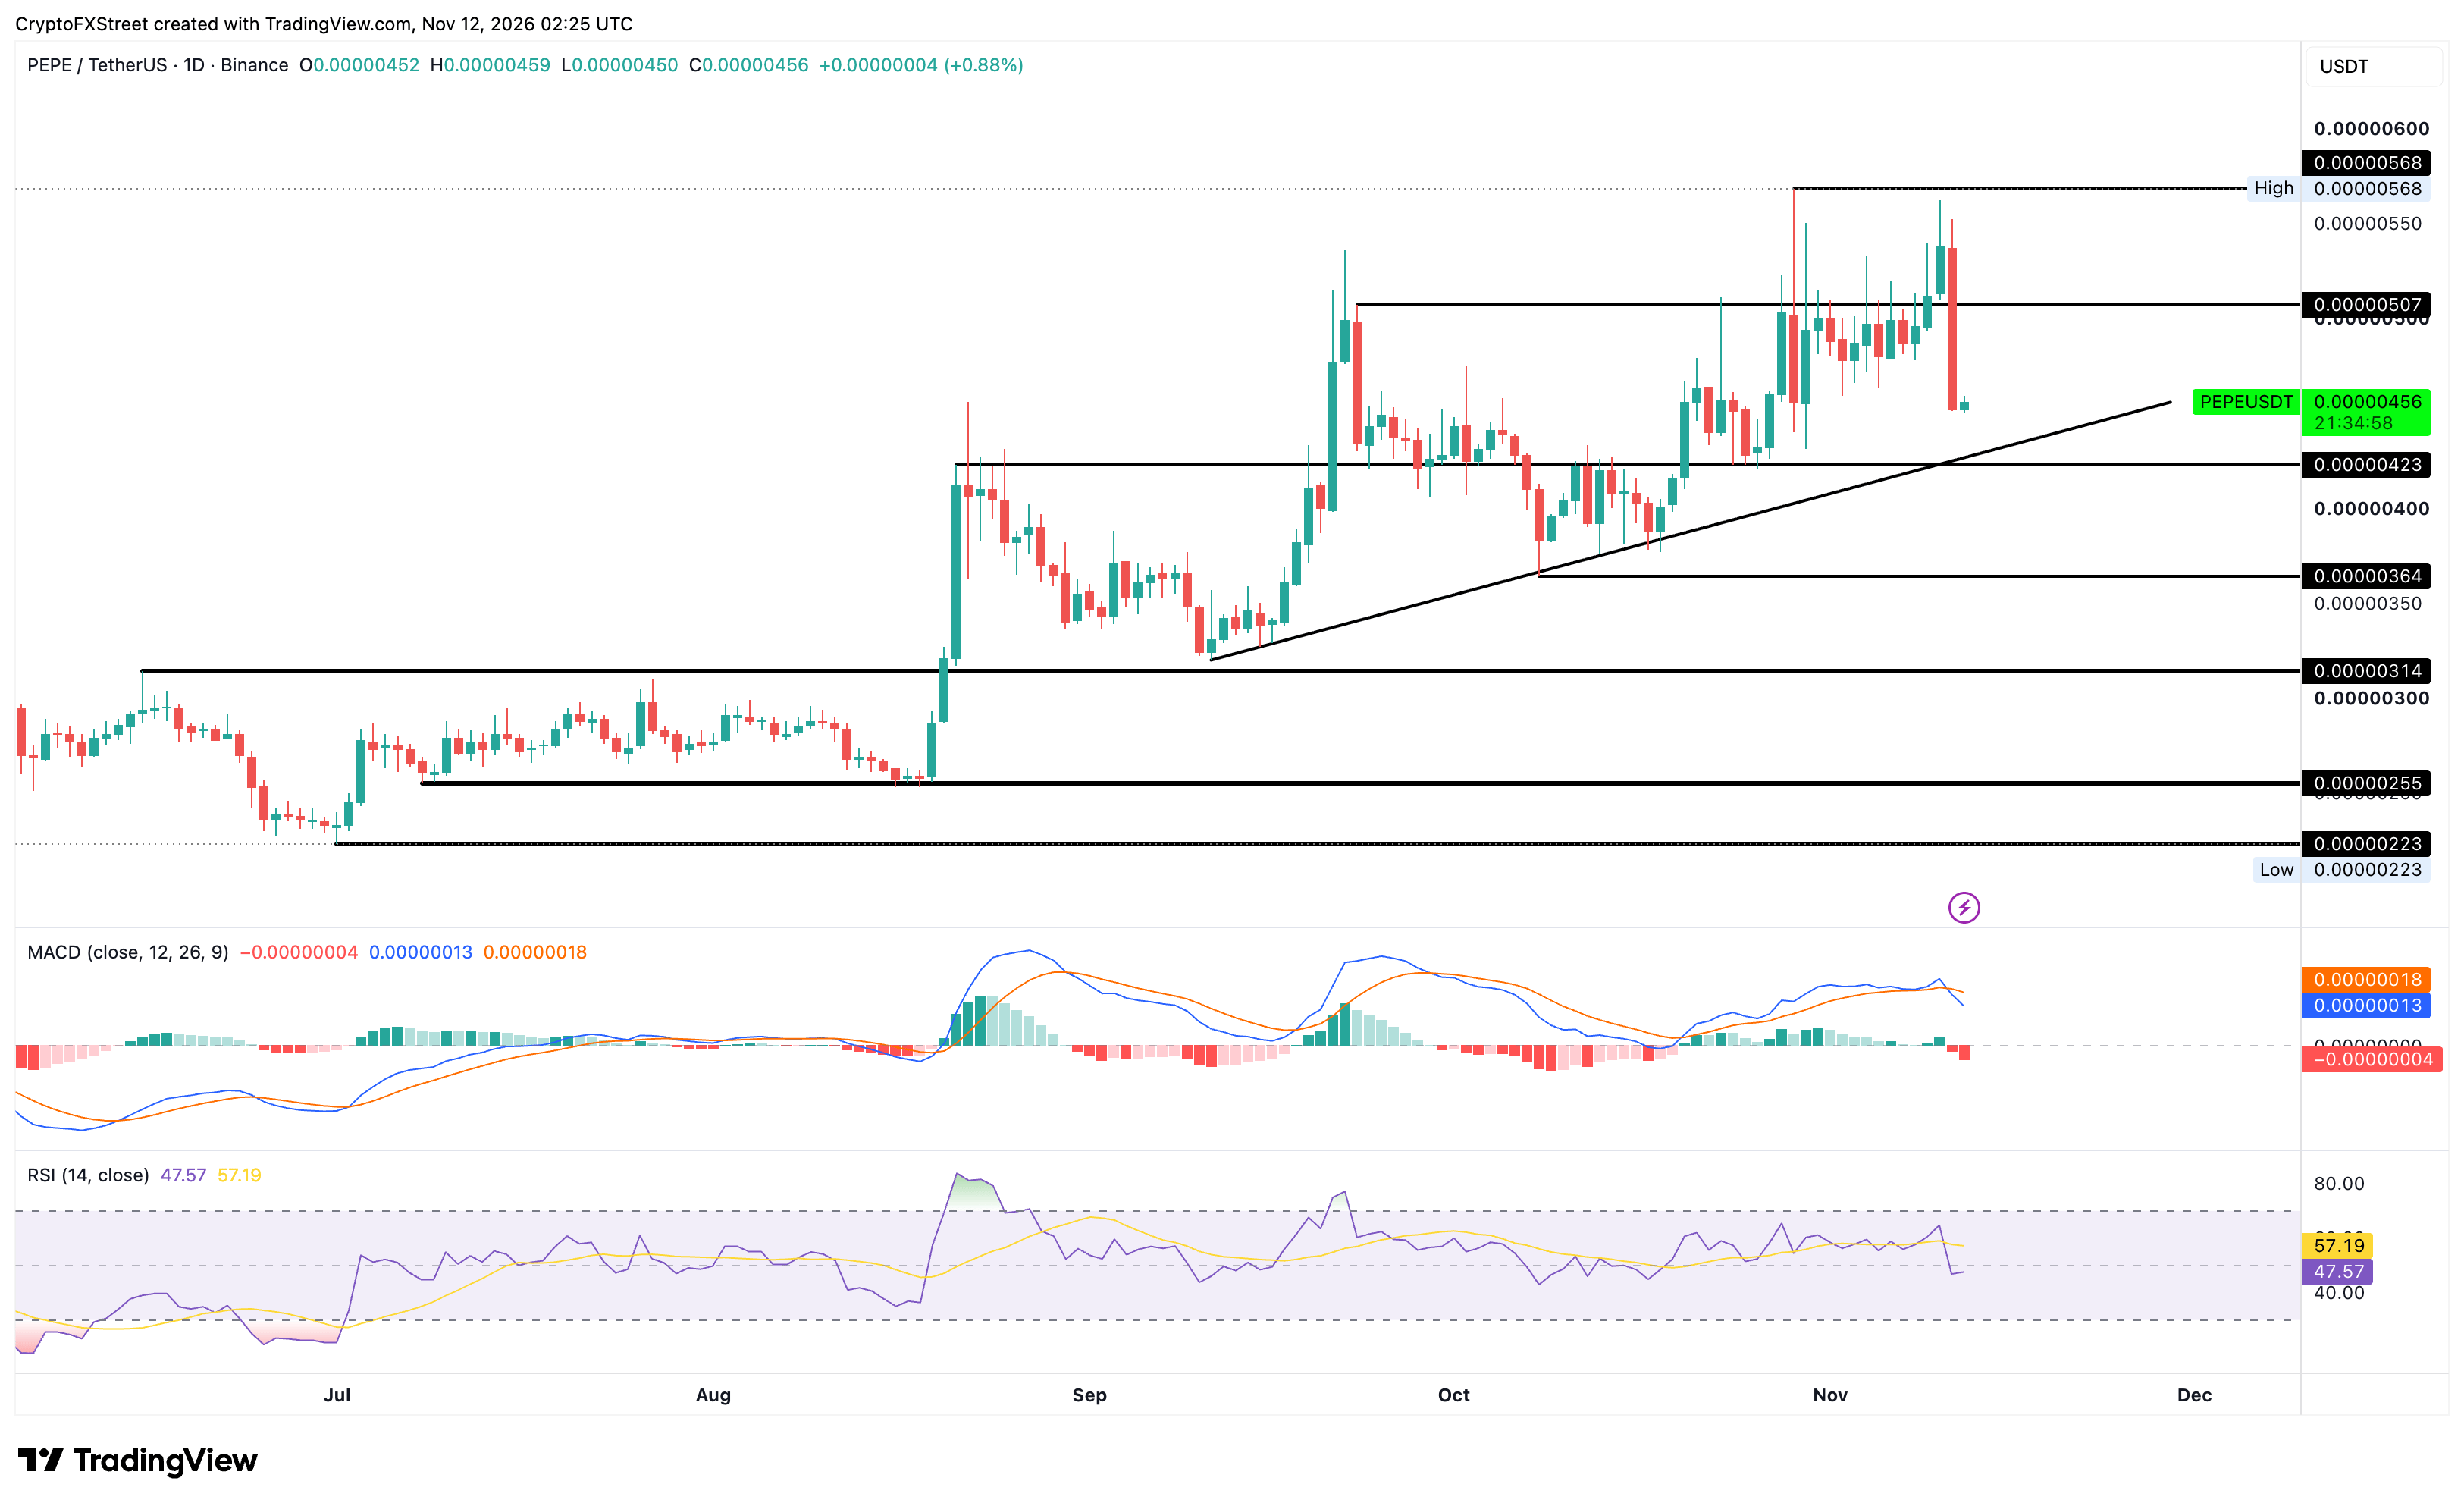
To sustain a further extension of its upward trend, Pepe needs to recover the psychological $0.00000500 level and then surpass the 29 October high of $0.00000568.
(An AI tool assisted in preparing this story’s technical analysis. Learn more.)
POPULAR ARTICLES
1Above $51.00: Silver Price Forecast as XAG/USD tests trading range support2Below $4,000: Gold under pressure as Fed hike bets and Mideast risks drive USD to new YTD high3Record lows for Indonesian Rupiah as MSCI index concerns and political uncertainty weigh4India Gold price today: FXStreet data points to lower prices5Below 109.50: AUD/JPY Price Forecast remains bearish beneath the 100-day SMA as pair weakens6Strategy removed from MSCI indexes: Implications for Bitcoin7Meme Coins Price Prediction: Floor Still Eludes Dogecoin, Shiba Inu and Pepe8177.00 gives way: EUR/JPY price forecast as pair slips near nine-day EMA9Ripple and Stellar outlook: XRP consolidates after losses as XLM recovery gains ground


Get Started!
Sign up and access the Global Markets in less than 3 minutes

Connect With Us












The information provided on this website is of a general nature only and does not constitute personal financial advice. Before acting on any information on this website, you should consider the suitability of the information in relation to your objectives, financial situation and needs. Investing in CFDs and FX Margin Contracts carries significant risks and is not suitable for all investors. You may lose more than your initial deposit. You do not own, or have, any interest in the underlying asset. We recommend that you seek independent advice and ensure you fully understand the risks involved before trading. It is important that you read and consider the disclosure document before you acquire any product listed on the website. The information and advertisements offered on this website are not intended for use by any person in any country or jurisdiction where such use would be contrary to local laws and regulations. The Products and Services offered on this website are not intended for residents of the United States, Malaysia and Thailand.
TMGM is authorized and regulated in various jurisdictions.
Trademax Australia Limited, trading as TMGM, is regulated by the Australian Securities and Investments Commission (ASIC), AFSL no. 436416 and is located at Level 28, One International Tower, 100 Barangaroo Avenue, 2000 Sydney, NSW Australia.
Email: support@tmgm.com.au
Trademax Global Limited, trading as TMGM, is authorized and regulated by the Vanuatu Financial Services Commission (VFSC), registration number 40356 and registered at 1276, Kumul Highway, Port Vila, Vanuatu, Republic of Vanuatu.
Email: support@tmgm.com
Trademax Global Markets (SE) Limited, trading as TMGM, is authorized and regulated by the Financial Services Authority (FSA) of Seychelles, with license number SD224. The company is registered at Office No 13, Providence Estate ABIS Centre, Mahe, Seychelles.
Email: support@tmgm.com
Trademax Global Markets (International) Pty Ltd, trading as TMGM, is authorized and regulated by the Financial Services Commission, Mauritius (FSC) with license no. GB22201012, and registered at 33, Edith Cavell Street C/o IQ EQ Fund Services (Mauritius) Ltd Port Louis, 11324 Mauritius.
Email: support@tmgm.com
Copyright © TMGM. All rights reserved