

Trading
Explore a wide range of markets with competitive pricing, deep liquidity, and advanced trading tools.
Learn More 
Platform
Trade seamlessly with TMGM's powerful platform, built for speed, precision, and a superior trading experience.
Learn More Trading Platform
Academy
Learn the fundamentals of trading with beginner-friendly resources, including guides, webinars, and market insights.
Learn More News & Analysis
Get real-time market updates and expert analysis to stay ahead of trading opportunities
Learn More News & Analysis
About
Learn what sets TMGM apart — our global presence, regulatory strength, and commitment to innovation in trading.
Learn More Why Choose TMGM
Sponsorship
3 Top Price Predictions: Bitcoin, Ethereum, Ripple – downside momentum drives further losses in BTC, ETH and XRP
- Nearly 6% has been wiped off Bitcoin this week. Losses deepen as it falls below the $70,000 psychological threshold on Friday.
- Below $2,000, Ethereum faces mounting selling pressure.
- With sellers retaining control, XRP’s correction deepens towards the next key area around $1.
$70,000 has given way for BTC. Friday’s sell-off gathers pace across Bitcoin (BTC), Ethereum (ETH) and Ripple (XRP) as bearish momentum strengthens. Alongside BTC’s break below that psychological threshold, ETH’s loss of $2,000 support increases the risk of additional declines. Sellers also retain the upper hand in XRP, whose continued retreat threatens a deeper correction towards $1.00.

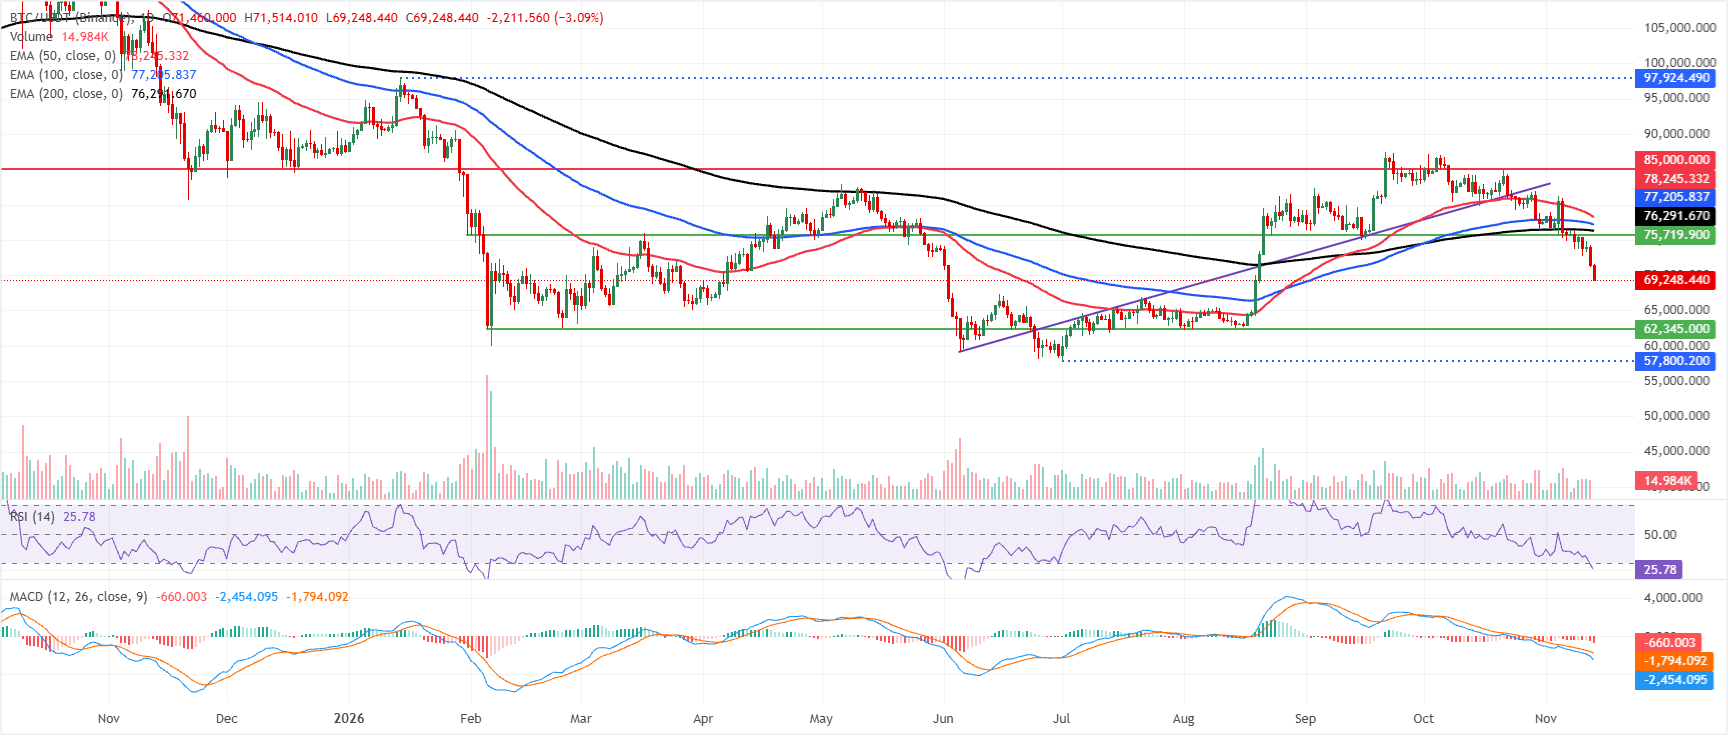
$69,195 Bitcoin faces risk of deeper correction
At $69,195 on Friday, Bitcoin is extending its retreat well beneath the key Exponential Moving Averages (EMAs). Overhead resistance comprises the 200-day EMA at $76,291, the 100-day EMA at $77,205 and the 50-day EMA at $78,245. As BTC moves further away from its previous consolidation range, these averages reinforce the bearish near-term outlook.
An RSI reading of 25 places the Relative Strength Index in oversold territory. The Moving Average Convergence Divergence (MACD), meanwhile, is still deeply negative. Downside momentum therefore remains strong, although stretched conditions could produce short-term rebounds.
Any recovery would first encounter the 200-day EMA near $76,291. Beyond it, the 100-day EMA at $77,205 and the 50-day EMA at $78,245 complete a concentrated supply zone likely to limit rebound attempts. Should the pair stage a stronger recovery, sellers could regain control at the higher horizontal resistance of $85,000.
The current dataset shows no significant support close to prevailing prices. Traders may therefore monitor intraday price movements and previous swing lows for signs of potential stabilisation. The broader technical structure nevertheless retains a downside bias while BTC remains below these major EMAs.
$2,000 support gives way for Ethereum
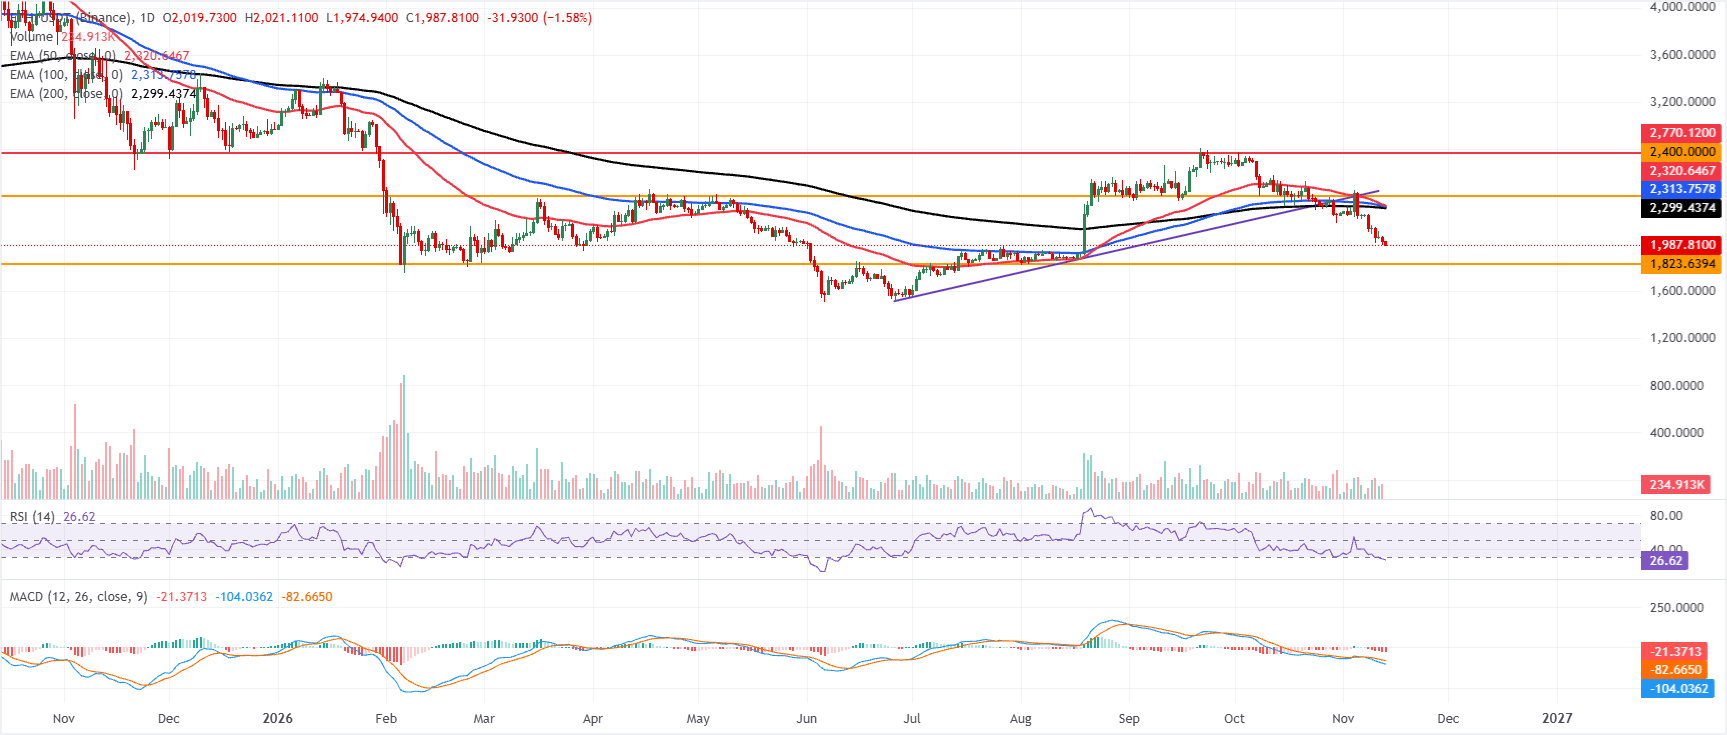
At $1,987 on Friday, Ethereum remains in a bearish phase, trading well below the 50-day, 100-day and 200-day EMAs grouped between roughly $2,299 and $2,320. That overhead cluster continues to constrain the pair following its break below the previous rising support line. The trendline break area near $2,459 now represents a more distant obstacle.
Oversold conditions have yet to ease the weak momentum picture. The RSI stands at about 26, while the MACD remains negative and below zero. Together, they signal continued downside pressure despite signs that short-term selling is stretched.
The nearest structural demand lies at horizontal support near $1,823. If the price reaches that level, buyers could try to arrest the decline.
A rebound would initially face the 200-day EMA around $2,299, then the 100-day EMA at $2,313 and the 50-day EMA at $2,320. This cluster forms a substantial ceiling before the psychological $2,400 mark. Further resistance lies around $2,459, where the ascending trendline was broken, followed by the higher horizontal barrier near $2,770. Reclaiming these zones would be necessary to restore a more constructive medium-term outlook.
$1 psychological threshold comes into focus for XRP
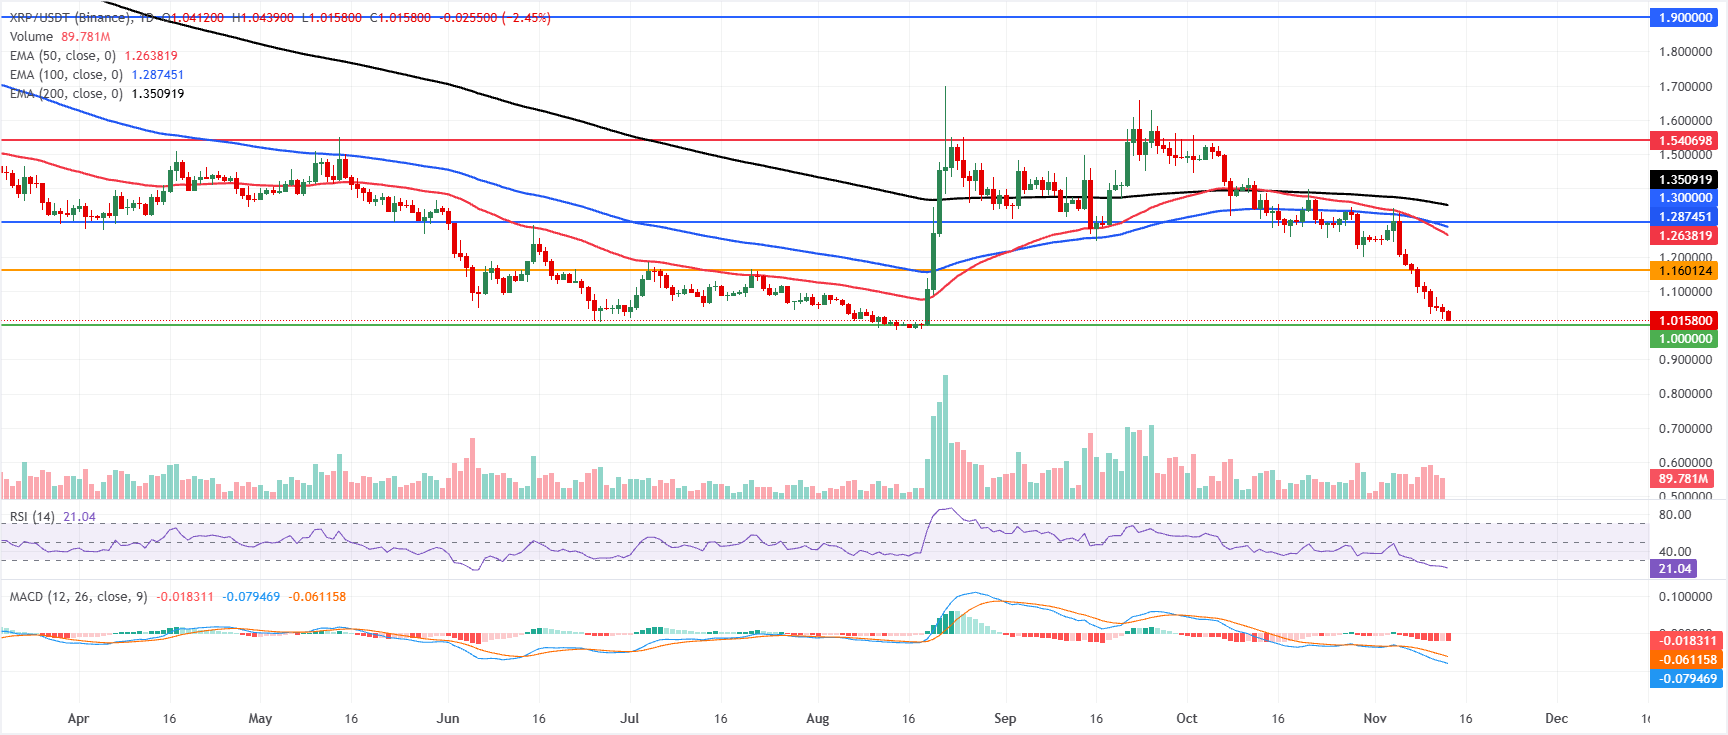
At $1.015 on Friday, XRP continues to show a bearish near-term bias. It trades firmly beneath the 50-day EMA at $1.263, the 100-day EMA at $1.287 and the 200-day EMA at $1.350. With the MACD below zero and the RSI around 21 in oversold territory, downside pressure persists even though the sell-off appears stretched.
A recovery would first meet resistance at $1.160, followed by the more significant $1.300 barrier. The longer-term EMAs clustered around $1.287–$1.350 strengthen the wider supply zone, ahead of higher resistance at $1.540 and $1.900.
The horizontal floor at $1.000 provides immediate downside support. A clear break beneath it would open the way to fresh lows. Holding above it, however, could permit a corrective rebound towards the resistance levels outlined above.
(The technical analysis of this story was written with the help of an AI tool. Know more.)
Cryptocurrency prices: frequently asked questions
Demand and adoption among market participants are influenced by token launches. When an asset is listed on a crypto exchange, its liquidity deepens and new participants join its network. For a digital asset, this is generally a bullish development.
Through exploits, bugs or other methods, an attacker can seize a large quantity of an asset from a DeFi bridge or the hot wallet of an exchange or another crypto platform. This constitutes a hack. The attacker then moves the tokens off exchange platforms, ultimately selling them or exchanging them for other cryptocurrencies or stablecoins. Such incidents often spark widespread panic and a sell-off in the affected assets.
The US Dollar is the main channel through which macroeconomic events, such as the US Federal Reserve’s interest rate decisions, affect crypto assets. Higher interest rates typically weigh on Bitcoin and altcoin prices, while lower rates generally have the opposite effect. A decline in the US Dollar index makes risk assets and the associated trading leverage cheaper, in turn lifting cryptocurrency prices.
By cutting miners’ block rewards in half, halvings restrict the asset’s supply and are therefore generally viewed as bullish events. With demand unchanged, a reduction in supply pushes the asset’s price higher.
POPULAR ARTICLES
1176.50 Cleared: EUR/JPY Strengthens, but Price Forecast Remains Bearish Below 100-day SMA2India Gold price today: FXStreet data show higher prices3Above 10.300: US Dollar Index (DXY) holds near April 2025 highs amid Fed bets and Iran risks4US early-warning radar in Bahrain targeted and destroyed, Iran's IRGC says5Asian stocks deliver mixed performance as Nvidia leadership turmoil and Anthropic IPO speculation unfold6$3,900 reclaimed: Gold rebounds from YTD low; Fed hike bets and USD strength to limit gains73 Top Price Predictions: Bitcoin, Ethereum, Ripple – downside momentum drives further losses in BTC, ETH and XRP8Near $50.50: Silver Price Forecast as XAG/USD Gains Despite Fed Rate Hike Bets9$18B open interest milestone: Hyperliquid gains ground on centralised exchanges


Get Started!
Sign up and access the Global Markets in less than 3 minutes

Connect With Us












The information provided on this website is of a general nature only and does not constitute personal financial advice. Before acting on any information on this website, you should consider the suitability of the information in relation to your objectives, financial situation and needs. Investing in CFDs and FX Margin Contracts carries significant risks and is not suitable for all investors. You may lose more than your initial deposit. You do not own, or have, any interest in the underlying asset. We recommend that you seek independent advice and ensure you fully understand the risks involved before trading. It is important that you read and consider the disclosure document before you acquire any product listed on the website. The information and advertisements offered on this website are not intended for use by any person in any country or jurisdiction where such use would be contrary to local laws and regulations. The Products and Services offered on this website are not intended for residents of the United States, Malaysia and Thailand.
TMGM is authorized and regulated in various jurisdictions.
Trademax Australia Limited, trading as TMGM, is regulated by the Australian Securities and Investments Commission (ASIC), AFSL no. 436416 and is located at Level 28, One International Tower, 100 Barangaroo Avenue, 2000 Sydney, NSW Australia.
Email: support@tmgm.com.au
Trademax Global Limited, trading as TMGM, is authorized and regulated by the Vanuatu Financial Services Commission (VFSC), registration number 40356 and registered at 1276, Kumul Highway, Port Vila, Vanuatu, Republic of Vanuatu.
Email: support@tmgm.com
Trademax Global Markets (SE) Limited, trading as TMGM, is authorized and regulated by the Financial Services Authority (FSA) of Seychelles, with license number SD224. The company is registered at Office No 13, Providence Estate ABIS Centre, Mahe, Seychelles.
Email: support@tmgm.com
Trademax Global Markets (International) Pty Ltd, trading as TMGM, is authorized and regulated by the Financial Services Commission, Mauritius (FSC) with license no. GB22201012, and registered at 33, Edith Cavell Street C/o IQ EQ Fund Services (Mauritius) Ltd Port Louis, 11324 Mauritius.
Email: support@tmgm.com
Copyright © TMGM. All rights reserved