

Trading
Explore a wide range of markets with competitive pricing, deep liquidity, and advanced trading tools.
Learn More 
Platform
Trade seamlessly with TMGM's powerful platform, built for speed, precision, and a superior trading experience.
Learn More Trading Platform
Academy
Learn the fundamentals of trading with beginner-friendly resources, including guides, webinars, and market insights.
Learn More News & Analysis
Get real-time market updates and expert analysis to stay ahead of trading opportunities
Learn More News & Analysis
About
Learn what sets TMGM apart — our global presence, regulatory strength, and commitment to innovation in trading.
Learn More Why Choose TMGM
Sponsorship
Zcash Price Forecast: ETF selling slows ZEC recovery
- Two days of losses give way to a modest rise in Zcash on Monday, with the price still consolidating within its range.
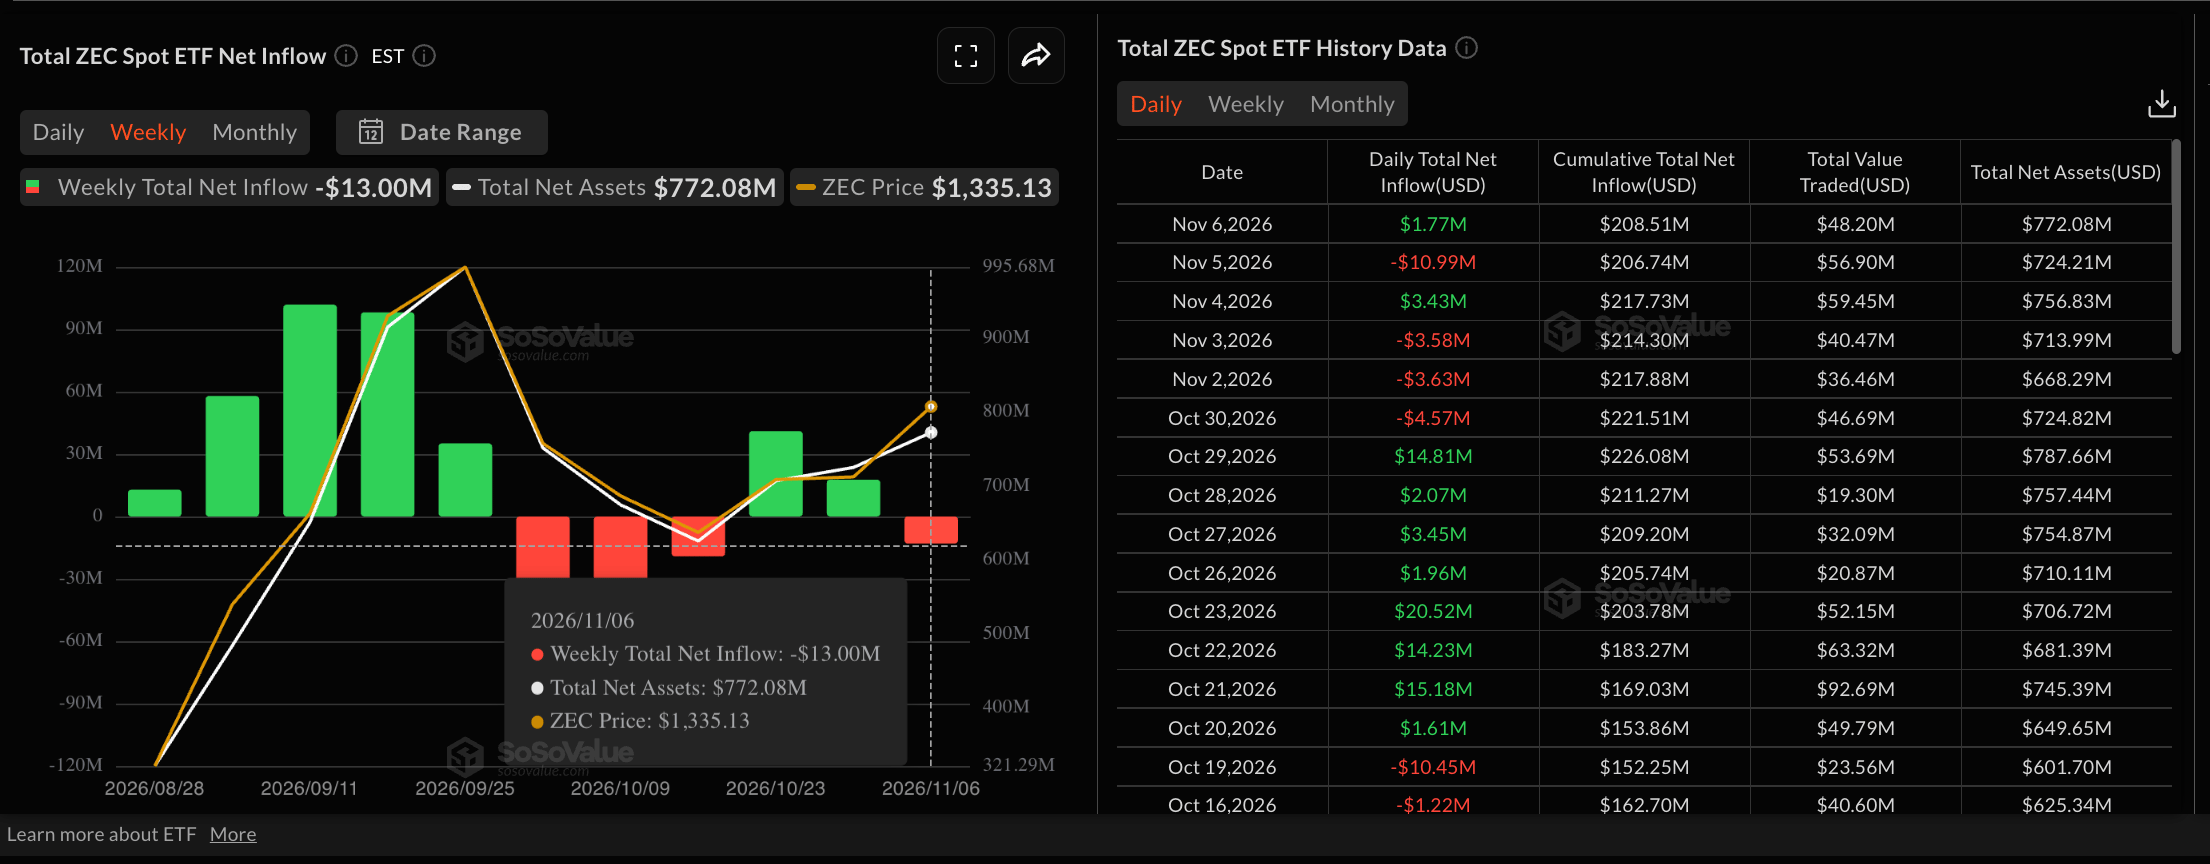
- $13 million flowed out of ZEC ETFs last week. That followed a $17 million inflow the week before, pointing to mixed investor sentiment.
- $1,112 and $1,340 mark the boundaries of Zcash’s consolidation range, leaving its technical outlook mixed.
$13 million in institutional outflows was recorded for Zcash (ZEC). Retail interest in the privacy coin also remains mixed, although buyers return on Monday, lifting the price modestly after two consecutive days of declines. With Zcash still consolidating between $1,112 and $1,340, the technical picture points to fading momentum.

NU7: ZEC fails to rally as ETF withdrawals continue
Friday’s mainnet launch of Zcash’s Network Upgrade 7 (NU7) cut block confirmation time to 25 seconds from 75 seconds. Buyers have nevertheless remained on the sidelines. The price failed to clear the $1,340 resistance on Friday, setting up two successive days of declines.
Looking back, last week’s $13 million in outflows reflects institutional reluctance that has overshadowed the upgrade. Further withdrawals from ZEC-focused exchange-traded funds (ETFs) could increase downside risk.
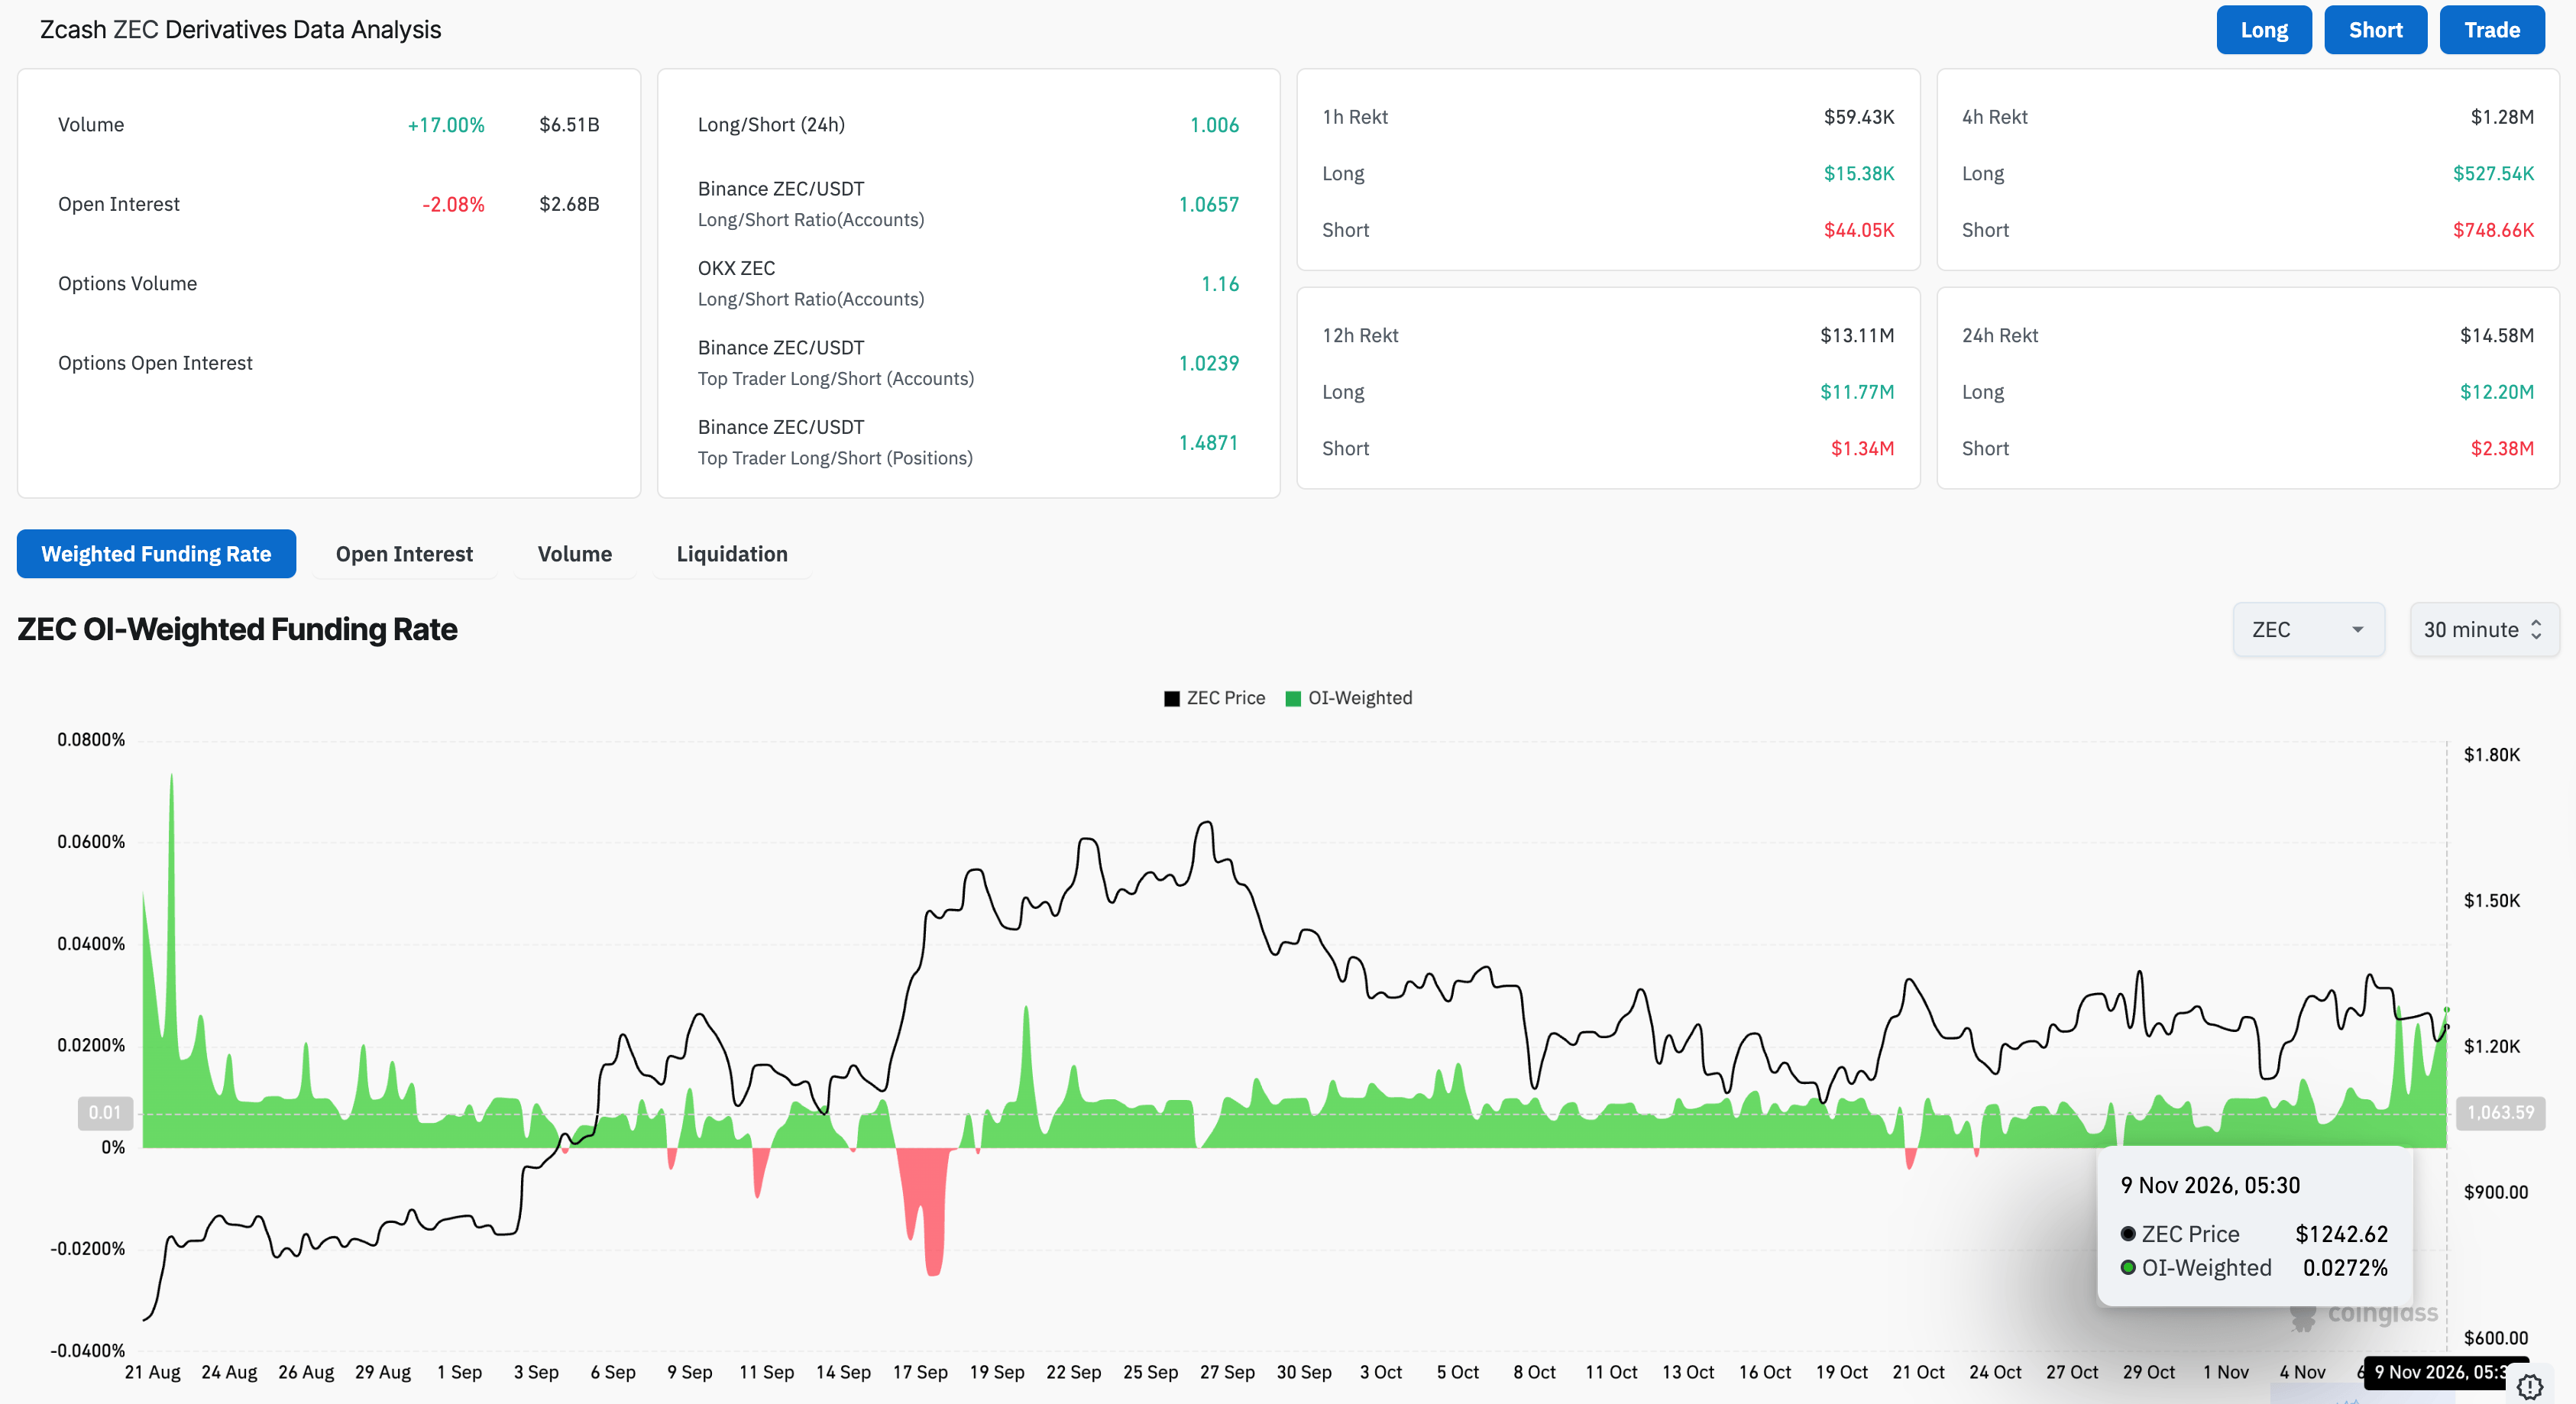
Retail derivatives positioning presents a mixed picture. Over the last 24 hours, ZEC futures open interest (OI) has fallen 2% to $2.68 billion, signalling an unwinding of active contracts. Meanwhile, the funding rate has climbed to 0.0272%, suggesting traders are rebuilding long positions in anticipation of a possible rebound.
$1,340 resistance holds the key to Zcash’s bullish outlook
$1,240 is Zcash’s price at the time of writing on Monday. The coin is testing its 50-day exponential moving average (EMA) at $1,219, substantially above the longer-term 200-day EMA at $876. Together, these averages suggest a supportive near-term structure.
Momentum remains steady and neutral, with the Relative Strength Index (RSI) sitting just under 50. At the same time, the Moving Average Convergence Divergence (MACD) and its signal line are converging around the zero line.
A return to a bullish trend requires Zcash to retake $1,340, the resistance established at the October high. Clearing that level could open the way to the 26 September high of $1,698.
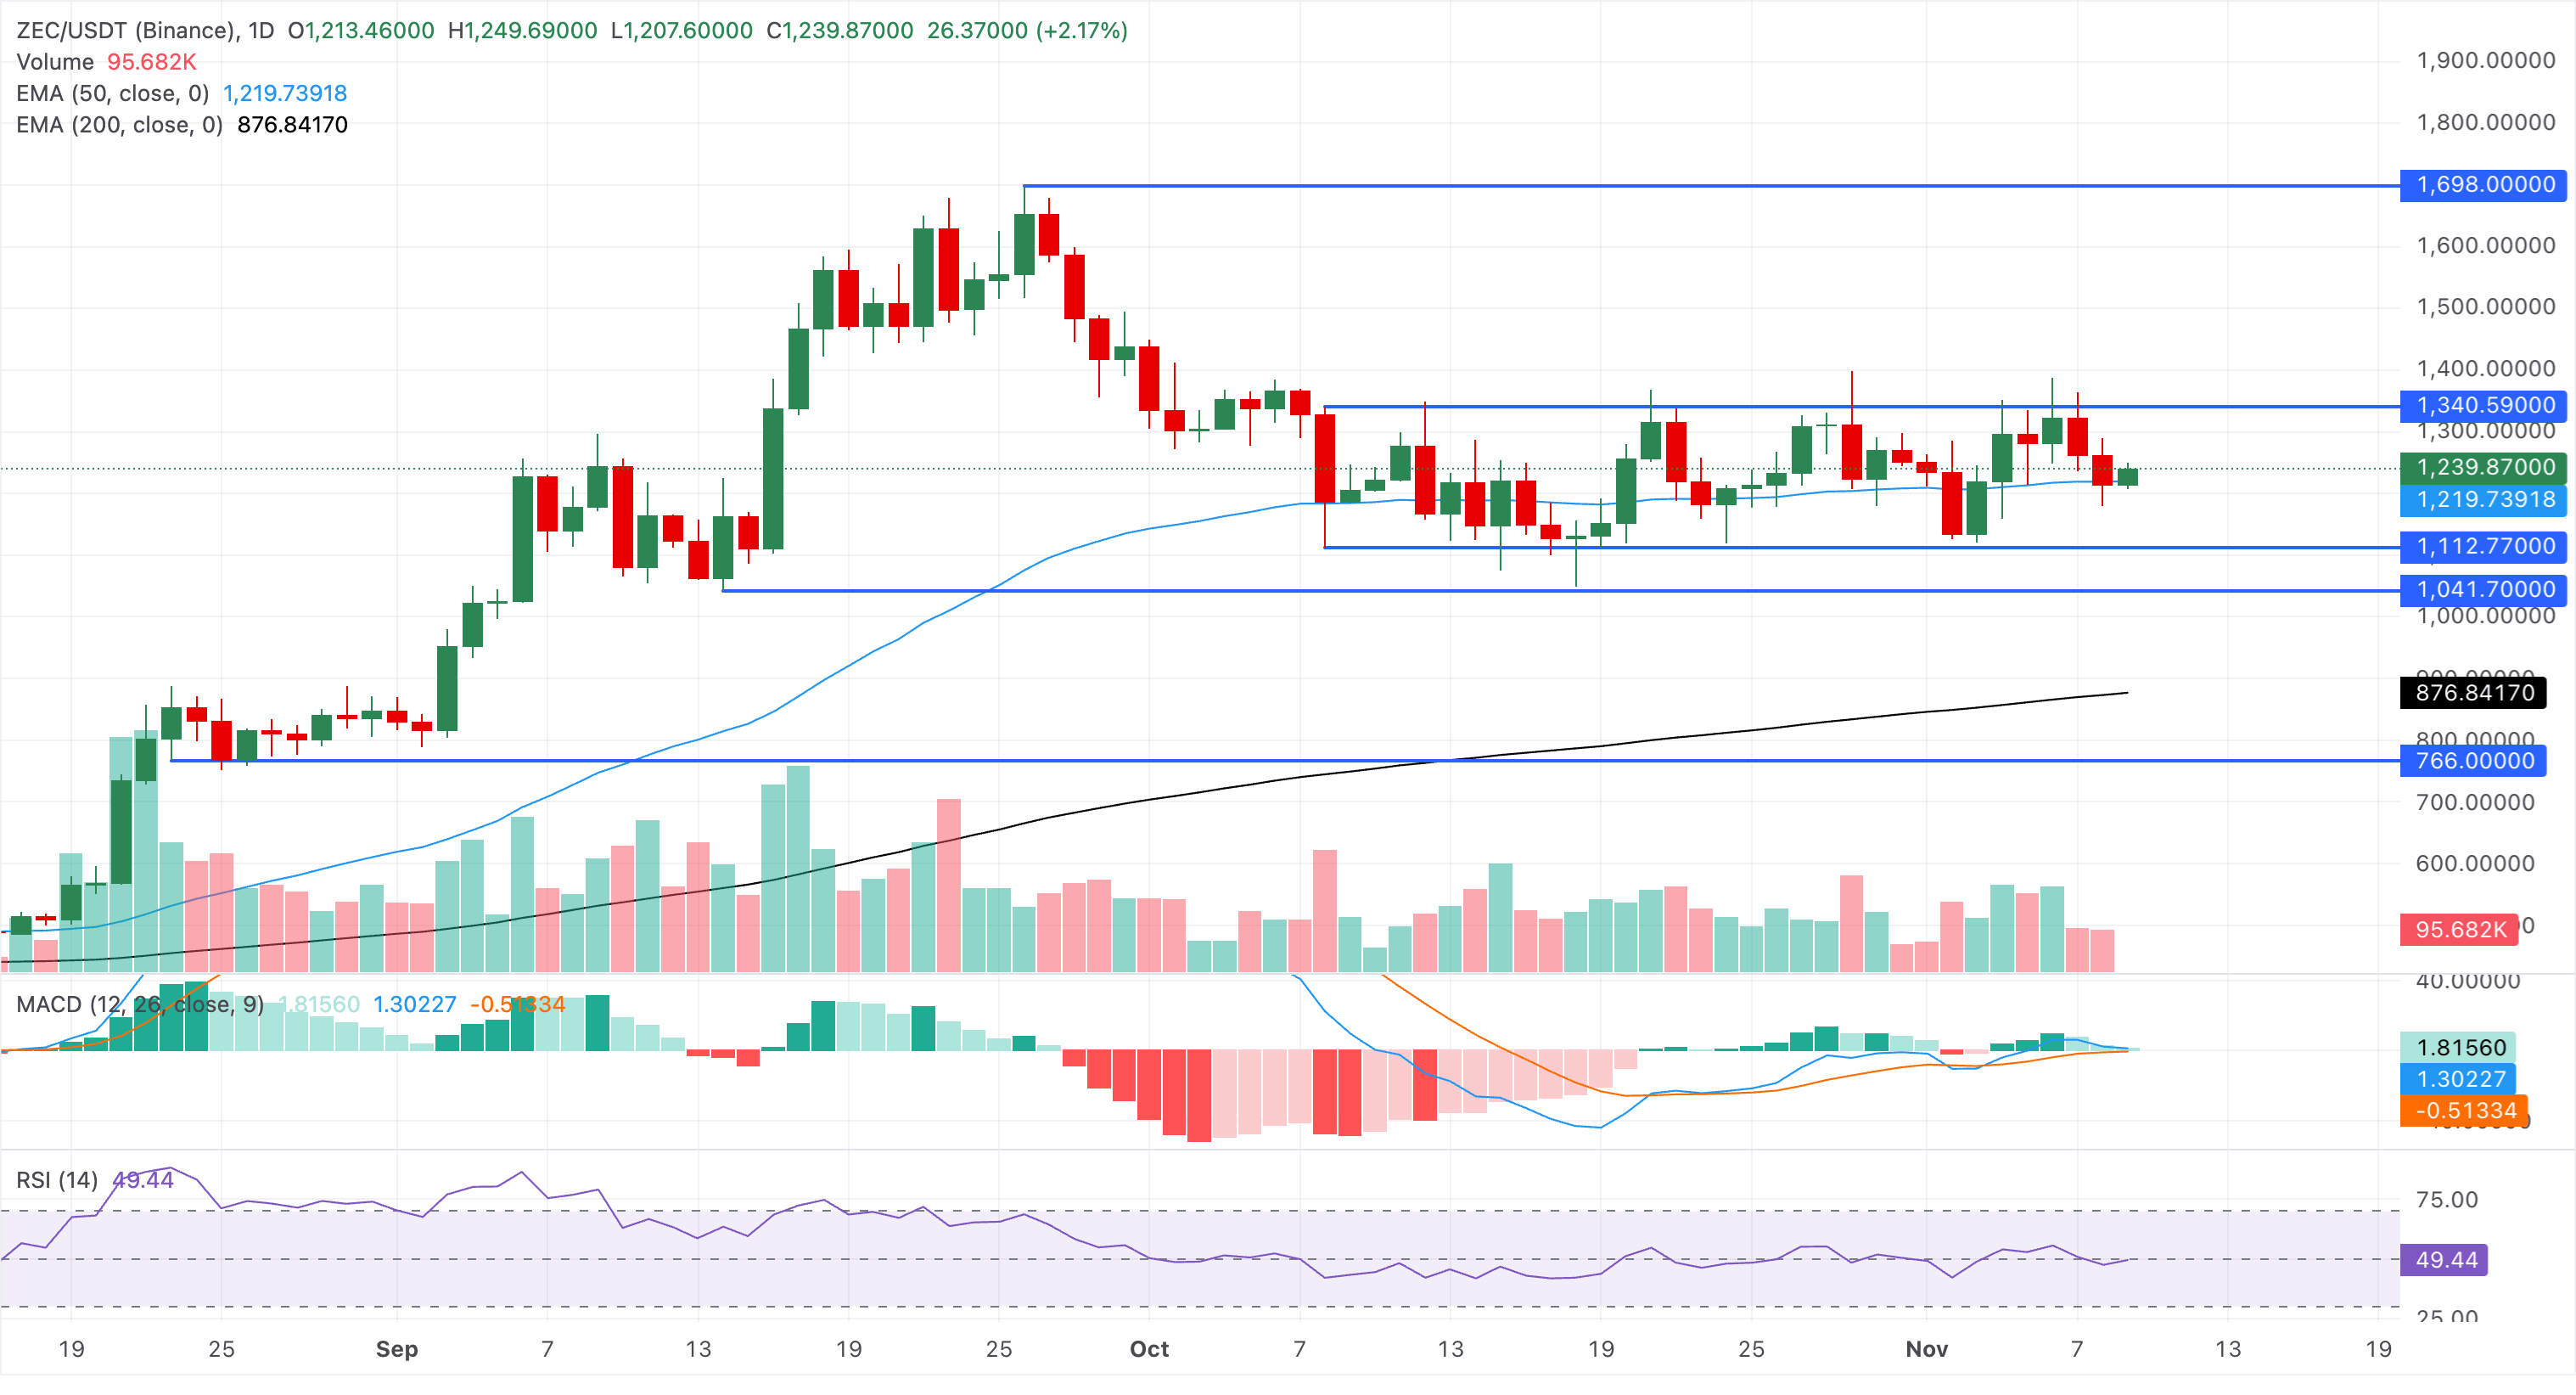
Initial downside support lies near $1,219 at the 50-day EMA. Should selling intensify, the 8 October low of $1,112 provides a deeper structural floor.
(The technical analysis of this story was written with the help of an AI tool. Know more.)
POPULAR ARTICLES
1Swiss Franc weakens as Fed hawkish outlook lifts USD/CHF2Japan Leading Economic Index below expectations (116.7) in September: Actual (116.4)3Japan Coincident Index: 119.5 (September) vs 118.84Above 176.50: EUR/JPY Price Forecast Shows Gains Holding, but Bearish Bias Persists Below 100-day SMA5Gold price today in India: FXStreet data shows a rise6Five-week losing streak: Cardano Price Forecast as bears take control7Monday: US President Donald Trump to meet Qatar's Prime Minister8Lower oil prices ease inflation pressure, keeping United States Dollar Index subdued9Zcash Price Forecast: ETF selling slows ZEC recovery


Get Started!
Sign up and access the Global Markets in less than 3 minutes

Connect With Us












The information provided on this website is of a general nature only and does not constitute personal financial advice. Before acting on any information on this website, you should consider the suitability of the information in relation to your objectives, financial situation and needs. Investing in CFDs and FX Margin Contracts carries significant risks and is not suitable for all investors. You may lose more than your initial deposit. You do not own, or have, any interest in the underlying asset. We recommend that you seek independent advice and ensure you fully understand the risks involved before trading. It is important that you read and consider the disclosure document before you acquire any product listed on the website. The information and advertisements offered on this website are not intended for use by any person in any country or jurisdiction where such use would be contrary to local laws and regulations. The Products and Services offered on this website are not intended for residents of the United States, Malaysia and Thailand.
TMGM is authorized and regulated in various jurisdictions.
Trademax Australia Limited, trading as TMGM, is regulated by the Australian Securities and Investments Commission (ASIC), AFSL no. 436416 and is located at Level 28, One International Tower, 100 Barangaroo Avenue, 2000 Sydney, NSW Australia.
Email: support@tmgm.com.au
Trademax Global Limited, trading as TMGM, is authorized and regulated by the Vanuatu Financial Services Commission (VFSC), registration number 40356 and registered at 1276, Kumul Highway, Port Vila, Vanuatu, Republic of Vanuatu.
Email: support@tmgm.com
Trademax Global Markets (SE) Limited, trading as TMGM, is authorized and regulated by the Financial Services Authority (FSA) of Seychelles, with license number SD224. The company is registered at Office No 13, Providence Estate ABIS Centre, Mahe, Seychelles.
Email: support@tmgm.com
Trademax Global Markets (International) Pty Ltd, trading as TMGM, is authorized and regulated by the Financial Services Commission, Mauritius (FSC) with license no. GB22201012, and registered at 33, Edith Cavell Street C/o IQ EQ Fund Services (Mauritius) Ltd Port Louis, 11324 Mauritius.
Email: support@tmgm.com
Copyright © TMGM. All rights reserved