


Key Takeaways
Support is a price area where declining markets tend to slow or bounce because buying interest increases.
Resistance is a price area where rising markets tend to stall because sellers become more active.
Traders use support and resistance levels to plan entries, stop losses and profit targets on stocks, indices, forex and commodities.
Levels can be horizontal, based on previous highs and lows, or dynamic, based on trendlines and moving averages.
The strength of a level depends on how often price has reacted there, the size of the prior move, the volume traded and the time frame.
No level is perfect. Support and resistance are probability tools, not guarantees, so risk management is essential.
What Are Support and Resistance?
Support: The Trading Floor
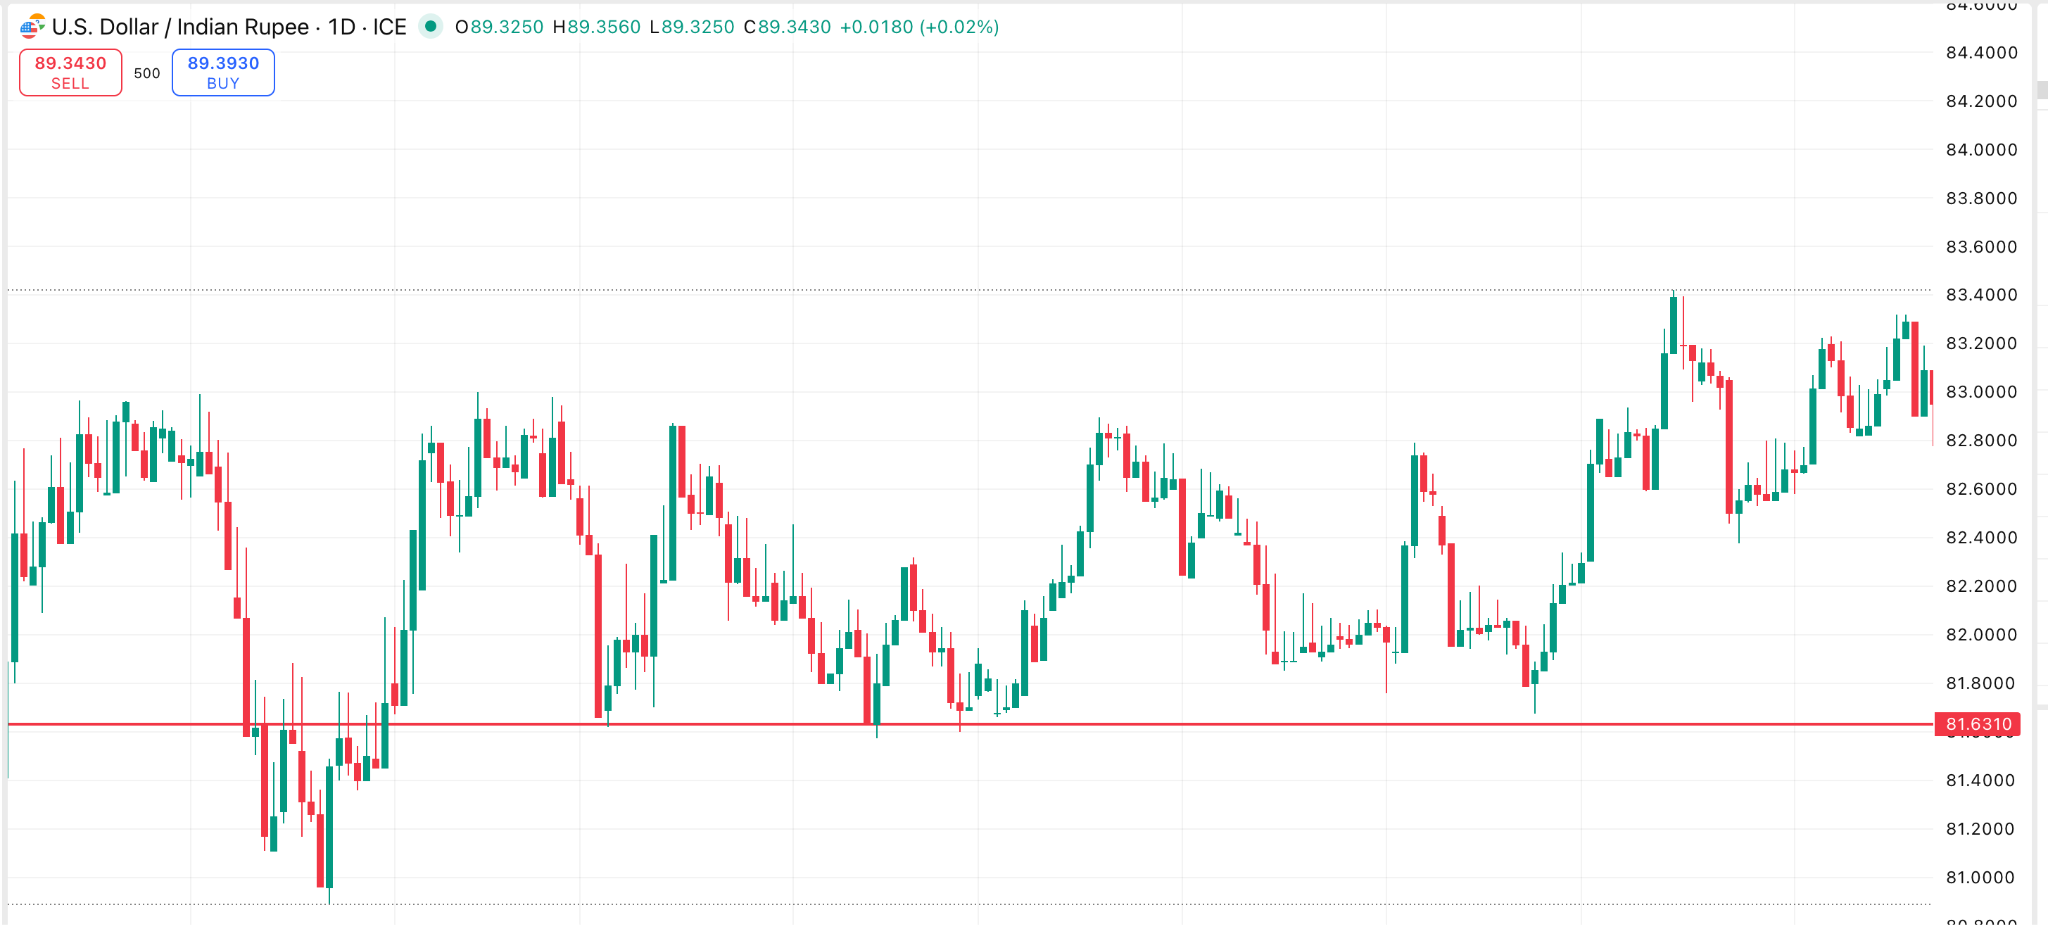
Figure 1: Price Chart of USD/INR showing how a price level has formed a support level, serving as a ‘Price Floor’.
Support is a price area on a chart where a decline has repeatedly slowed or stopped in the past. As price falls toward support, some traders see the asset as better value and start buying. Short sellers may also close their positions near support, which adds more buying.
At a genuine support area:
The previous decline has lost momentum.
Buying volume often increases around that zone.
Price has turned higher from that region more than once.
You will often see support on Nifty or a liquid large cap stock where sellers have struggled to push price below a particular band for several sessions or weeks.
Resistance: The Trading Ceiling
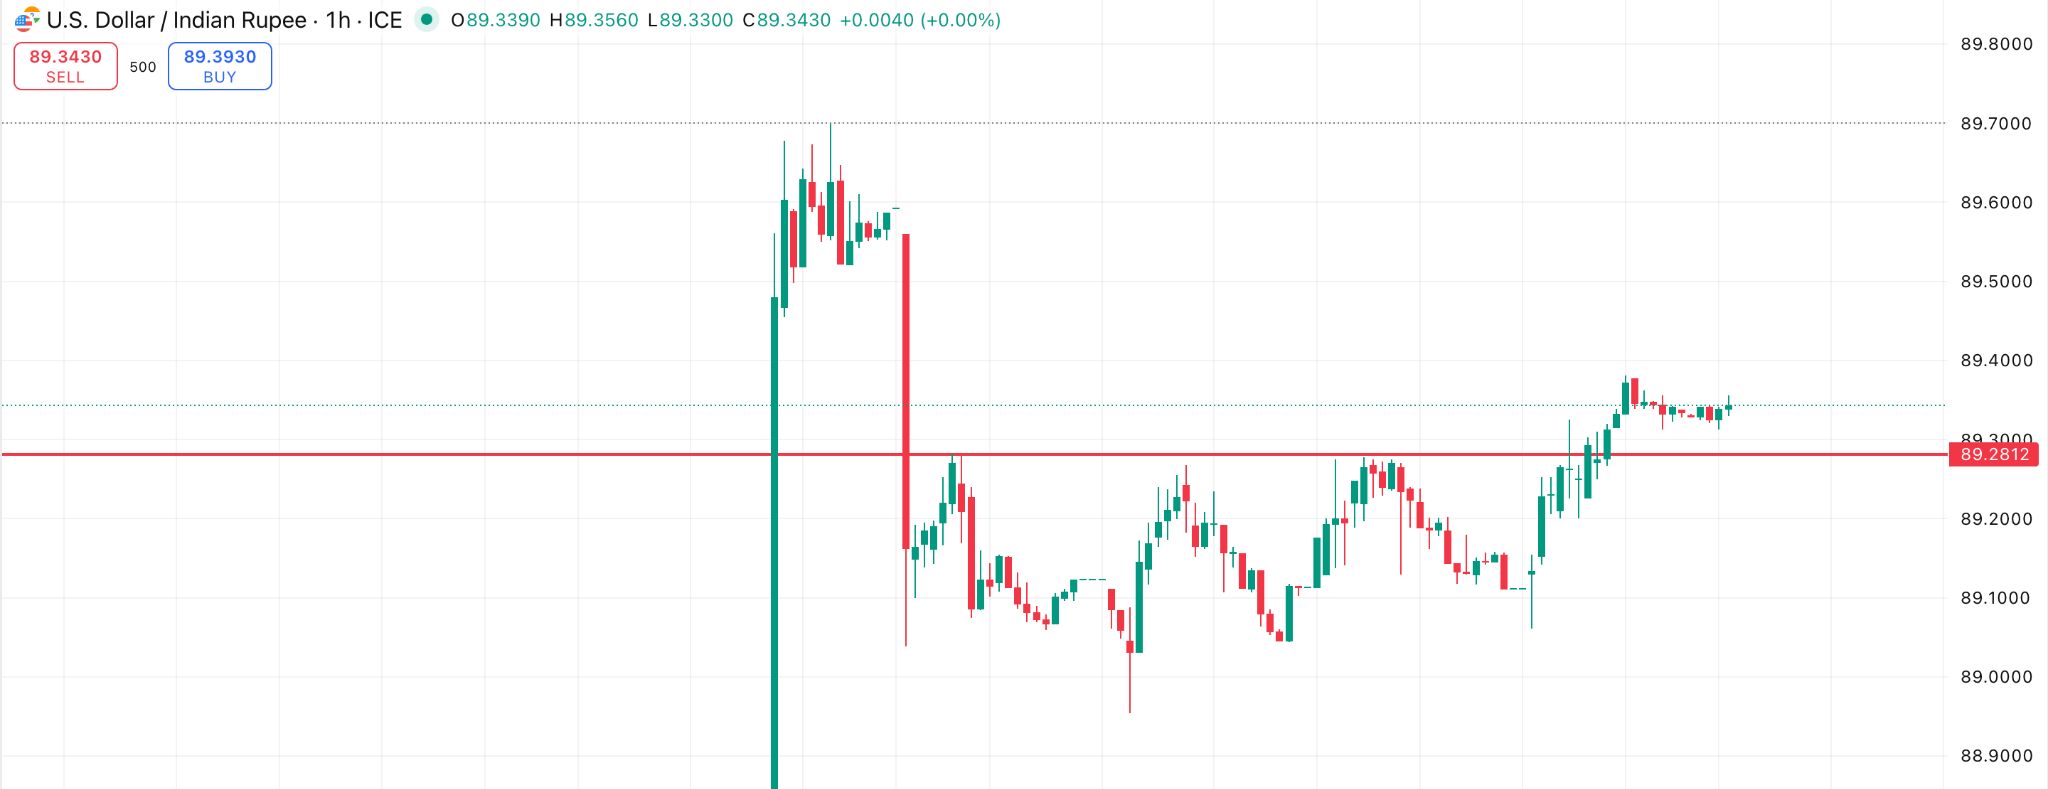
Figure 2: Price Chart of USD/INR showing how a price level has formed a resistance level, serving as a ‘Price Ceiling’.
Resistance is the mirror image of support. It is a price area where an uptrend has repeatedly stalled in the past. As price climbs toward resistance, some traders begin to lock in profits and new buyers become more cautious. Selling pressure then starts to match or exceed demand.
At a genuine resistance area:
The prior rally slows down as price nears the zone.
Selling volume often increases.
Price has failed to stay above that region on several occasions.
Talk of Nifty support and resistance in daily commentary usually refers to these zones where index rallies have earlier run into strong supply or where declines have repeatedly been bought.
Why Support and Resistance Matter for Trading Decisions
Support and resistance levels are not just interesting lines on a chart. They are practical reference points for trade planning.
Traders use them to:
Plan entries. Buying near support in an uptrend or selling near resistance in a downtrend can improve reward relative to risk.
Place stop losses. Stops are often placed just beyond a clear level so that a break of that zone signals that the idea has likely failed.
Set profit targets. Many traders exit near the next projected resistance in a long trade or the next projected support in a short trade.
Choose position size. The distance between the entry and a logical stop beyond support or resistance helps define how large a position can be.
For Indian traders, these ideas apply across markets. A positional trader in India might buy an NSE stock close to a long term support band, place a stop slightly below the level and aim for the next resistance visible on a weekly chart. An intraday trader in a currency pair such as USD INR may lean on yesterday’s high and low as key levels for the trading session.
How to Identify Support and Resistance Levels on Charts
There is more than one way to mark levels and no single method is perfect. A simple step by step process works well on most forex trading chart and equity charts.
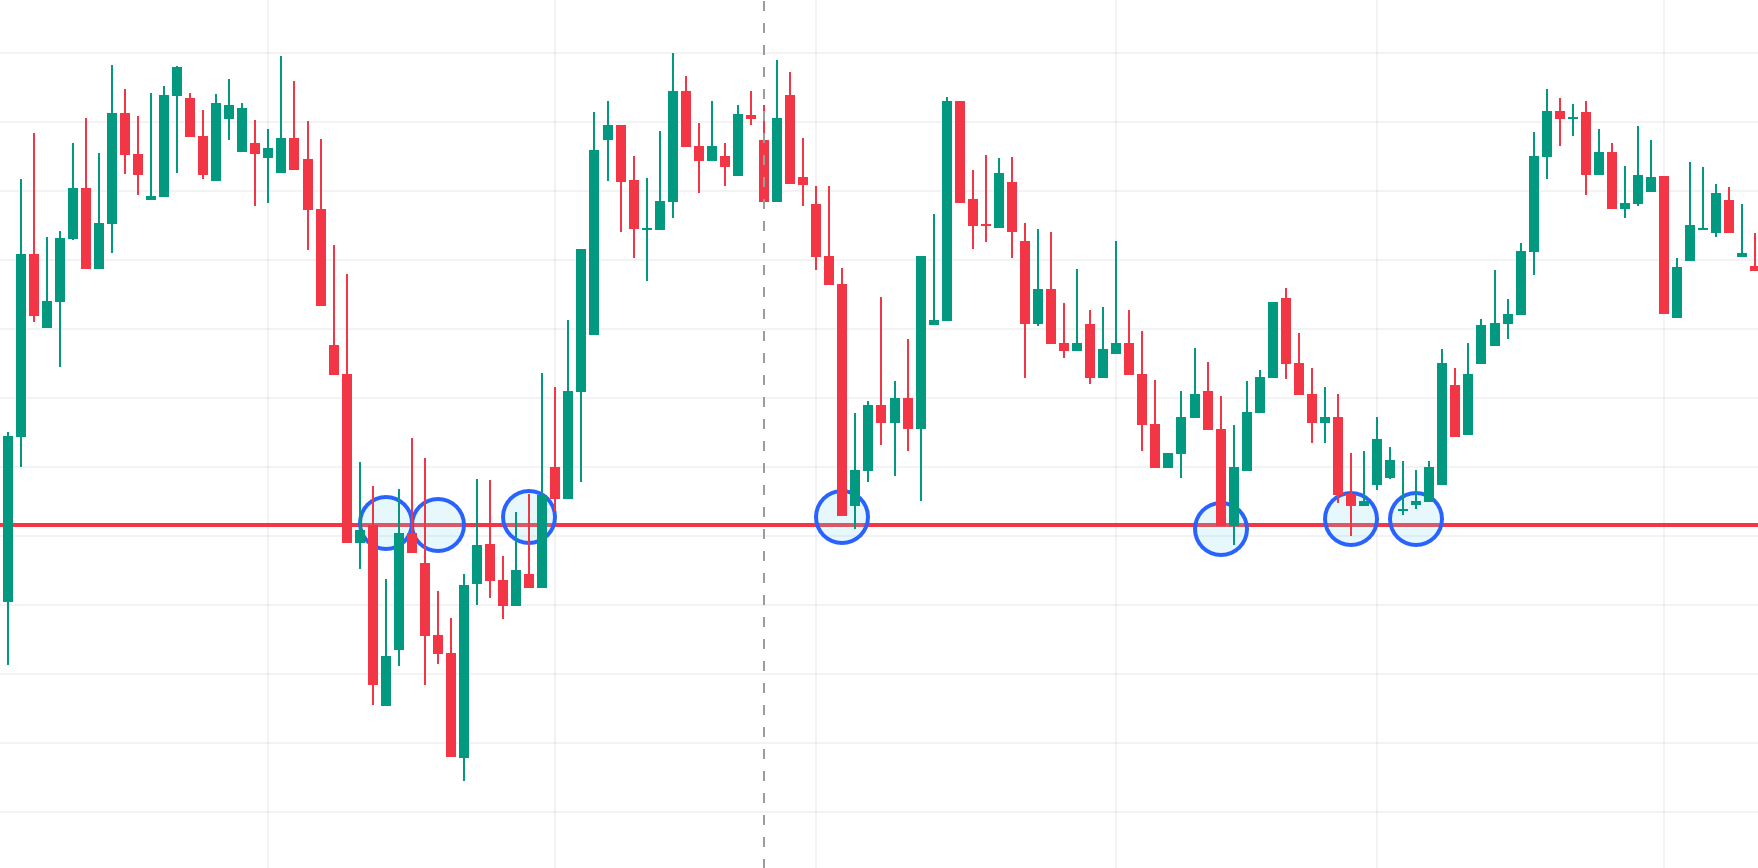
Figure 3: USD/INR Price Chart showing the examples of how to find support and resistance, and how past resistance/support can become future support/ resistance.
Horizontal Support and Resistance Levels
These are flat levels or bands drawn across earlier turning points.
Remember, existing support and resistance levels can serve as opposite functions in the future. As shown in the figure above, past resistance has become the new support in the future for the same chart.
A basic process:
Zoom out. Start with a higher time frame such as daily, weekly or monthly data so you can see major swings in price.
Mark obvious turning points. Look for areas where declines stopped and reversed, or rallies peaked and rolled over.
Cluster similar prices into zones. If price has turned near a range of values rather than at a single number, treat it as a band rather than a thin line.
Refine the lines. Draw horizontal lines through the middle of these clusters to represent support and resistance.
On an index such as Nifty 50, for example, you might see price stall near a round figure several times, creating a clear band of Nifty support and resistance.
Using Multiple Time Frames
Levels on larger time frames carry more weight because they reflect decisions made by longer term participants.
Weekly and monthly support and resistance levels often matter to positional traders and investors.
Daily levels are relevant to swing traders.
Intraday levels on five minute or fifteen minute charts are more important to day traders.
A common routine is to start with weekly and daily levels on the main chart, then drop to shorter time frames to fine tune entries.
Role of Round Numbers
Traders in every market, including India, often react around round numbers such as 100, 500 or 50000. Many stop and target orders cluster around these values, which can naturally turn them into support or resistance zones.
Market Psychology Behind Support and Resistance
Support and resistance work because many market participants watch similar levels and react in similar ways. Several psychological forces are involved.
Anchoring. Once traders have seen price turn near a particular region, they tend to remember it and anchor their future expectations to that band.
Regret and missed trades. A trader who wanted to buy an Indian stock at a particular support level but hesitated may be eager to buy if price revisits that zone.
Breakeven bias. Traders stuck in losing positions are often glad to exit at breakeven if price returns to their entry. This behaviour creates extra supply or demand near past trade levels.
Herd behaviour. If analysts and market commentators highlight the same levels on Nifty or an active banking stock, more traders begin to pay attention to those levels, which reinforces their importance.
This shared focus means that price zones on a chart can become self fulfilling reference points. They do not guarantee a reversal, but they increase the odds that price will hesitate there.
Dynamic Support and Resistance: Trendlines, Moving Averages and Indicators
Support and resistance are not always flat horizontal lines. In trending markets, dynamic levels that move over time can also act as support or resistance.
Trendlines as Rising or Falling Support
A trendline connects at least three swing lows in an uptrend or three swing highs in a downtrend.
In an uptrend, a rising line drawn beneath the lows can act as dynamic support. When price returns to the line, buyers often step in.
In a downtrend, a falling line drawn above the highs can act as dynamic resistance. Price may repeatedly fall away from that descending line.
Many Indian traders draw such lines on Nifty futures or actively traded stocks to track the health of the trend and to spot possible pullback entries.
Moving Averages as Dynamic Levels
Moving averages smooth past prices into a single line. Common settings such as the twenty day, fifty day or two hundred day average often behave like mobile support or resistance.
In an uptrend, price may repeatedly bounce near a rising moving average.
In a downtrend, price may fail near a falling moving average.
Because so many traders watch popular averages, reactions around them can be sharp. For example, a long term trader may see the two hundred day average on a leading NSE stock as a major support and resistance level.
Support and Resistance Indicators and Tools
Modern charting platforms, including many broker apps used by Indian traders, provide a dedicated support and resistance indicator. These tools scan recent highs and lows, identify clusters and plot suggested zones on the chart.
Such indicators can be:
A helpful starting point for spotting levels quickly.
A way to standardise level selection across many instruments.
However, they are still based on past price data and simple rules. It is better to treat the plotted zones as suggestions and refine them manually rather than rely on them mechanically.
Trading Ranges, Breakouts and Role Reversals
Trading within a Range
Sometimes price moves sideways between nearby support and resistance for days or weeks. This is a trading range.
In a range:
The lower boundary behaves like support.
The upper boundary behaves like resistance.
Range traders aim to buy near the lower band and sell near the upper band, usually with tight stops in case the range fails. For example, a stock on NSE might oscillate between a lower band near a previous low and an upper band near a previous high for several weeks.
Trading ranges can be attractive but risky. Many traders prefer to wait for a clear break out of the range and then trade in the direction of that move.
Breakouts and Retests
When price finally moves strongly through a well watched level, traders call it a breakout.
A break above resistance suggests buyers have overwhelmed sellers.
A break below support suggests sellers have overwhelmed buyers.
After a breakout, price often revisits the broken level from the other side. Traders watch this retest closely. If the level holds, the new trend may be gaining strength.
Support Becoming Resistance and Resistance Becoming Support
Role reversal is a key idea:
A former support area may act as new resistance if price breaks below it and later rallies back to that band.
A former resistance area may act as new support if price breaks above it and later pulls back to that region.
You can see such role reversals on many Indian charts, from large cap stocks to indices and even to gold support and resistance zones on MCX futures where a previously capped area later holds as a floor.
Measuring the Strength of a Support or Resistance Level
Not all levels are equal. Some are minor, others are major turning points that can influence price for months. Several factors help judge the strength of a level.
Number of Touches
The more times price has reached a level and turned away, the more traders notice it.
A zone that has held three or four times is usually more important than one that has been touched only once.
Repeated touches increase the odds that other traders have placed entries, targets and stops around that area.
Size and Speed of the Prior Move
Levels that follow strong moves tend to be more meaningful.
A sharp rally into resistance shows strong enthusiasm that may later exhaust itself.
A fast decline into support can attract bargain hunters more aggressively than a gentle drift lower.
For example, a steep sell off in an Indian metal stock that halts at a long term demand zone on the weekly chart can create a powerful support band.
Volume and Time
Volume and time frame also matter.
When large volume trades near a price band, more market participants have positions anchored there.
Levels visible on weekly or monthly charts usually matter more than levels seen only on a five minute chart.
Gold support and resistance zones that have held on weekly MCX gold charts for months often attract more attention than minor intraday blips.
Building a Trading Plan Around Support and Resistance
Support and resistance work best as part of a complete trading plan rather than in isolation. A simple framework might look like this:
Define the trend. Use price structure and perhaps a moving average to decide whether the market is trending up, down or sideways.
Mark key levels. Draw horizontal levels on recent swing highs and lows on higher time frames, then on your trading time frame.
Look for confluence. Give extra weight to areas where horizontal levels, trendlines, moving averages, macd, rsi or Fibonacci retracements cluster together.
Wait for price action signals. Look for candlestick patterns or chart pattern trading setups near those zones, for example a rejection wick at resistance or a bullish candle at support.
Set entry, stop and target. Place entries close to the level if the setup is valid, stops beyond the level so that a break means the idea is wrong, and targets near the next logical level.
Manage risk. Decide position size based on the distance to the stop and your personal risk limits per trade.
This process can apply to a forex chart, a Nifty futures contract or a liquid Indian stock. The language of support and resistance is the same even though the instruments differ.
Limitations and Common Mistakes
Support and resistance are popular because they are simple and intuitive, but they come with limitations.
Common mistakes include:
Treating levels as exact prices. Real markets react in zones rather than at perfect single values. A minor overshoot does not always mean the level has failed.
Ignoring context. A level that held during quiet conditions may not hold during a major macro event or after unexpected news.
Over crowding entries. Placing entries exactly where everyone else is entering can lead to sudden spikes and quick reversals.
Forgetting risk management. Levels are probability tools. They do not remove the need for stops and sensible position sizing.
Traders in India also need to consider local factors such as liquidity during specific hours, exchange holidays and margin rules when they build strategies around support and resistance.
The Bottom Line
Support and resistance describe areas on a chart where the balance between buyers and sellers has shifted in the past and may do so again. These price zones help traders on Nifty, forex and gold markets in India and worldwide to organise charts, plan trades and manage risk.
On their own, levels do not predict the future. Combined with a clear view of trend, simple price action patterns, sound risk control and a realistic understanding of market psychology, they become a practical framework for navigating uncertain markets.


