


What is Fibonacci Retracement?
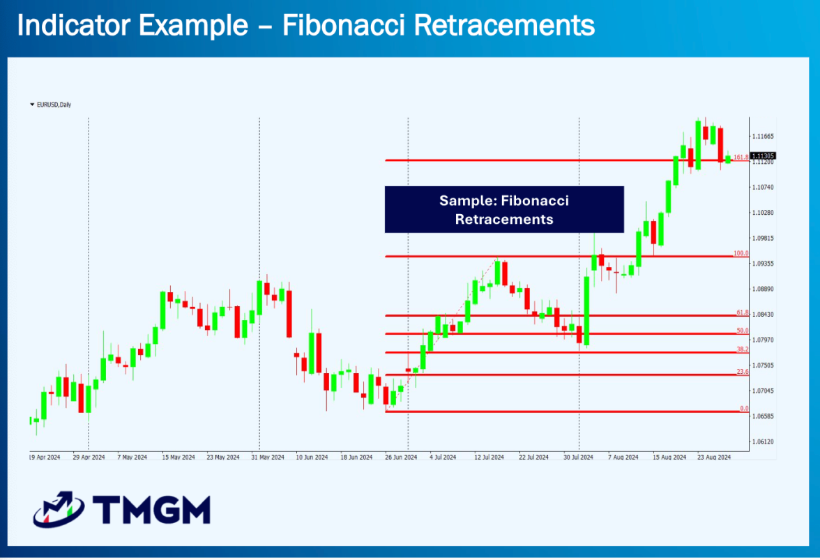
Figure 1. Chart of a Fibonacci Retracement Tool being used on a forex currency chart.
Fibonacci retracement is a technical analysis tool used by traders to identify potential support and resistance levels. It uses ratios derived from the Fibonacci sequence to help predict where a price may pause or reverse during a pullback in a trend.
Important Fibonacci retracement settings used by professional Fibonacci trader include:
23.6%
38.2%
50% (not a Fibonacci number, but widely used)
61.8%
78.6%
These numbers are visualized on the price chart to identify potential support and resistance levels or supply and demand reversal zones. These ratios are derived from the relationships between numbers in the Fibonacci sequence. The 61.8 percent level is the most well-known because it is connected to the Fibonacci retracement golden ratio, which many traders closely monitor.
How to Draw Fibonacci Retracement for Trading
Drawing Fibonacci Retracement levels is a simple process using the built-in tool on most trading platforms. The key is to correctly identify the start and end points of a significant price move (swing high and swing low).
Note: Fibonacci Retracement finds the support and resistance levels of a particular trend, so this can be used in many scenarios like Day Trading or even Scalping Trading.
Step 1: Identify The Trend
Determine whether the market is an uptrend or a downtrend. This is crucial, as Fibonacci retracement works best in trending markets, hence it is more beginner friendly with swing trading strategy.
Step 2: Select the Fibonacci Retracement Tool
Most charting software provides a specific tool for this (often a 'F' symbol or found in the drawing tools menu).
Step 3: Apply the Fibonacci Tool
For an uptrend:
Click and hold your cursor at the significant swing low (the bottom of the move), then drag it up to the most recent swing high (the peak of the move).
For a downtrend:
Click and hold your cursor at the significant swing high (the top of the move), then drag it down to the most recent swing low (the trough of the move).
Step 4: Watch for Potential Support and Resistance
When the price approaches a Fibonacci level, observe how it behaves. The level can act as support during an uptrend or resistance during a downtrend. These reactions may indicate potential buying or selling opportunities.
Step 5: Combine Fibonacci with Other Tools
Fibonacci is more effective when used with other technical tools. You can combine it with trendlines , moving averages, RSI, or chart patterns. Many traders also use it with Elliott Wave Fibonacci analysis for added clarity.
Step 6: Use Multiple Timeframes
Applying Fibonacci retracement on several timeframes can help identify zones where multiple levels align. These alignments create stronger trading areas.
Step 7: Practice Before Trading Live
Like any trading tool, mastering Fibonacci retracement takes time and practice. Start with paper trading to gain confidence before using it in live trading.
How Indian traders apply this on NSE and USD/INR
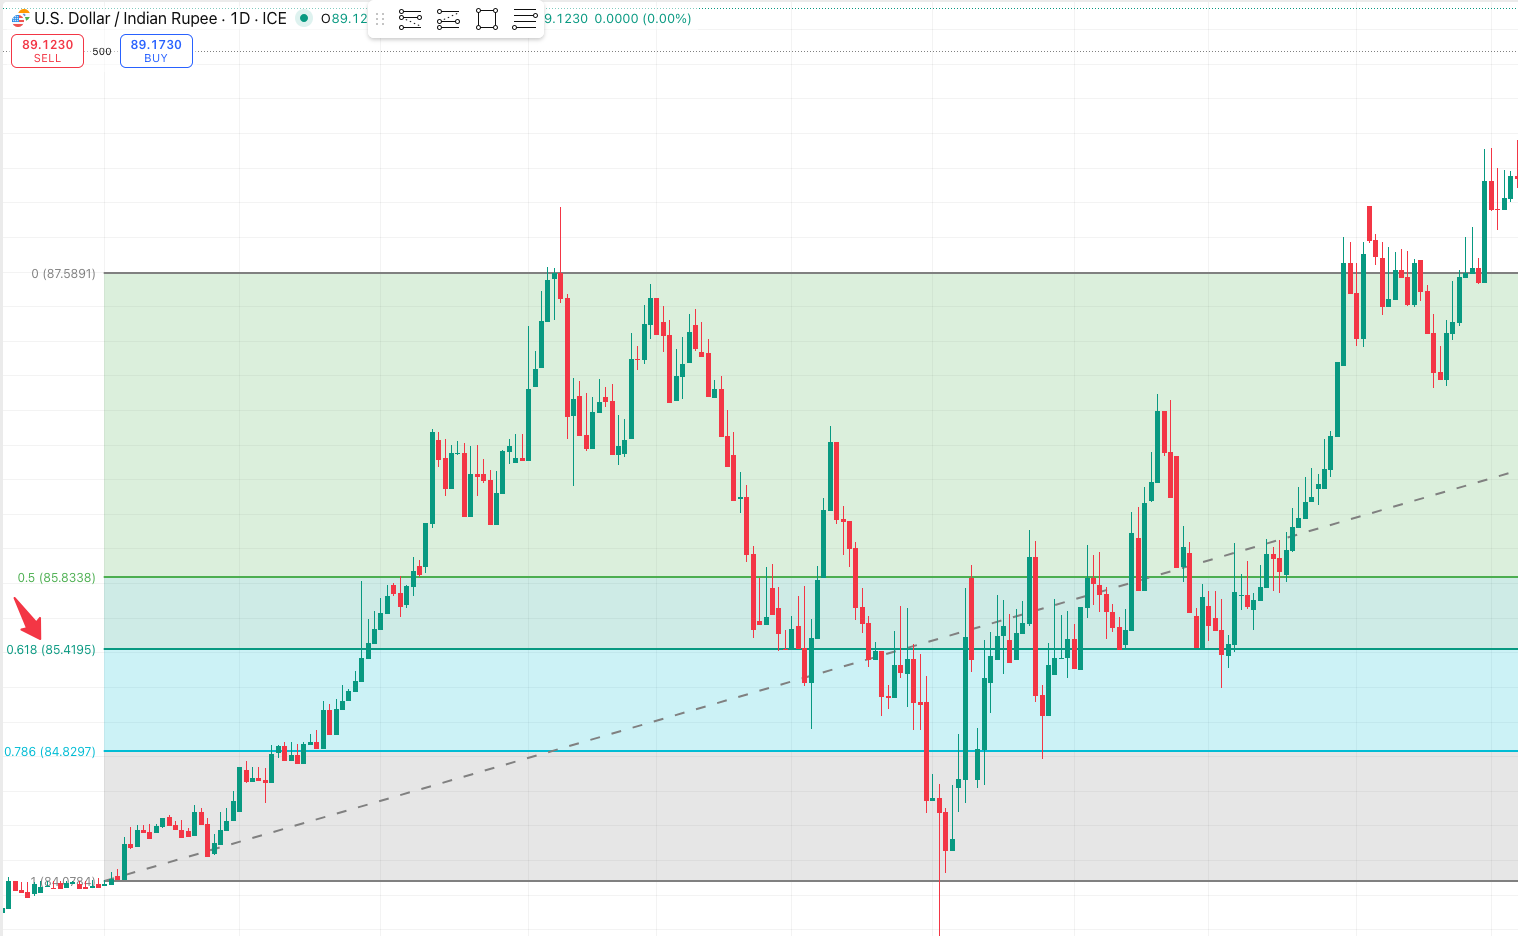
Figure 2: USD/INR chart using Fibonacci Retracement to observe price stabilization and reversal, centred around Fibonacci Level or Gold Level at 0.618 level, emphasized by the red arrow.
In trading, the 61.8 percent retracement level is considered the most influential. Many traders observe whether the price reacts around 0.618 level, because the market often finds stability or reverses there.
The above figure shows an example of how Indian Traders drew a Fibonacci Retracement on a USD/INR chart, likely on NSE or any SEBI approved broker.
Notice how the price gets gravitated towards the 0.618 to find both support and resistance. This natural property made Fibonacci extremely useful for traders. Usually, as all support and resistance tools, the longer the timeframe when the tool is drawn on, the stronger the reliability.
Meaning, if you draw a Fibonacci Retracement on the Week Chart to predict support/resistance levels on the Day Chart, it will work very well on the Day Chart.
Common Mistakes Indian Traders Make with Fibonacci Retracement
Fibonacci tools are used by professionals but they still have limitations:
Subjective Analysis
Different traders choose different swing highs and lows. This leads to different retracement levels.
Never a Standalone Tool
Fibonacci retracement should always be combined with other trading tools and strategies to create confluence.
Ignoring Market Characteristics & Conditions
The tool works best in clean trending conditions. Extremely volatile conditions may reduce reliability.
Other Advanced Fibonacci Tools
Besides Fibonacci Retracement, you can explore additional tools that expand your strategy:
Fibonacci Extensions
Used to project potential profit targets beyond the retracement levels using Fibonacci Sequence or Fibonacci Series numbers.
Fibonacci Fans
Lines drawn from a swing high or swing low that create a fan-shaped pattern, helping traders understand angled support or resistance.
Fibonacci Time Zones
Vertical lines based on Fibonacci intervals that may signal possible timing of market reversal.
Fibonacci Clusters
When multiple Fibonacci levels from different swings or timeframes overlap, they create stronger reaction zones.
Elliott Wave Fibonacci
Elliott Wave and Fibonacci analysis are often used together in trading to identify support and resistance levels and potential price targets.
These techniques are also useful in markets like forex, indices, metals, and crypto trading.
Learning and trading Fibonacci Retracement with a Regulated Broker.
Fibonacci Retracement is one of the most popular tools used by traders, hence most brokers provide a powerful trading environment for beginners who want to learn how to draw Fibonacci retracement correctly.
The important thing to remember is that Indian Traders must adhere to SEBI (Securities and Exchange Board of India) regulations and the approved list of exchanges and brokers when trading Forex, Stocks, Commodities or even Crypto.
Before Trading:
SEBI Approved list of Exchanges include:
National Stock Exchange (NSE)
Bombay Stock Exchange (BSE)
Multi Commodity Exchange (MCX)
National Commodity & Derivatives Exchange (NCDEX)
Metropolitan Stock Exchange of India Ltd. (MSEI)
India International Exchange (India INX)
However, TMGM provides a wide range of resources for beginners to learn trading. These valuable resources include:
MetaTrader 4 and 5 Integration
TMGM offers MT4 and MT5 platforms with built-in Fibonacci tools. You can easily apply Fibonacci retracement settings to any chart and learn how to draw fibonacci retracement.
Educational Resources
TMGM offers many other educational materials like blog articles, E-books, Courses, Market News and Webinars that often cover advanced trading techniques, including Fibonacci retracement. Take advantage of these resources to enhance your understanding and application of this tool.
Risk Management
Always apply proper risk management when using any trading methods and strategies. Use the stop-loss and take-profit features to manage your risk.
Demo Account Practice
Before applying any tools in live trading with a SEBI Approved Broker, you can use TMGM's beginner-friendly demo account feature to practice and refine your strategy without risking real capital.
Combining TMGM's professional educational materials with robust demo-trading infrastructure, can enhance your trading strategy and decision-making process. However, always remember that no trading tool is infallible, and it's crucial to use Fibonacci retracement as part of a comprehensive trading plan that includes thorough market analysis and strict risk management.


