


Key Takeaways:
- Trendlines forecast the prevailing market direction by identifying potential support and resistance levels, enabling traders to interpret the current trend and strategically time their entries and exits with appropriate context.
- A trendline is a straight line connecting at least two, preferably three, swing highs or lows to illustrate upward, downward, or lateral momentum.
- They indicate trend direction, serving as dynamic support or resistance, and filter out short-term volatility to ensure trading decisions align with the dominant market bias.
- Use uncluttered charts and anchor the line to multiple significant swing points, as a greater number of confirmed touches typically strengthens the trend signal.
- Trade price bounces within channels or breakouts beyond trendlines, confirming with volume or technical indicators to optimize entry, stop-loss, and take-profit levels.
- Trendlines may fail during consolidation phases or counter-trend moves, so always seek confirmation from additional tools and manage risk with predefined stop-loss orders.
- The same drawing and trading principles apply across forex, indices, metals, energies, equities, and cryptocurrencies because price structure and momentum dynamics are universal.
What is a Trendline?
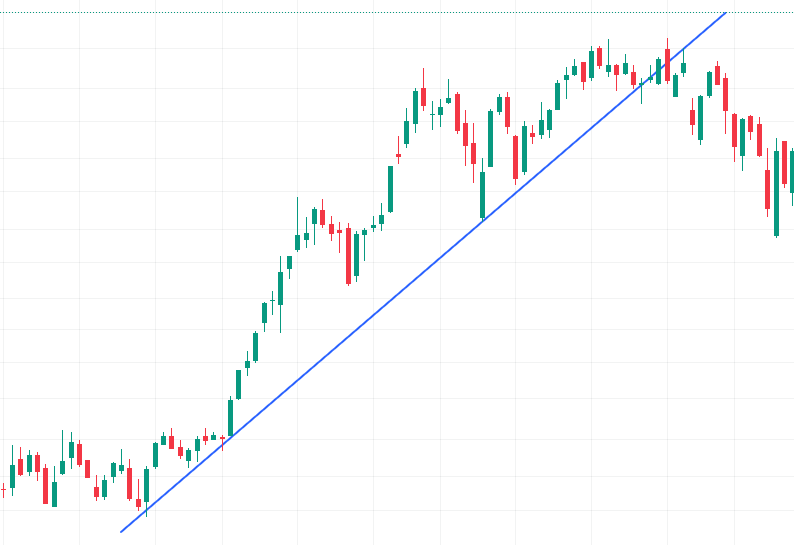
Trendlines are diagonal lines drawn by traders on price charts to depict the overall direction of price movement, whether ascending, descending, or sideways. When prices trend upward, bullish trendlines are constructed by connecting a series of swing lows, clearly illustrating the upward momentum in price action.
Conversely, bearish trendlines are formed by linking a series of swing highs, indicating a downward price trend. In markets lacking a clear directional bias, sideways trendlines connect various highs and lows, signaling a range-bound or consolidating market. A key feature of trendlines is their role as support and resistance zones, where prices often rebound or break through, making them essential tools for anticipating future price movements.
Downward trendlines are drawn from the highs sloping downward, signaling bearish sentiment in forex, energy, or index markets.
Upward trendlines connect the lows and slope upward, reflecting bullish momentum in cryptocurrencies, equities, or metals.
Whether you trade forex, cryptocurrencies, metals, indices, or whether you engage in day trading, swing trading or scalping, drawing a simple line through key highs or lows instantly reveals the market’’s true direction—, filtering out noise so you can identify when momentum is accelerating or decelerating.
By assessing whether the market respects these trendlines, traders can align CFD strategies on cryptocurrencies, gold, or stock indices with the most probable price trajectory.
Benefits of Using Trendlines in Trading
Trendlines provide several practical advantages across all major asset classes:
Visualize the overall trend: They clarify whether prices in forex, commodities, or equity markets are generally trending upward, downward, or sideways.
Identify support and resistance: Prices often react around trendlines in energy, cryptocurrency, and metal CFDs, offering clear zones for entry and exit.
Reduce noise: By smoothing out short-term volatility in forex or crypto charts, trendlines emphasize the dominant market direction.
Gauge volatility: Drawing multiple trendlines can reveal momentum shifts in commodity, equity, and index trading.
Platforms such as MetaTrader 4 and MT5 enable manual or automatic drawing of trendlines by connecting highs and lows on cryptocurrency or forex charts, guiding you step-by-step in trendline construction.
Finding & and Drawing Accurate Trendlines
For optimal results in forex, crypto, and commodities, follow these steps to draw precise trendlines and master trendline trading:
Open a clean chart without indicators on your trading platform.
Identify the highest or lowest price point on the indices, energy, or equity chart.
Select the line tool and click on this point, dragging it to the chart’’s endpoint——this demonstrates how to draw trendlines.
Adjust the line so that it touches at least two significant peaks or troughs—three points for increased validity.
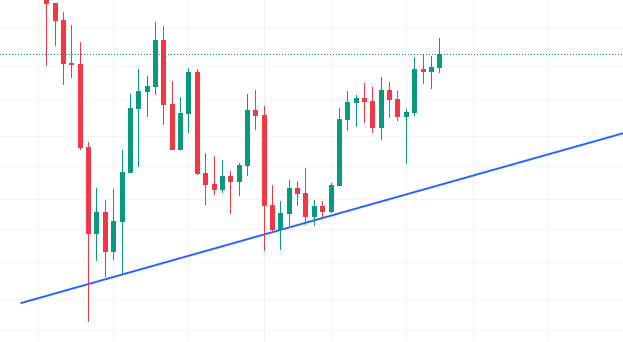
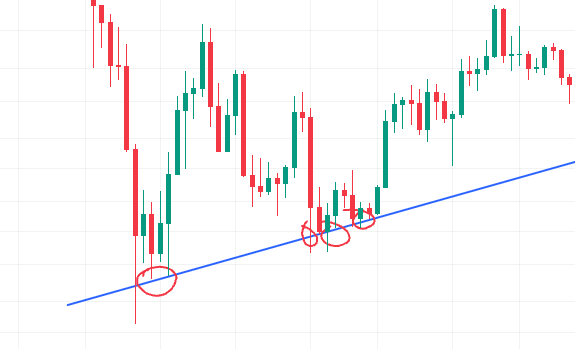
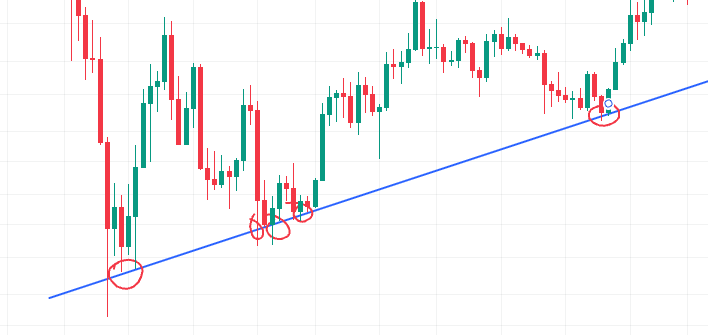
Trendlines tested multiple times are considered ‘confirmed’ and tend to be revisited if the market remains in the same phase.
Therefore, a valid trendline in trading crypto CFDs or other asset classes should connect at least three swing points. The greater the number of touchpoints, the stronger the trendline signal.
How to Trade with Trendlines
Range Trading Using Trendlines
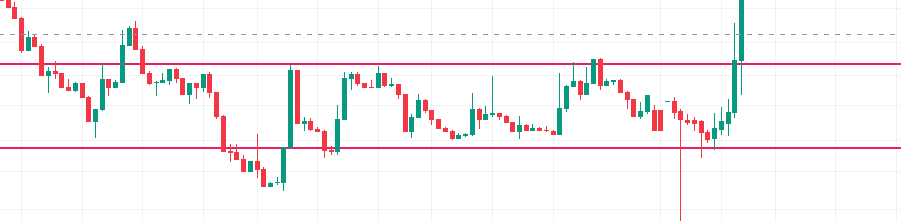
When parallel trendlines form a channel in forex or stock index CFDs, you can:
Enter long positions near the lower trendline when bullish indicators confirm.
Enter short positions near the upper trendline when bearish signals emerge.
This approach is equally effective in gold, silver, energies, and cryptocurrencies when trading CFDs, illustrating practical trendline trading strategies.
Trendline Breakout Strategies
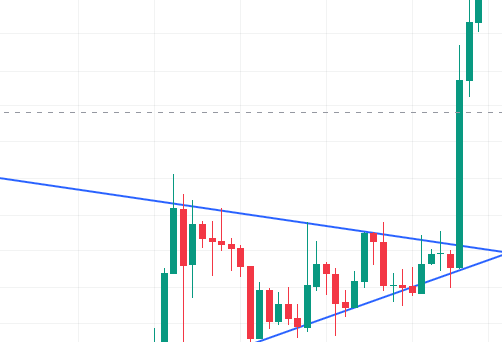
Breakouts through trendlines in forex, crypto, or equity CFDs can trigger significant price moves:
A close above the upper trendline—often accompanied by increased trading volume—signals a bullish breakout.
A close below the lower trendline indicates a bearish breakout.
Open long or short CFD positions on energies or cryptocurrencies accordingly, using trendlines to time your entries.
Key Cautions for Trendline Trading
Markets move in zigzag patterns—two steps forward, one step back. A trendline’ does not guarantee direction; it may represent a counter-trend or consolidation phase. Always validate trendlines with other indicators and broader market context in indices, forex, or commodities before executing trades.
Applying Trendlines Across Different Markets
Trendlines can be applied in virtually any market:
Indices (e.g., S&P 500, NASDAQ)
Forex majors and minors
Energies (e.g., crude oil, natural gas)
Shares (CFDs on global equities)
Metals (gold, silver, platinum)
Cryptocurrencies (Bitcoin, Ethereum, altcoins)
Trendline methodologies are universal: the same principles apply to trendlines on cryptocurrency, metal, or equity charts.


