
Key Takeaways
- Swing trading targets multi-day price movements within broader market trends, providing opportunities for consistent gains with reduced screen time when executed with a structured plan and clear risk parameters.
- Establishing a solid foundation involves mastering core charting techniques and indicators, defining precise entry and exit points, and employing stop-loss orders alongside real-time profit and loss (P&L) monitoring to ensure decisions are rule-based rather than emotional.
- Effective methods include trend-following, support and resistance analysis, price channels such as Bollinger Bands, volatility strategies based on Average True Range (ATR), and Fibonacci retracements, all adapted to the specific instrument and validated by volume analysis.
- Discipline and risk management—covering position sizing, favorable risk-to-reward ratios, predefined stop-losses, and maintaining a trading journal—are essential to protect capital and minimize emotion-driven errors.
- While swing trading can be profitable, it is not guaranteed; results depend on the quality of strategy, prevailing market conditions, and effective risk control. Traders should expect variability and prioritize ongoing testing and refinement.

What Is Swing Trading? Building Your Swing Trading Strategies Foundation
Before aiming for significant gains, it’s crucial to build a strong foundation in swing trading knowledge. This includes understanding and applying key concepts such as utilising Technical Analysis tools, interpreting chart patterns, and implementing sound risk management techniques. These skills help you gauge market momentum and make informed decisions to optimize your trading potential.
Swing trading focuses on identifying short-term market fluctuations within longer-term trends. Since markets rarely move in a straight line, the objective is to capitalize on price retracements and advances by timing entries and exits to achieve steady, incremental profits. Mastering these fundamentals prepares you to explore advanced swing trading strategies and incorporate sophisticated technical indicators.
Before proceeding, it is advisable to learn how to set stop-loss orders for swing trading, which are vital for capital preservation and mitigating significant drawdowns over time. Additionally, tracking your trading performance in real time enhances portfolio oversight.
Effective Swing Trading Strategies & Techniques
There is a broad spectrum of swing trading strategies tailored to various trading styles, risk tolerances, and market environments. Define your objectives—whether targeting short-term or longer holding periods—when selecting a strategy. Also, consider your chosen asset class, as not all indicators are universally applicable; for instance, a Forex-specific indicator may not perform well with stocks or indices due to differing market dynamics.
Key strategies to consider include:
Trend-Following Swing Trading Strategy
Trend following aims to identify prevailing market directions and engage at optimal times. Utilizing charts and technical indicators such as Moving Average Convergence Divergence (MACD) and trendlines, traders assess market sentiment to decide on long or short positions by identifying whether the asset is trending upward, downward, or sideways. Direction and momentum are critical for maximizing potential returns.
Example: In early 2023, EUR/USD consistently traded above its 50-day moving average, clearly indicating an uptrend. Traders who initiated long positions during this bullish phase benefited from sustained momentum.
Why It Works: Trend following is effective because it aligns trades with dominant market conditions. Markets often exhibit sustained directional trends influenced by macroeconomic factors, monetary policy shifts, or geopolitical events. Trading with the trend reduces risks associated with countertrend moves, enhancing the probability of profitable outcomes.
Support & Resistance Levels for Swing Trading Strategies
Also known as breakout trading, this approach focuses on identifying key support and resistance zones and understanding the underlying market psychology. By analyzing market structure, chart patterns, and trendlines, traders can react when prices approach critical levels, pinpointing optimal entry and exit points. Successfully navigating these levels allows traders to capitalize on potential breakouts and reversals.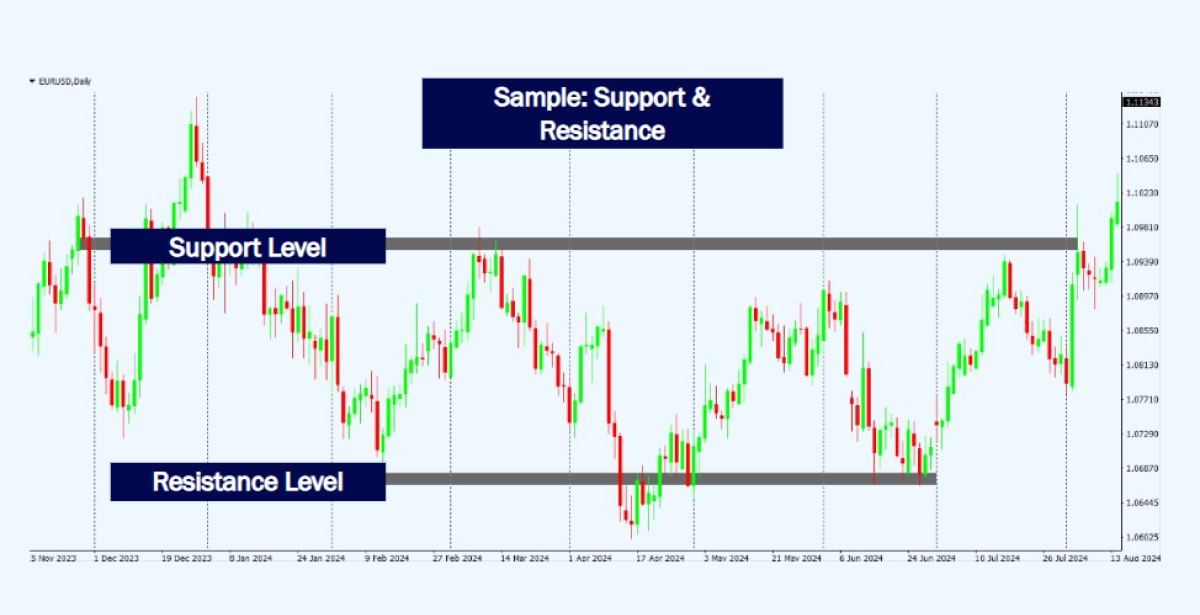
Example: In early 2023, gold prices (XAU/USD) repeatedly encountered resistance near the $2,000 per ounce level. Traders monitoring this barrier identified opportunities when the price broke above it, profiting from subsequent sharp movements.
Why It Works: Support and resistance levels reflect collective market psychology. When prices stall repeatedly at certain levels, traders anticipate similar reactions in the future. A breakout signals a shift in market sentiment, often triggering significant price moves. Recognizing these psychological price points enables traders to anticipate and exploit market dynamics effectively.
Price Channels: A Key Swing Trading Indicator
Price channels, such as Bollinger Bands, are essential tools for identifying entry and exit points on an asset’s price chart. By analyzing price trends within the channel, traders determine trend direction. Typically, Bollinger Bands are used alongside other technical indicators like chart patterns or MACD to corroborate signals in technical analysis.
Interpreting Bollinger Bands involves noting that the upper band represents resistance linked to recent highs, the lower band connects to recent lows, and the middle band serves as a moving average support level.
A common strategy is to buy near the lower band and sell near the upper band, complemented by stop-loss orders to manage risk.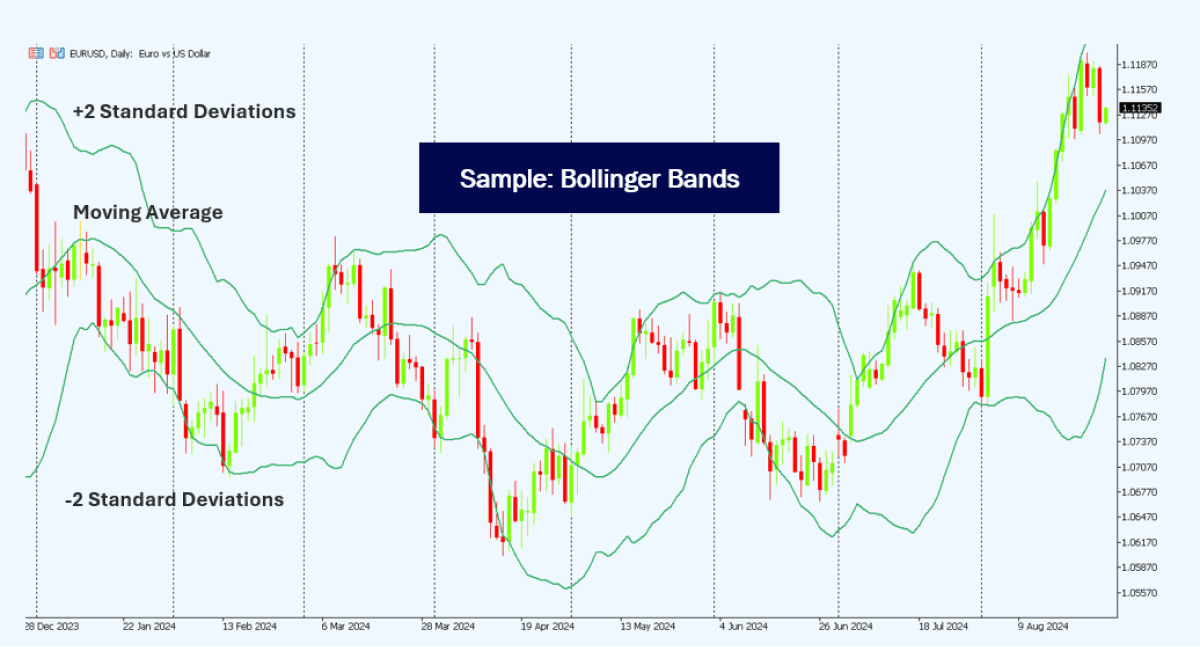
Example: Throughout mid-2022, Ethereum (ETH/USD) traded consistently within defined Bollinger Bands. Traders profited by buying near the lower band (indicating oversold conditions) and selling near the upper band (indicating overbought conditions).
Why It Works: Price channels offer a systematic approach to identifying overbought and oversold conditions. By clearly displaying volatility and typical trading ranges, they enable traders to exploit recurring patterns for predictable gains. Using such objective visual tools also reduces emotional biases, supporting disciplined trading decisions.
Volatility Trading Strategies with ATR – One of the Best Indicators for Swing Trading
Volatility is a critical consideration in swing trading. Rather than aiming to hit exact highs and lows, traders seek to capitalize on price swings to lock in profits.
The Average True Range (ATR) is a widely used volatility indicator that measures the average price movement of an asset per candlestick, typically over 14 periods—daily, weekly, or monthly. An ATR rising above its simple moving average often signals strong price momentum and potential breakout opportunities. ATR can be adjusted for shorter or longer periods to align with a trader’s specific volatility preferences.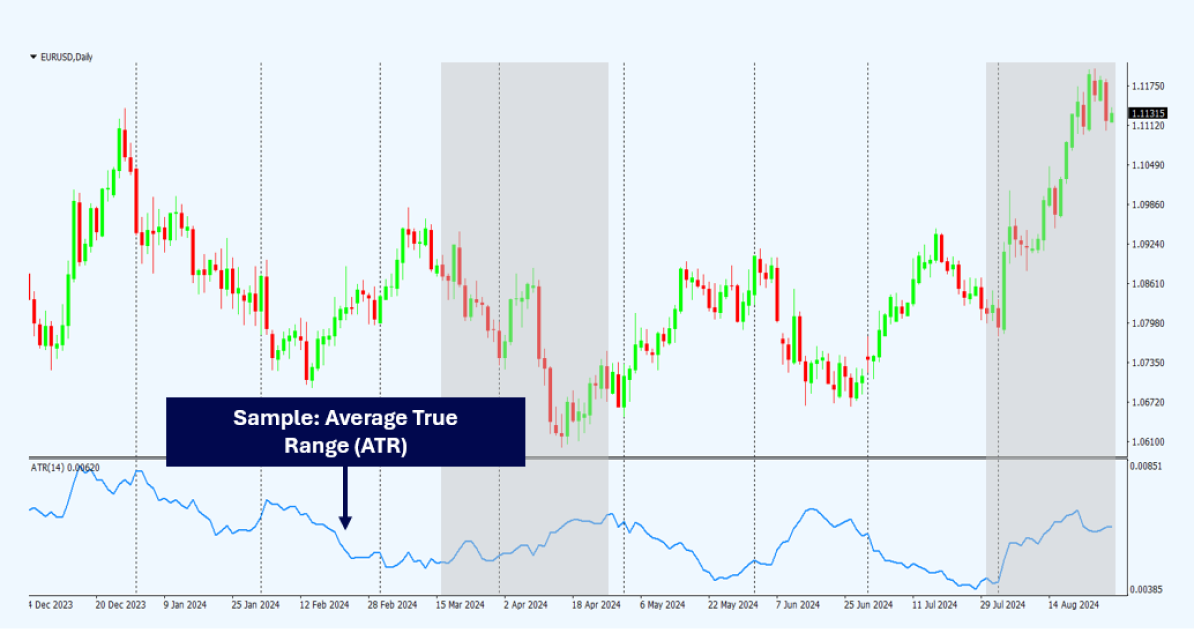
Example: Bitcoin (BTC/USD) has exhibited significant volatility since 2020——noting how Crypto CFDs amplify exposure to these swings as reflected in ATR values. Traders monitoring ATR fluctuations identified profitable opportunities during heightened volatility, maximizing gains from rapid price movements.
Why It Works: Volatility trading excels because market fluctuations intensify during periods of uncertainty, economic data releases, or major news events. Measuring volatility enables traders to strategically position themselves to capture substantial profits in dynamic markets, making this approach well-suited for short-term trading strategies.
Fibonacci Retracement: A Core Swing Trading Strategy
Fibonacci Retracement is among the most powerful indicators for identifying support and resistance levels on an asset’s chart. By analyzing significant price swings and overlaying Fibonacci ratios, traders can anticipate potential retracement levels to time entries and exits effectively. Common retracement levels include 38.2%, 50%, and 61.8%, which indicate likely price pullback zones.
The following chart illustrates a Fibonacci retracement, showing how price reverses direction as it approaches resistance and support bands (highlighted in red).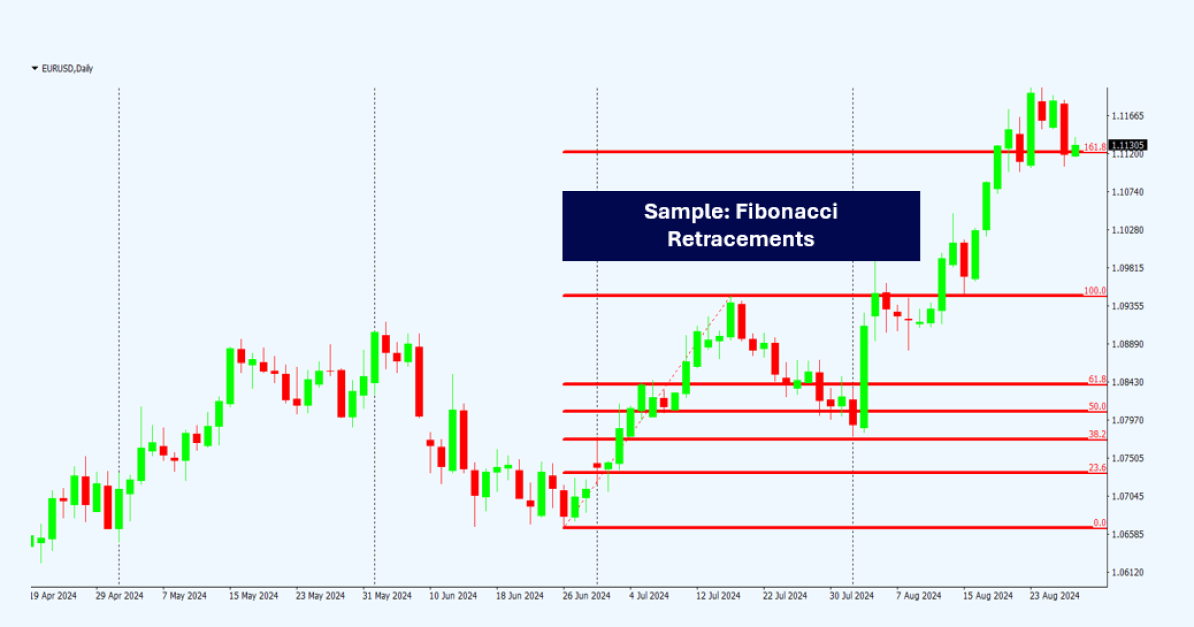
Example: In late 2022, GBP/USD experienced a strong rally followed by a retracement to the 50% Fibonacci level. Traders entering long positions at this support level realized profitable returns as the price rebounded.
Why It Works: Fibonacci retracements are effective because they capitalize on common market behaviors and trader psychology. These levels are widely recognized and used globally, creating a self-fulfilling effect that enhances their reliability as key reference points for trading decisions.
Discipline & Risk Management in Swing Trading Strategies
Discipline is critical for executing a successful trading plan. The relatively short-term nature of swing trading further underscores the importance of a well-defined plan with clear entry and exit rules. Proper planning helps maintain focus and reduces emotion-driven decisions. Profit and loss potential also depends on asset volatility, making the use of risk-to-reward ratios (R/R) and stop-loss orders essential for capital protection and balanced risk management.
Example: Imagine a trader identifies a swing trade opportunity in Gold (XAU/USD), targeting a $1,200 profit while risking a maximum loss of $300, resulting in a favorable Risk-to-Reward Ratio (RRR) of 1:4. By placing a stop-loss accordingly, the trader limits exposure to adverse market moves..
Why It Works: Effective risk management and discipline support trading longevity and profitability. A structured approach minimizes emotional trading and preserves capital during inevitable downturns. Clear risk-to-reward parameters contain potential losses, enabling consistent profitability and sustainable trading over time.
R/R Ratio Illustration
Consider a trade with a potential profit of $2,000 but a possible loss of $500 if unsuccessful.
- Risk (Loss potential): $500
- Reward (Profit potential): $2,000
- R/R Ratio: 1:4 (risking $1 to potentially gain $4)
In this example, the R/R ratio is favorable, indicating the reward outweighs the risk, making the trade attractive. Conversely, a less favorable ratio such as 1:1 or 2:1 implies higher risk for lower reward, reducing appeal.
Incorporating an R/R ratio into your strategy facilitates informed decision-making and better downside risk management. Pairing swing trading strategies with stop-loss orders ensures automatic trade exits at predetermined levels, safeguarding capital.
Maintaining a trading journal is also advisable to track trades, stay focused, and analyze performance. Recording strategies, outcomes, and insights—whether via traditional notes or digital spreadsheets—helps refine your approach and enhance results over time.
Conclusion: Is Swing Trading Profitable?
Swing trading offers a flexible and tailored method to capture short-term market momentum. By developing a comprehensive swing trading plan and mastering the tools and techniques outlined here, you can craft an approach aligned with your trading style and financial objectives.
With discipline and a strategy suited to your goals, you can implement effective swing trading techniques across various asset classes and instruments.
As with all trading and investing, ongoing education, research, and experimentation are vital for long-term success. Staying informed and committed throughout your trading journey will unlock swing trading’s potential and support your financial ambitions.
Our team is here to support you at every stage. Whether you’re new to trading or expanding your portfolio, we provide the expertise and assistance needed to succeed and grow.
Remember: Trading CFDs involves risks—learn how margin trading works and apply appropriate risk controls—so with the right strategies and mindset, trading can be a rewarding experience.
Ready to Get Started?
Sign up now and access global markets in under three minutes.
Start Trading, or Try our Demo Account


