


Definition and Purpose of the Heikin Ashi Candle

What Is Heikin Ashi
Heikin ashi (often also written as heikin-ashi) is a charting technique that looks similar to Japanese candlesticks but calculates each candle using averages rather than the asset’s actual open and close.
Instead of plotting every small fluctuation, the heikin ashi chart filters some of the noise. The result is:
Trends appear smoother.
Runs of same-coloured candles are easier to spot.
Many short-term whipsaws disappear from the chart.
In fast markets such as Indian index futures or liquid forex pairs, this can help you focus on the dominant trend instead of every tick.
How Heikin Ashi Extends Normal Candlestick Charts
Traditional candlesticks are built directly from the period’s open, high, low and close. They are very precise but can become visually noisy, especially on intraday time frames that many Indian traders use during NSE market hours.
Heikin ashi candles take the same price data but:
Recalculate the open and close as averages.
Use those averages to build a smoother sequence of candles.
In practice, you still use the underlying real-price chart to place orders and manage risk, but you can read the trend from the heikin ashi plot.
Why Traders Use Heikin Ashi Candles
Common reasons active traders add heikin ashi to their toolkit include:
Noise reduction: Fewer random alternations between green and red candles.
Clearer trends: Strong moves show as long runs of same-colour candles.
Simpler decisions: Easier rules for “stay in” versus “stand aside”.
For example, a day trader in India might hold a Nifty long position as long as the heikin ashi candles stay mostly bullish, only tightening stops when the candles start to shrink and show opposite wicks.
How Heikin Ashi Candles Are Constructed
The Idea Behind Using Averages
Heikin ashi candles are built on a simple idea: instead of plotting each bar with its exact open and close, you blend this information using averages.
This blended price acts like a smoothing filter. It does not change the underlying market; it only changes how you see it on the chart.
The Heikin Ashi Candle Formula
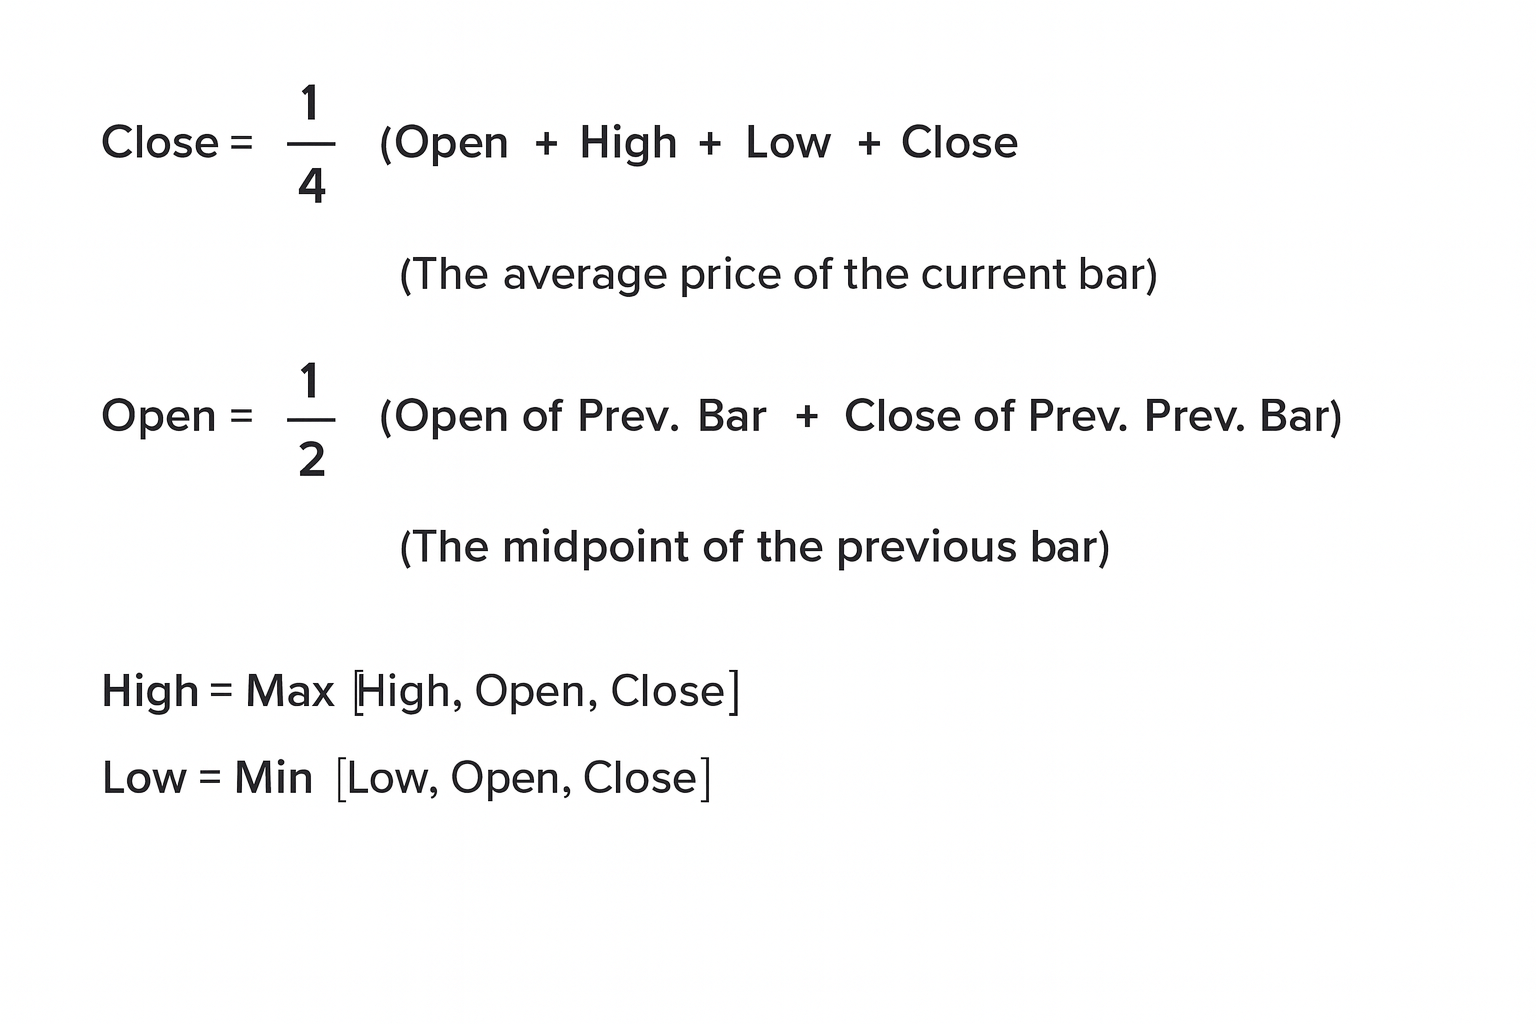
The heikin ashi candle formula is:
Heikin Ashi Close = (Open + High + Low + Close) ÷ 4
Heikin Ashi Open = (Previous Heikin Ashi Open + Previous Heikin Ashi Close) ÷ 2
Heikin Ashi High = Maximum of High, Heikin Ashi Open, Heikin Ashi Close
Heikin Ashi Low = Minimum of Low, Heikin Ashi Open, Heikin Ashi Close
Two points matter for strategy:
The open depends on the previous heikin ashi candle, so each bar is linked to the last.
The high and low include both the real high and low and the averaged values.
Because of this, heikin ashi candles will not match actual market opens and closes.
Impact on Candle Shape and Timing
This averaging has two important effects:
Smoother sequences: Trends often show as more consistent blocks of candles.
Lag: Turning points on the heikin ashi chart appear after they happen in the real price.
For example, if Bank Nifty suddenly reverses intraday, your normal candlestick chart will show the shift immediately. The heikin ashi chart will typically take one or two candles to clearly confirm the change.
You are trading the underlying market, not the averaged line, so you always need to keep a real-price chart visible next to the heikin ashi chart.
Heikin Ashi Versus Standard Candlesticks
Visual Differences
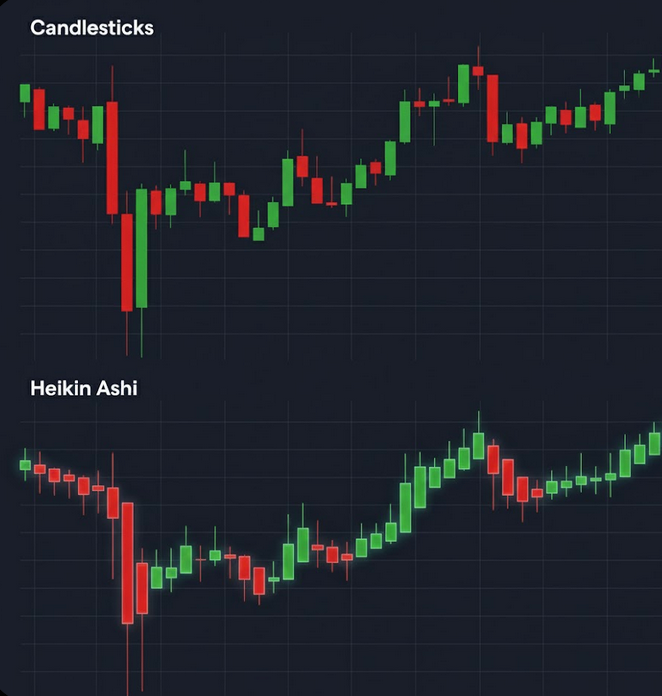
On a standard candlestick chart, choppy sessions show as mixed candles: green then red, long wicks on both sides and frequent intrabar reversals.
On a heikin ashi chart:
Strong uptrends often show as a series of bullish candles with small or no lower shadows.
Strong downtrends show as a series of bearish candles with small or no upper shadows.
Sideways or turning phases show as shorter candles with wicks on both sides.
If you compare daily charts of Nifty on both styles, you will usually find the heikin ashi version much easier to skim for trends.
Functional Differences
Functionally, the main differences are:
Price representation
Candlesticks: exact OHLC from the exchange.
Heikin ashi: averaged values, not suitable for exact entries or exits.
Signal behaviour
Candlesticks: faster but noisier, more false turns.
Heikin ashi: slower but cleaner, fewer flips in direction.
This is why many experienced traders use heikin ashi for trend reading, but still rely on traditional candlesticks or line charts for precise order placement.
When to Prefer One Over the Other
You might favour:
Heikin ashi when:
You want to hold swing positions in equities or indices.
You tend to exit trends too early because of minor pullbacks.
Standard candlesticks when:
You need exact levels for limit orders, stop losses or options strikes.
You are scalping or trading very short-term patterns.
Often, the best approach is not “either or” but “both together” on the same screen.
How To Read Heikin Ashi Charts
Candle Colours and Trend Direction
The starting point is simply reading candle colour and size:
Long bullish candles with small or no lower wicks usually mean a strong uptrend.
Long bearish candles with small or no upper wicks usually mean a strong downtrend.
Small-bodied candles with wicks on both sides signal indecision or fatigue.
On a daily heikin ashi chart of Nifty 50, for example, a strong rally often appears as several consecutive bullish candles with minimal lower shadows. Many traders stay with the trend until the candles start to shrink and show opposing shadows.
Wicks and Trend Strength
Shadows or wicks carry special meaning on heikin ashi:
No lower wick in an uptrend: buyers are firmly in control; pullbacks are shallow.
No upper wick in a downtrend: sellers dominate; rallies are getting sold quickly.
Both upper and lower wicks: the market is testing both sides; momentum is weaker.
This allows you to quickly assess whether a trend in EUR USD or USD INR is still strong or starting to tire.
Recognising Heikin Ashi Bullish and Bearish Reversals
A heikin ashi bullish reversal often has this sequence:
Strong bearish candles with small or no upper wicks.
One or more small-bodied candles with wicks on both sides (indecision).
A first clear bullish candle, sometimes with no lower shadow.
A heikin ashi bearish reversal sequence is the mirror image:
Strong bullish candles with small or no lower wicks.
One or more short candles with wicks both sides.
A clear bearish candle that closes near its low.
These patterns do not guarantee a trend change, but they give context. Many traders wait for at least one or two confirmation candles before acting, especially in volatile Indian stocks around earnings or macro events.
Practical Trading Uses and Signals In Indian Markets
Staying in Trends Longer
One classic use of heikin ashi is to stay in winning trades instead of exiting at the first sign of noise.
Example scenario on Bank Nifty futures:
You enter long after a breakout from a consolidation range.
On the normal candlestick chart, the next few days show small intraday reversals and mixed candles.
On the heikin ashi chart, you still see a clean block of bullish candles with almost no lower shadows.
A simple rule could be:
Stay in as long as the heikin ashi candles remain bullish without significant opposing wicks.
Tighten stops or scale out when candles shrink and start to show upper shadows or neutral bodies.
This kind of rule-based approach is what traders usually mean when they talk about a heikin ashi candle strategy for trend following.
Filtering False Breakouts and Noise
Heikin ashi charts can also help filter false signals:
In a sideways market, you will often see small candles with long wicks on both sides.
Breakouts that matter tend to be followed by a sequence of strong same-colour candles.
For an Indian trader watching USD INR on a four-hour chart, a single breakout candle is often not enough. Waiting to see whether the heikin ashi chart prints two or three strong follow-through candles can help you avoid many false starts.
Integrating Heikin Ashi With Other Tools
Heikin ashi works best when combined with other elements, such as:
Support and resistance levels on spot price.
Moving averages (for example 20 or 50 period) as dynamic trend filters.
Volume or open interest on NSE and MCX contracts.
You might, for instance:
Use a moving average to define the broad trend.
Use heikin ashi colour and wicks to decide when the trend is strong enough to participate.
Use support and resistance on the real-price chart for entries, stops and targets.
This keeps your analysis grounded in actual market prices while still benefiting from the clearer visual cues that heikin ashi provides.
Advantages and Limitations Of Heikin Ashi Candles
Key Benefits
The main advantages of heikin ashi candles include:
Cleaner trend visualisation: Trends stand out more clearly than on standard candlesticks.
Fewer emotional reactions: Reduced noise can make it easier to follow your plan.
Versatility across markets: Useful on equity indices, commodities and major forex pairs that many Indian traders follow.
For longer-term positions in Indian gold ETFs or index funds, the smoother appearance can help you avoid reacting to every short-lived dip.
Drawbacks and Reliability Concerns
However, there are important limitations:
Lagging nature: Because of averaging, turns on the heikin ashi chart appear after the fact.
No exact price reference: You cannot set precise stop losses or profit targets from the heikin ashi close.
Not a standalone system: On its own, it does not tell you where to enter, how much to risk or how to size positions.
A professional trader should treat heikin ashi as a visual aid, not as the sole basis for decision-making. Orders, risk limits and position sizing should always be anchored to actual traded prices that you see on your main chart or order book.
Why It Should Be Combined With Other Indicators
Because heikin ashi is only a transformation of price, it adds no new information; it only rearranges what is already there.
This is why many serious traders combine it with:
A trend filter (such as a moving average, trendline).
Clear money-management rules aligned with their risk limits and, where relevant, local regulations.
For traders in India trading through SEBI-regulated brokers, this also makes it easier to document and justify your approach as a structured process rather than a visual guess.
Putting Heikin Ashi Into Your Trading Plan
A Simple Process To Start Using Heikin Ashi
A practical way to incorporate heikin ashi without overhauling your whole system is:
Keep your existing chart (candlestick with chart pattern or line) as the primary window.
Add a heikin ashi chart of the same instrument and time frame in a second window.
Define basic rules such as:
Trade only in the direction of the dominant heikin ashi colour.
Avoid new trades when candles are small with wicks on both sides.
Use your existing entry and exit rules but apply them only when the heikin ashi chart agrees with the trend.
Over a sample of trades in Nifty, Bank Nifty or major forex pairs, you can then evaluate whether this filter improves your win rate or average reward to risk.
Risk Management and Position Sizing
Heikin ashi does not replace risk management. You still need to decide:
How much of your capital to risk per trade.
Where to place stop losses in the real-price chart.
How to size positions, taking into account volatility and any margin rules that apply in your account.
Indian traders must also consider local constraints, such as overnight margin requirements on NSE and any currency exposure rules for USD INR and cross-currency derivatives. Heikin ashi can guide you on when conditions are favourable, but it cannot manage how much you should risk.
Example Of A Basic Heikin Ashi Candle Strategy
A simple swing trading strategy template could be:
Market: Nifty futures, daily chart.
Trend filter: 50-day moving average of actual closing prices.
Heikin ashi rules:
Go long only if price is above the 50-day average and the last two heikin ashi candles are bullish with small or no lower shadows.
Move stop loss to breakeven once a sequence of three or more strong bullish candles has formed.
Consider exiting when you see a clear heikin ashi bearish reversal pattern or a close back below the moving average (on real-price chart).
This is not a guaranteed profitable method, but it illustrates how you can frame heikin ashi candles as one logical component inside a broader, rules-based trading plan.
Conclusion
Heikin ashi candles offer a different lens for viewing markets. By averaging price data, a heikin-ashi candle smooths out small fluctuations so that trends and potential reversals stand out more clearly. For Indian traders navigating instruments like TATAPOWER, SBIN, USD INR or gold-related products, this can be particularly useful in volatile periods when ordinary candlesticks become hard to read.
At the same time, heikin ashi charts do not show real traded prices and will always lag at turning points. The most robust approach is to use them alongside standard charts, support and resistance analysis, and disciplined risk management. Treated as a visual aid within a complete trading process, heikin ashi can help experienced traders stay aligned with the underlying trend instead of reacting to every short-term fluctuation.


