


What is Fibonacci Retracement?
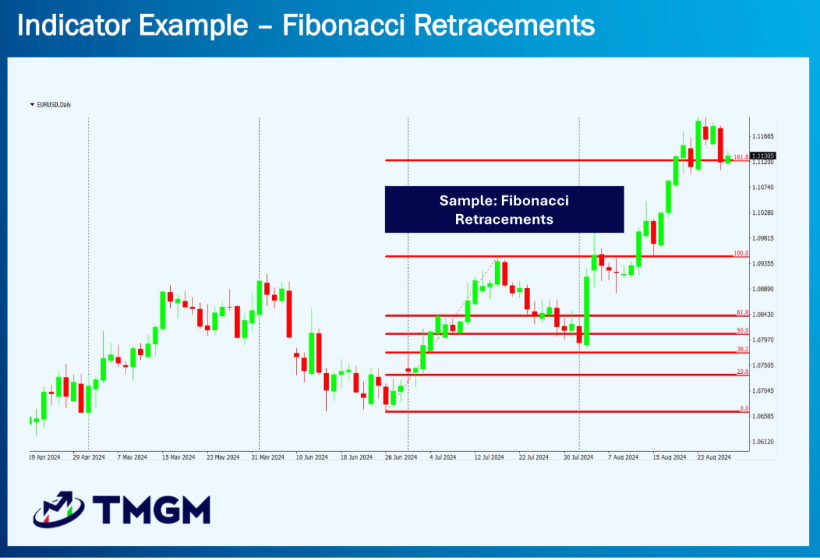
Figure 1. Chart of a Fibonacci Retracement Tool being used on a forex currency chart.
Fibonacci retracement is a technical indicator used by traders practicing technical analysis to identify potential support and resistance levels. It uses ratios derived from the Fibonacci sequence to help predict where a price may pause or reverse during a pullback in a trend.
Important Fibonacci retracement settings used by professional Fibonacci trader include:
23.6%
38.2%
50% (not a Fibonacci number, but widely used)
61.8%
78.6%
These numbers are visualized on the price chart to identify potential support and resistance levels or supply and demand reversal zones. These ratios are derived from the relationships between numbers in the Fibonacci sequence. The 61.8 percent level is the most well-known because it is connected to the Fibonacci retracement golden ratio, which many traders closely monitor.
These levels come straight out of the Fibonacci sequence — a string of numbers where each value is the sum of the two before it: 0, 1, 1, 2, 3, 5, 8, 13, 21, 34, 55, 89, 144, 233, and onward. The sequence traces back to ancient Indian and Arabic mathematics, centuries before Leonardo of Pisa introduced it to Europe in the 13th century via his book, Liber Abaci. The book introduced the sequence to a wider audience and helped promote the adoption of the more efficient Hindu-Arabic numeral system over Roman numerals.
Divide any number by the one after it and you get roughly 0.618 — the source of the 61.8% level; divide by the number two places higher for 0.382 (38.2%), or three places higher for 0.236 (23.6%). Divide a number by the one before it and the ratio settles near 1.618 — the Golden Ratio, or Phi — the same proportion that recurs throughout nature. The 78.6% level is the square root of 0.618, while 50% is added by convention rather than being a true Fibonacci ratio.
How to Draw Fibonacci Retracement for Trading
Drawing Fibonacci Retracement levels is a simple process using the built-in tool on most trading platforms. The key is to correctly identify the start and end points of a significant price move (swing high and swing low). This is the step most traders get wrong: the swing high and swing low you pick must be obvious, structurally significant turning points — not minor intraday wiggles. If two traders anchor the tool to different swings, they read different levels off the same chart, so favour the clearest recent swing high and swing low. When a level almost lines up with an obvious prior high or low, it is often worth nudging the anchor to that exact swing so the levels fit the chart's real structure.
Note: Fibonacci Retracement finds the support and resistance levels of a particular trend, so this can be used in many scenarios like Day Trading or even Scalp Trading.
Step 1: Identify The Trend
Determine whether the market is an uptrend or a downtrend. This is crucial, as Fibonacci retracement works best in trending markets, hence it is more beginner friendly with swing trading strategies.
Step 2: Select the Fibonacci Retracement Tool
Most charting software provides a specific tool for this (often a 'F' symbol or found in the drawing tools menu).
Step 3: Apply the Fibonacci Tool
For an uptrend:
Click and hold your cursor at the significant swing low (the bottom of the move), then drag it up to the most recent swing high (the peak of the move).
For a downtrend:
Click and hold your cursor at the significant swing high (the top of the move), then drag it down to the most recent swing low (the trough of the move).
Step 4: Watch for Potential Support and Resistance
When the price approaches a Fibonacci level, observe how it behaves. The level can act as support during an uptrend or resistance during a downtrend. Importantly, these roles can flip: once price breaks through a level, a former support often becomes resistance, and a former resistance becomes support — so the same level keeps giving information after it is crossed. These reactions may indicate potential buying or selling opportunities.
Step 5: Combine Fibonacci with Other Tools
Fibonacci is more effective when used with other technical tools. You can combine it with trendlines , moving averages, RSI, or chart patterns. Many traders also use it with Elliott Wave Fibonacci analysis for added clarity.
Step 6: Use Multiple Timeframes
Applying Fibonacci retracement on several timeframes can help identify zones where multiple levels align. These alignments create stronger trading areas.
Pro Tip: When charting highly volatile instruments such as crypto or fast-moving INR pairs, switch the Fibonacci tool to log-scale calculation — on a logarithmic chart the levels are spaced by percentage distance, which is what the ratios actually measure, so they land where price is more likely to react.
Step 7: Practice Before Trading Live
Like any trading tool, mastering Fibonacci retracement takes time and practice. Start with paper trading to gain confidence before using it in live trading.
What Does Each Fibonacci Retracement Level Mean?
Each level reflects a different depth of pullback, and reading them tells you how much strength is behind the move.
- 23.6% — a shallow pullback. Appears in strong, fast trends where price barely pauses before continuing.
- 38.2% — a healthy trend pullback. A respected level; buyers or sellers still hold clear control.
- 50% — the halfway mark. Not a true Fibonacci ratio, but widely watched because markets often retrace half a move before resuming.
- 61.8% — the golden ratio, or "golden pocket." The most closely watched level; strong reversals frequently form here.
- 78.6% — a deep pullback. Price gives back almost the entire move. Many traders treat a decisive break beyond 78.6% as a line in the sand: violate it and the original trend is likely over rather than merely pausing.
How to Setup and Use Fibonacci Retracement Levels for Entry, Exit and Stop Losses?
To optimize your Fibonacci Retracement tool, toggle the key levels to 0.382, 0.500, and 0.618. Deselect extension levels (like 1.618) to avoid chart clutter. Many traders highlight the "Golden Zone" (between 0.5 and 0.618) by coloring it gold and using standard colors for other lines.
- Entry. Once the trend is set and the tool is drawn, wait for price to pull back into a level (commonly 38.2%–61.8%) and show a reaction — a reversal candle or a bounce — before entering in the trend's direction. Entering at a level without confirmation is the common mistake.
- Stop-loss. For a long, place the stop just below the next Fibonacci level beneath your entry; for a short, just above the next level. This ties the invalidation point to structure.
- Targets. Use the prior swing high/low, or Fibonacci extension levels such as 127.2% and 161.8%, to set objectives beyond the original move.
As a rule, treat a Fibonacci level as confirmation, not a signal on its own: conviction is strongest when a level lines up with several factors at once — price reacting at, say, 61.8% and a reversal candlestick and the level sitting on prior support or resistance and above-average volume on the bounce. The more that stack, the more reliable the setup.
How to use Fibonacci Retracement in Trading? USD/INR Example
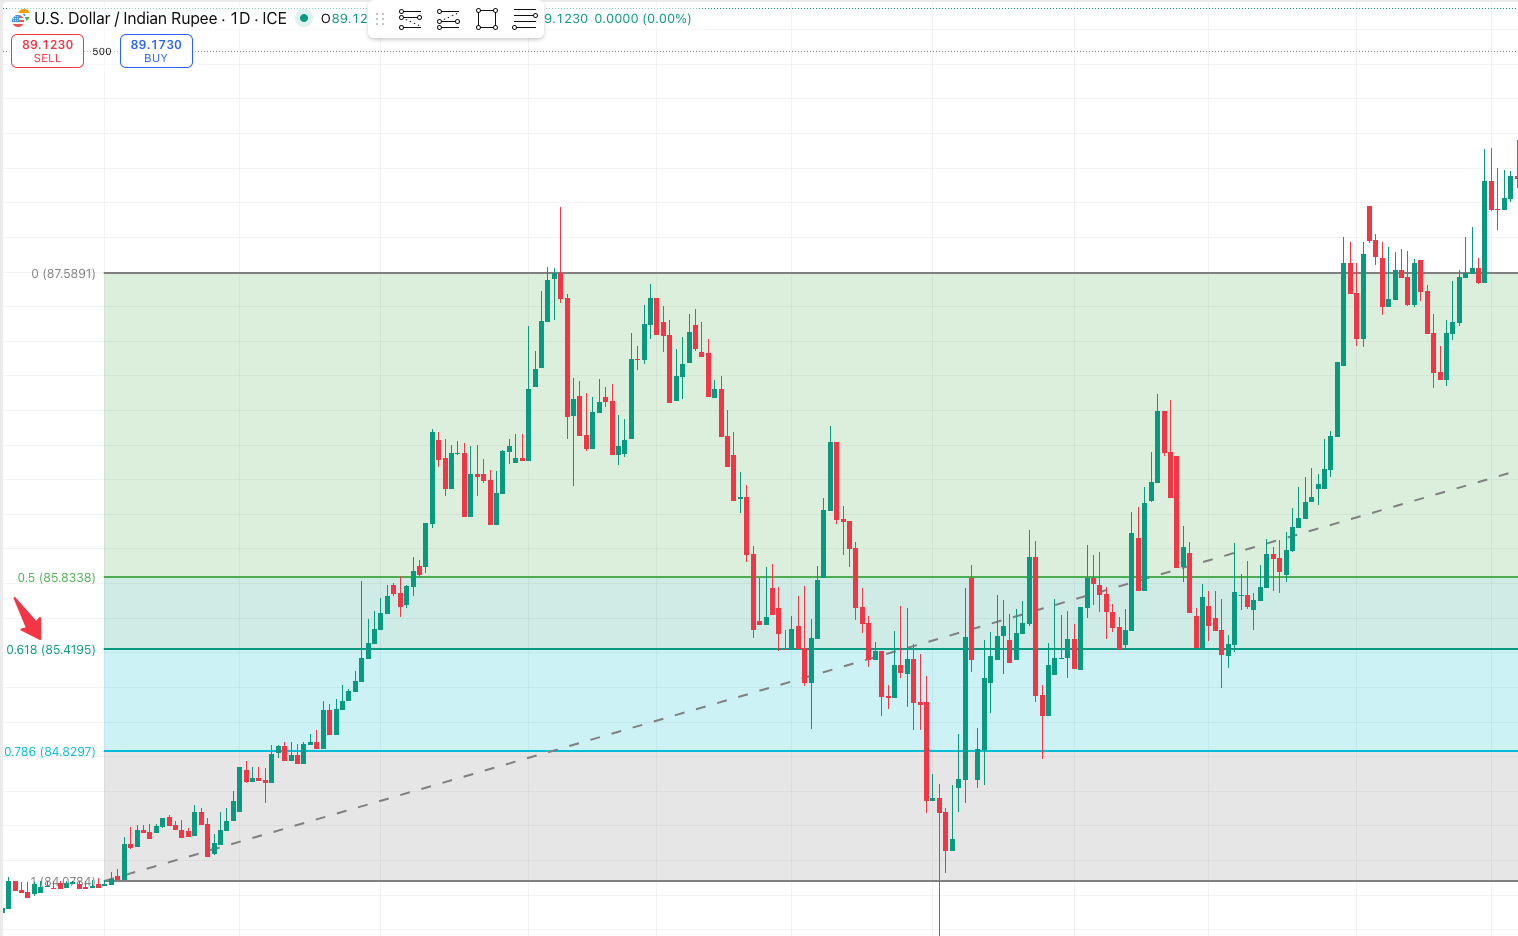
Figure 2: USD/INR chart using Fibonacci Retracement to observe price stabilization and reversal, centred around the golden ratio level (61.8%, or 0.618), emphasized by the red arrow.
In trading, the 61.8 percent retracement level (written as 0.618 in decimal form) is considered the most influential. Many traders watch whether price reacts around the 0.618 level, because the market often finds support or reverses there. You can verify any level with simple arithmetic rather than relying on the tool. Take a USD/INR up-move from a swing low of 82.00 to a swing high of 84.00 — a range of 2.00. The 61.8% retracement sits at 84.00 − (0.618 × 2.00) = 84.00 − 1.236 = 82.76. The same formula — swing high minus (ratio × range) in an uptrend, swing low plus (ratio × range) in a downtrend — gives every other level. For a downtrend the logic simply flips: if USD/INR fell from 84.00 to 82.00 (a range of 2.00), the 61.8% retracement where a bounce might stall sits at 82.00 + (0.618 × 2.00) = 83.24. The platform draws these automatically, but knowing the maths tells you exactly where each level comes from.
Notice how the price gets gravitated towards the 0.618 to find both support and resistance. This natural property made Fibonacci extremely useful for traders. Usually, as all support and resistance tools, the longer the timeframe when the tool is drawn on, the stronger the reliability.
Meaning, a Fibonacci retracement drawn on the weekly chart tends to give more reliable support and resistance on the daily chart than one drawn on a lower timeframe — higher-timeframe levels generally carry more weight, though no level is guaranteed to hold.
What Is the Difference Between Fibonacci Retracement and Fibonacci Extensions?
Fibonacci Retracement levels measure how far a pullback travels within a move while Fibonacci extension levels project how far price may travel beyond the prior swing once the trend resumes — making them the profit-target counterpart to retracements.
To draw them, you mark the same swing move, then the tool plots levels past 100%. The most-watched extensions are 127.2%, 161.8% and 261.8%: traders use them to set targets after price breaks out of the retracement zone and continues in the trend's direction. On the drawing tool itself, the levels between 0% and 100% are the retracement (pullback) zone, while the values above 100% are the fibonacci extension levels — the same swing, read past the original move. In short — retracement finds where a pullback may end; extension finds where the next move may reach.
Common Mistakes Traders Make with Fibonacci Retracement
Fibonacci tools are used by professionals but they still have limitations:
Subjective Analysis
Different traders choose different swing highs and lows. This leads to different retracement levels.
Never a Standalone Tool
Fibonacci retracement should always be combined with other trading tools and strategies to create confluence.
Ignoring Market Characteristics & Conditions
The tool works best in clean trending conditions. In a ranging (sideways) market — where price moves between horizontal support and resistance without making higher highs or lower lows — there is no clear swing to anchor to, so the levels lose reliability. Extremely volatile conditions reduce reliability too.
Other Advanced Fibonacci Tools
Besides Fibonacci Retracement, you can explore additional tools that expand your strategy:
Fibonacci Extensions
Used to project potential profit targets beyond the retracement levels using Fibonacci Sequence or Fibonacci Series numbers.
Fibonacci Fans
Lines drawn from a swing high or swing low that create a fan-shaped pattern, helping traders understand angled support or resistance.
Fibonacci Time Zones
Vertical lines based on Fibonacci intervals that may signal possible timing of market reversal.
Fibonacci Clusters
When multiple Fibonacci levels from different swings or timeframes overlap, they create stronger reaction zones.
Elliott Wave Fibonacci
Elliott Wave and Fibonacci analysis are often used together in trading to identify support and resistance levels and potential price targets.
These techniques are also useful in markets like forex, indices, metals, and crypto trading.
How Accurate Is Fibonacci Retracement?
Fibonacci retracement is a probabilistic tool, not a precise predictor — price does not have to stop at any level. In fact, one analysis cited by Investopedia put the standalone success rate at around 37% (a 63% failure rate), which is exactly why professionals use the levels as confirmation rather than a signal on their own. Accuracy improves markedly when a level coincides with other evidence — a reversal candle, a moving average, prior support or resistance, or an aligning level on a higher timeframe — and when it is drawn on a clean, well-defined trend. Used that way, as one input among several, Fibonacci becomes a framework for higher-probability decisions rather than a guarantee.
Learning and trading Fibonacci Retracement with a Regulated Broker.
Fibonacci Retracement is one of the most popular tools used by traders, hence most brokers provide a powerful trading environment for beginners who want to learn how to draw Fibonacci retracement correctly.
The important thing to remember is that Indian Traders must adhere to SEBI (Securities and Exchange Board of India) regulations and the approved list of exchanges and brokers when trading Forex, Stocks, Commodities or even Crypto.
Before Trading:
SEBI Approved list of Exchanges include:
National Stock Exchange (NSE)
Bombay Stock Exchange (BSE)
Multi Commodity Exchange (MCX)
National Commodity & Derivatives Exchange (NCDEX)
Metropolitan Stock Exchange of India Ltd. (MSEI)
India International Exchange (India INX)
However, TMGM provides a wide range of resources for beginners to learn trading. These valuable resources include:
MetaTrader 4 and 5 Integration
TMGM offers MT4 and MT5 platforms with built-in Fibonacci tools. You can easily apply Fibonacci retracement settings to any chart and learn how to draw fibonacci retracement.
Educational Resources
TMGM offers many other educational materials like blog articles, E-books, Courses, Market News and Webinars that often cover advanced trading techniques, including Fibonacci retracement. Take advantage of these resources to enhance your understanding and application of this tool.
Risk Management
Always apply proper risk management when using any trading methods and strategies. Use the stop-loss and take-profit features to manage your risk.
Demo Account Practice
Before applying any tools in live trading with a SEBI Approved Broker, you can use TMGM's beginner-friendly demo account feature to practice and refine your strategy without risking real capital.
Combining TMGM's professional educational materials with robust demo-trading infrastructure, can enhance your trading strategy and decision-making process. However, always remember that no trading tool is infallible, and it's crucial to use Fibonacci retracement as part of a comprehensive trading plan that includes thorough market analysis and strict risk management.




















