

Trading
Explore a wide range of markets with competitive pricing, deep liquidity, and advanced trading tools.
Learn More 
Platform
Trade seamlessly with TMGM's powerful platform, built for speed, precision, and a superior trading experience.
Learn More Trading Platform
Academy
Learn the fundamentals of trading with beginner-friendly resources, including guides, webinars, and market insights.
Learn More News & Analysis
Get real-time market updates and expert analysis to stay ahead of trading opportunities
Learn More News & Analysis
About
Learn what sets TMGM apart — our global presence, regulatory strength, and commitment to innovation in trading.
Learn More Why Choose TMGM
Sponsorship
After five consecutive losing weeks, could Bitcoin face more turbulence?
Downside pressure continues to leave Bitcoin (BTC) searching for support, with a slide below $70,000 as several headwinds threaten further losses for the Crypto King. With the widely expected “Uptober” rally failing to take shape, sustained selling and widespread liquidations have instead strengthened the “Rektober” narrative. The term describes an October characterised by steep losses rather than the gains traditionally associated with the month.
The decline has carried over into November. Muted institutional demand, cautious positioning in derivatives and weakening on-chain indicators together point to waning market confidence.

Reinforcing the bearish outlook, lingering inflation worries, a firmer US Dollar (USD), the Binance hack and MSCI’s decision to exclude major Bitcoin treasury holding companies from its global indices are weighing on risk-sensitive assets. Together, these factors raise the likelihood of a major storm approaching the Crypto King.
Could sticky inflation bring rate hikes back into focus?
Liquidity conditions strongly influence the largest cryptocurrency by market capitalisation, leaving it exposed to tighter monetary policy. As interest rates rise and liquidity shrinks, the opportunity cost of holding non-yielding assets such as BTC increases, typically putting pressure on them. Investors instead favour safe-haven assets, including the Greenback and US Treasury bonds.
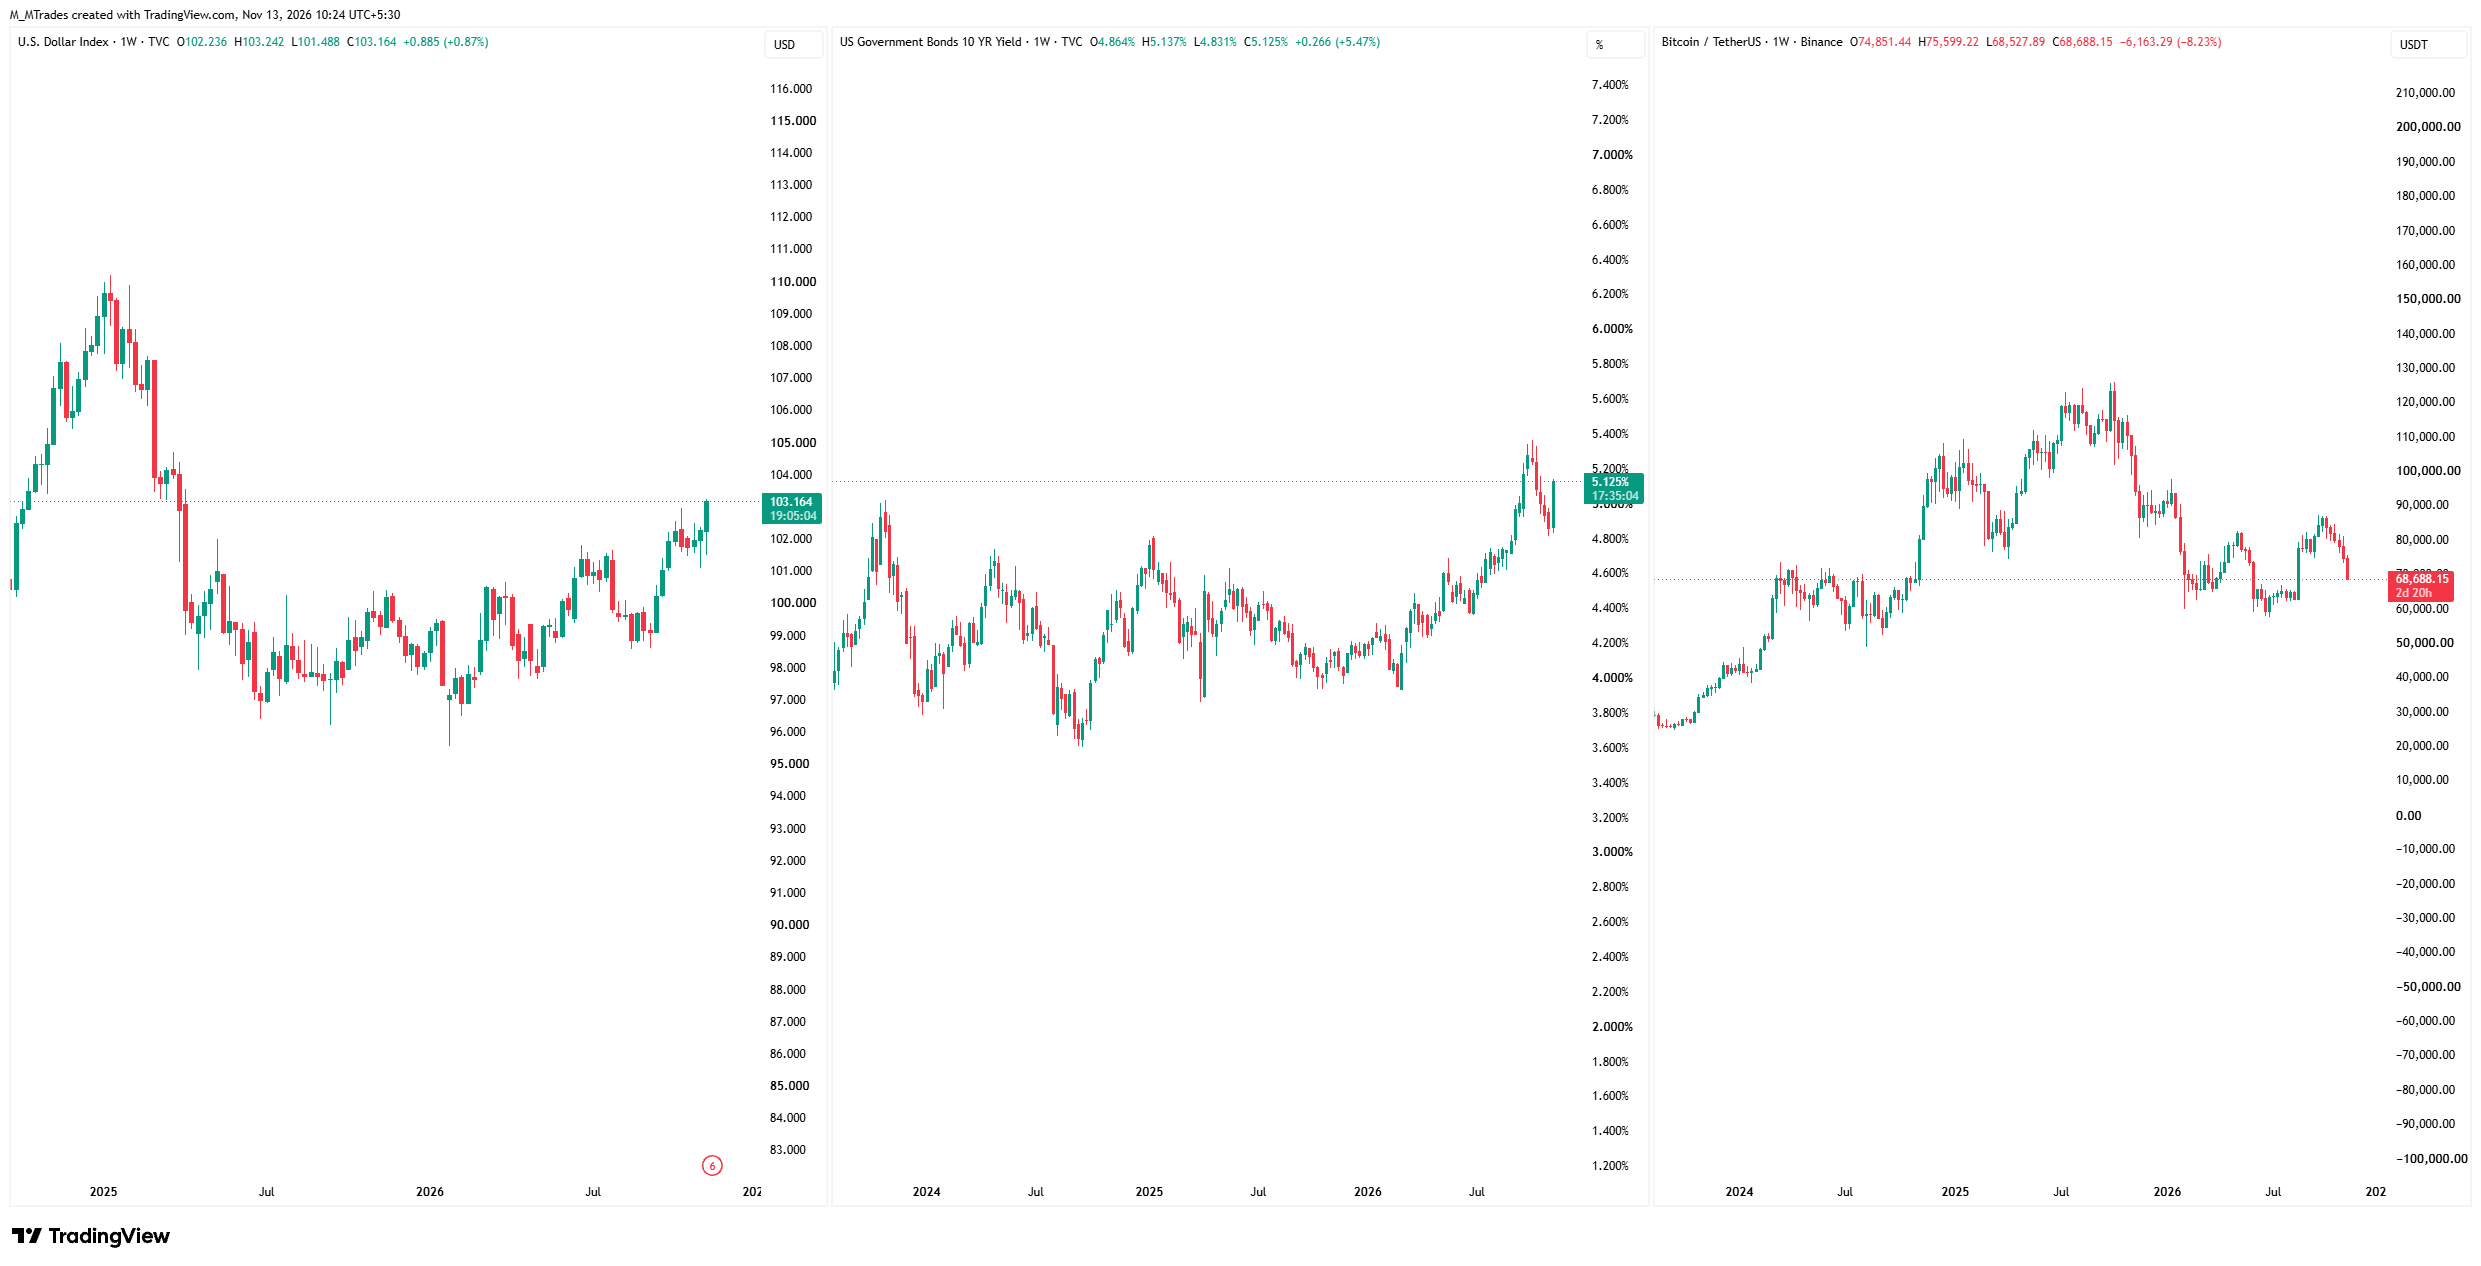
Through November, the macroeconomic environment has largely supported the Federal Reserve (Fed) in its efforts to keep monetary policy relatively restrictive. This has underpinned USD while weighing on risk assets.
Released in the first week of November, October’s stronger-than-expected US employment figures indicated that the US labour market continues to show resilience. This left the central bank with less incentive to loosen policy. Subsequently, US Consumer Price Index (CPI) figures for October came in above expectations, reinforcing expectations that monetary conditions would tighten.
The CPI release, in particular, increased the likelihood of a Fed interest rate hike in December. According to Fed Governor Christopher Waller, an upside surprise in core CPI could lead him to consider a larger 50-basis-point (bps) increase at the December 8–9 policy meeting. Restricting the hike to 25 bps, he added, could jeopardise the Fed’s credibility.
With inflation concerns mounting, this hawkish stance has lifted both 10-year US Treasury yields and the DXY Index, putting pressure on the Crypto King’s price.
Is institutional demand losing momentum?
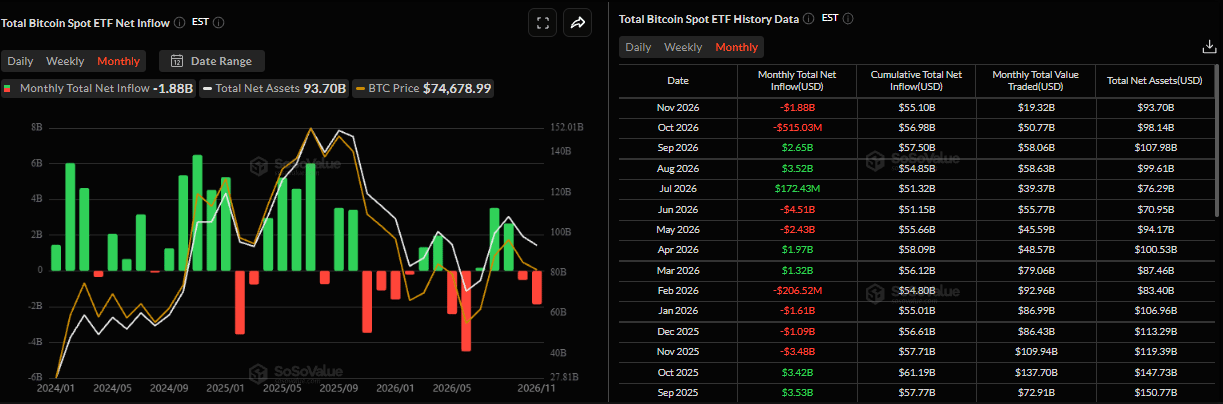
Among institutional investors, demand in the spot market is weakening too. Net outflows from US-listed spot Bitcoin exchange-traded funds (ETFs) exceeded $500 million in October. Withdrawals have since accelerated to $1.88 billion so far in November, the largest monthly outflow since June.
In contrast to the robust inflows seen in August and September, this change in investor sentiment and weakening demand have taken away an important source of steady buying that had previously helped absorb and cushion selling pressure.
How does MSCI’s index exclusion affect major corporate BTC holders?
Another setback confronts corporate demand this week, a source of support that has historically cushioned Bitcoin during steep corrections. Global index provider MSCI announced on Wednesday that Strategy would be excluded from its global indices, the MSCI USA Index and the MSCI World Index. With 850,364 BTC currently on its books, Strategy is Bitcoin’s largest corporate holder.
To align their portfolios with the changes, index funds following the affected benchmarks may have to sell their Strategy shares by 30 November. The direct impact of MSCI’s decision is on Strategy’s shares, not its Bitcoin holdings. Nevertheless, the cryptocurrency could also feel the effects, given Strategy’s status as the largest Bitcoin treasury.
Also on the exclusion list is Tokyo-listed Metaplanet, another company that accumulates and holds BTC. Its removal from the MSCI Japan Small Cap Index takes effect on 1 December.
Such potentially forced share disposals could pressure these BTC-holding companies’ stocks and, indirectly, sentiment towards BTC. These firms provide institutions with a route to Bitcoin exposure. Consequently, prolonged selling of their shares could weaken investor confidence in corporate Bitcoin treasury strategies, creating a further obstacle to BTC’s recovery.
Could rising leverage amplify sharp price swings?
As leverage accumulates in the derivatives market, the likelihood of abrupt price swings remains high for the Crypto King.
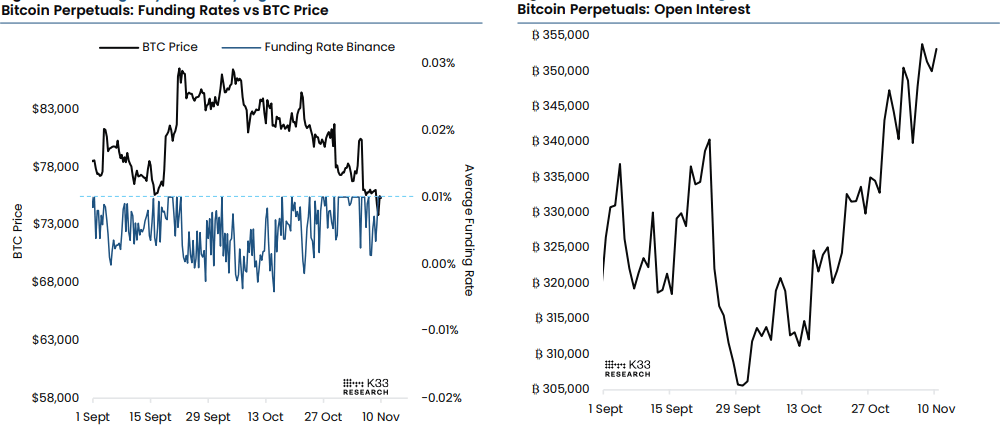
At 353,000 BTC this week, Open Interest (OI) in BTC perpetual futures sits in the 99th percentile of readings over the past two years. Annualised funding rates, meanwhile, have averaged 8.4% over the past week. This points to continued demand for long exposure even as BTC tests important support levels.
Comparable levels of elevated open interest have historically accompanied price extremes and substantial volatility, frequently ahead of sharp reversals. Although high leverage drove gains in June and August, positioning now appears less directional, creating significant scope for volatility either way. A break lower could set off sizeable long liquidations; conversely, a rebound could prompt short covering. In either case, the unwinding of leveraged positions could magnify price moves.
Can regulation offer any support to falling prices?
Fresh concerns for the cryptocurrency industry have emerged from the US political shift, with both the House and Senate under Democratic control. The new balance of power in Congress could hold up or delay key legislation affecting the sector, including the CLARITY Act, which seeks to create a clearer regulatory framework for digital assets.
Uncertainty has also increased as investors weigh what a Democrat-controlled Congress could mean for crypto and AI regulations when the new Congress meets on 3 January 2027.
Market sentiment remains under pressure from the possibility of delays in regulatory clarity and the lack of an immediate bullish catalyst.
Could stolen BTC and ETH assets create further market risks?
Sentiment remains weighed down by the late October security breach at Binance, the largest centralised cryptocurrency exchange. The exchange has, however, borne the entire financial impact. By Thursday, it had restored affected user balances using its corporate treasury, the Secure Asset Fund for Users (SAFUs) fund and other internal resources.
The attackers reportedly still control roughly $3 billion in stolen assets, however, predominantly BTC and ETH, which are not easy to freeze. Renewed movement of these funds could trigger another wave of FUD (fear, uncertainty, and doubt) in the market.
On-chain outlook: Is available buying power shrinking?
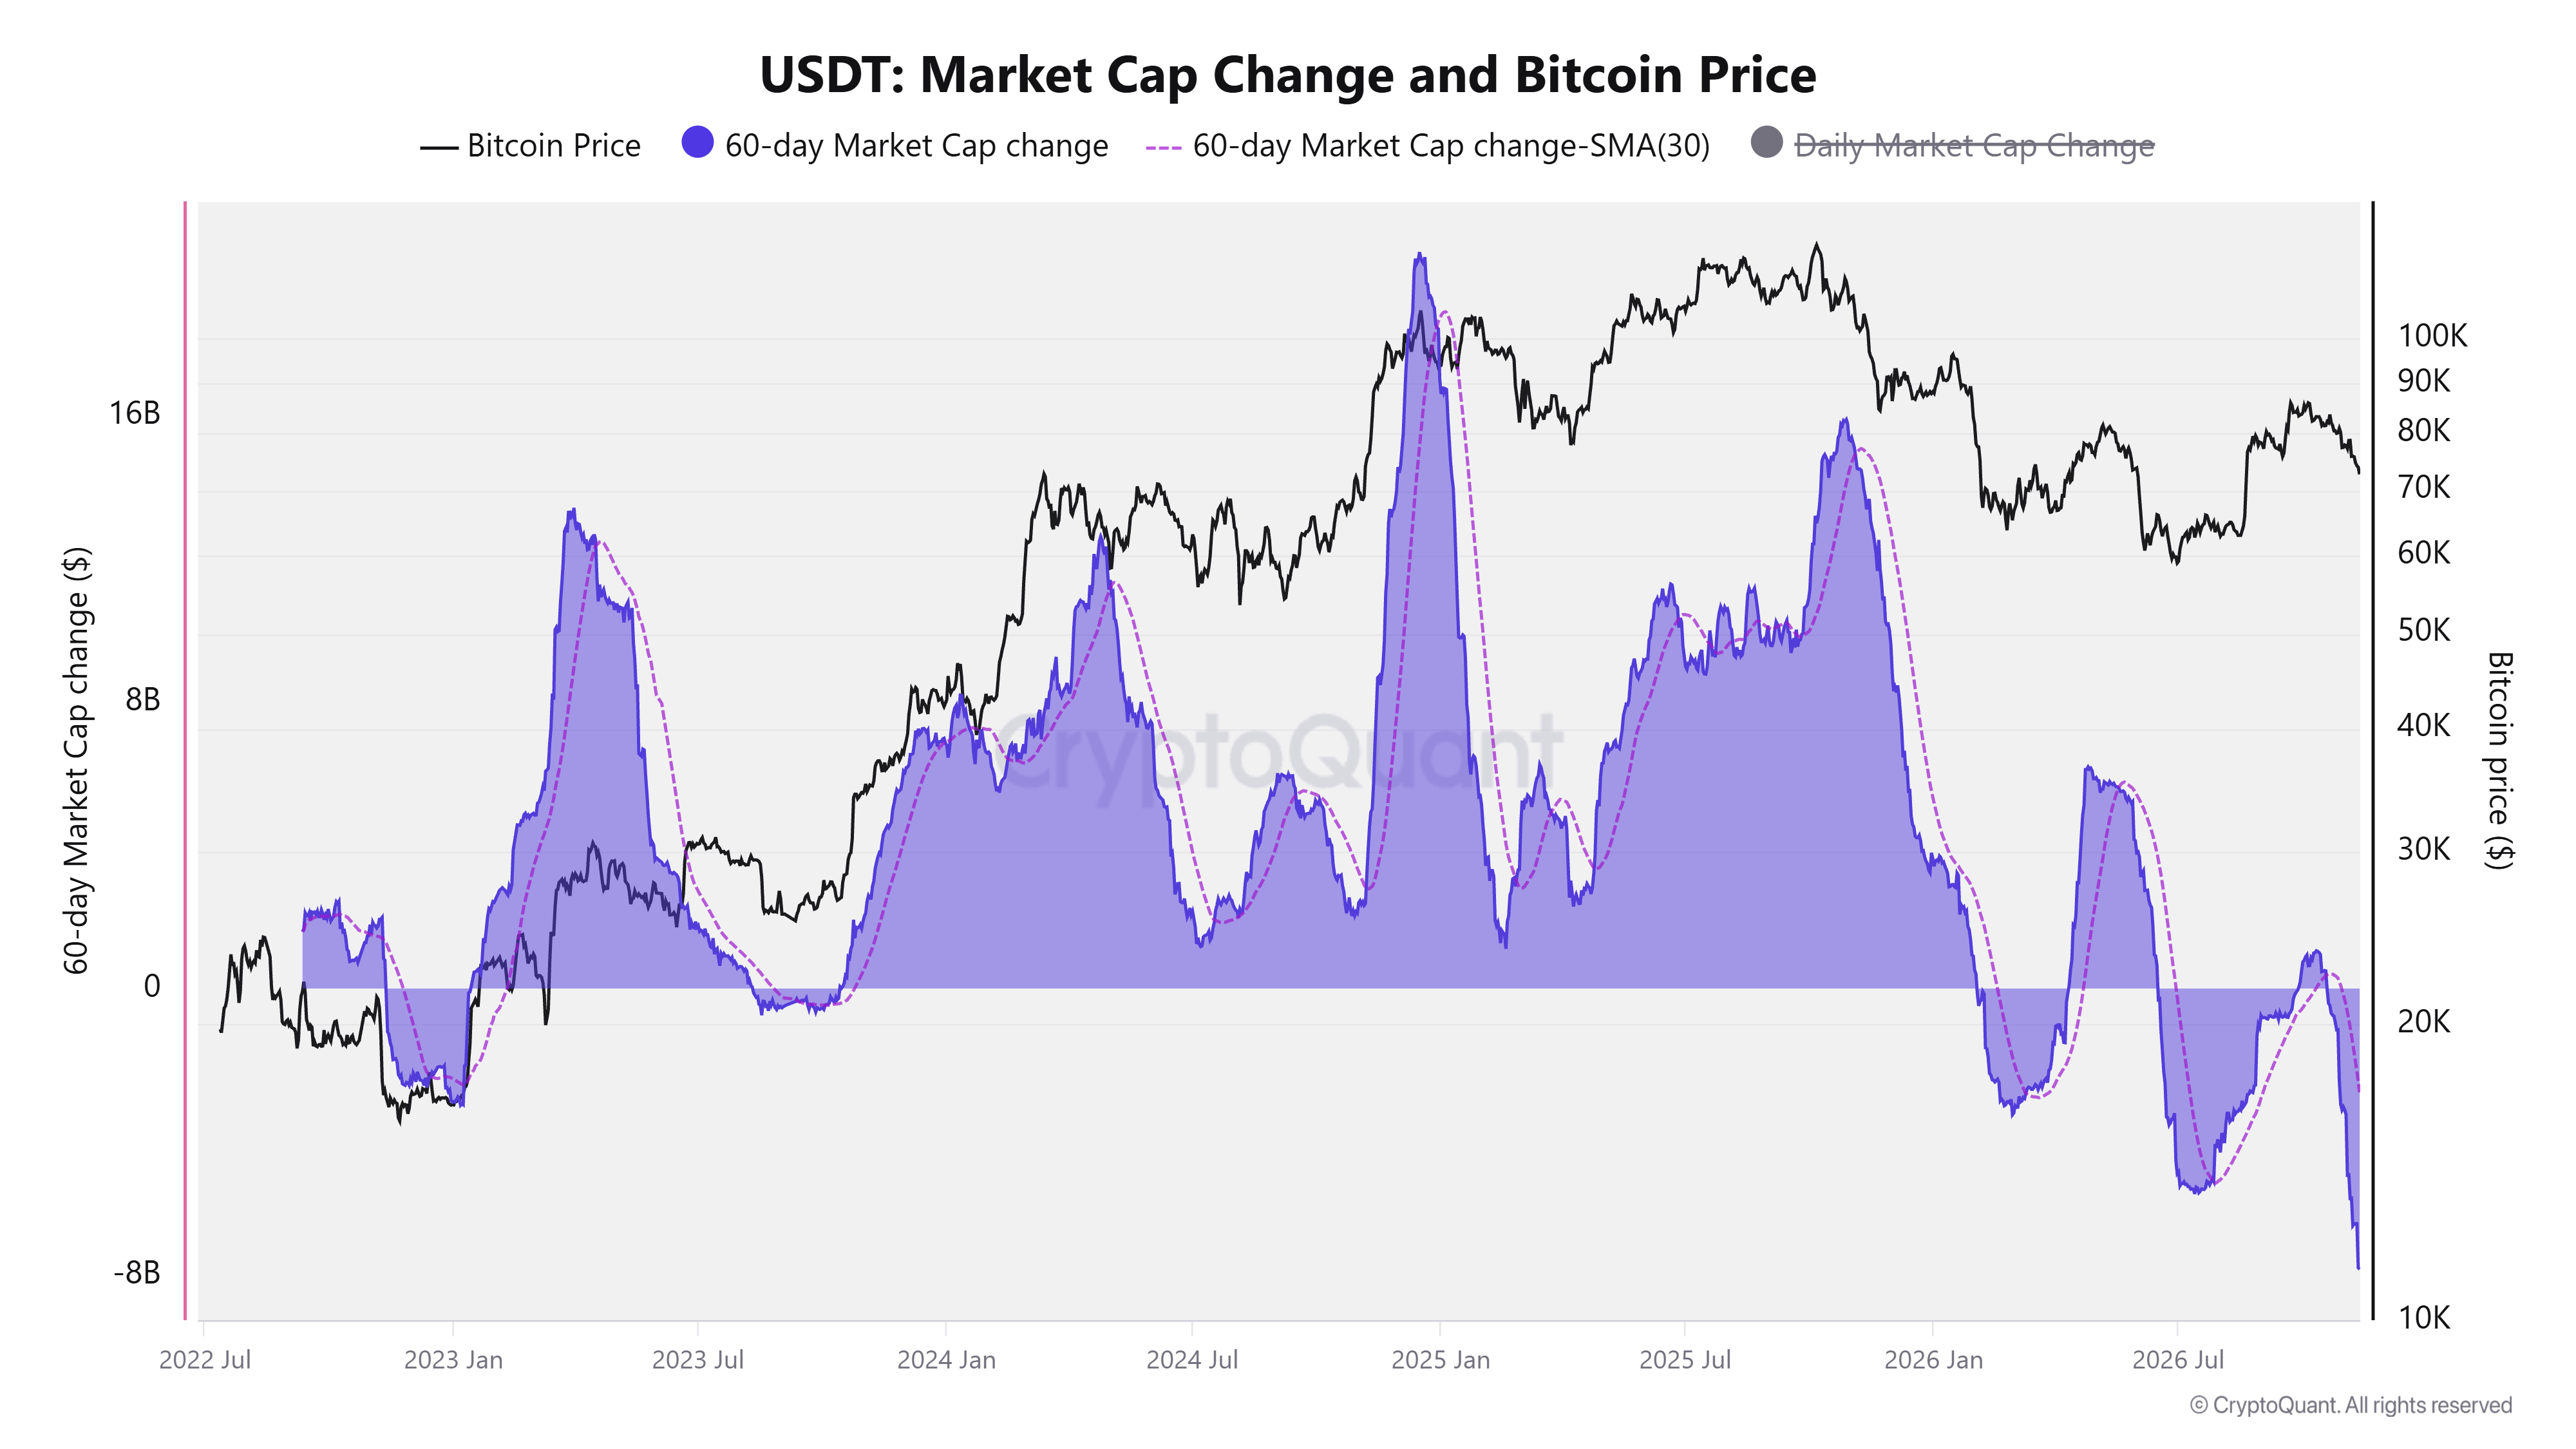
USDT stablecoin liquidity is shrinking at its fastest 60-day rate since 2022, according to on-chain data from CryptoQuant.
As of Thursday, Tether’s market capitalisation had fallen by $7.81 billion over the past 60 days, as illustrated in the chart below. This is its steepest contraction since mid-2022, surpassing the post-FTX exchange redemption level of $3.15 billion recorded on 31 December 2022.
For the cryptocurrency market, stablecoin supply represents readily deployable liquidity, or dry powder. A contraction leaves less capital available to move into BTC, constraining new buying demand.
During the current market cycle, Bitcoin rallies have occurred alongside expanding stablecoin supply. The latest contraction therefore presents another hurdle to a recovery.
Technical analysis: What follows the break below key support?
Since early October, the Crypto King has been in a correction, recording five straight weeks of losses of more than 13%. Last week’s close was below the crucial 50-week Simple Moving Average (SMA) at $75,099. Losses have extended by more than 8.2% this week, with BTC trading below $69,000 on Friday.
A continuation of BTC’s correction could take it towards the 200-week SMA at $67,998. Closing below this on a weekly basis would point to a more pronounced correction towards the important psychological mark of $60,000.
At 41, the weekly Relative Strength Index (RSI) is below the neutral level of 50, signalling waning bullish momentum. The Moving Average Convergence Divergence (MACD) histogram, meanwhile, printed a red bar this week, adding weight to the bearish outlook.
Should BTC rebound instead, gains could extend towards the 50-week SMA at $75,099. A successful close above this level, followed by a sustained hold, could carry the recovery towards the 61.8% Fibonacci retracement at $78,661. This retracement is drawn from the August 2024 low of $49,000 to the October 2025 record high of $126,199.
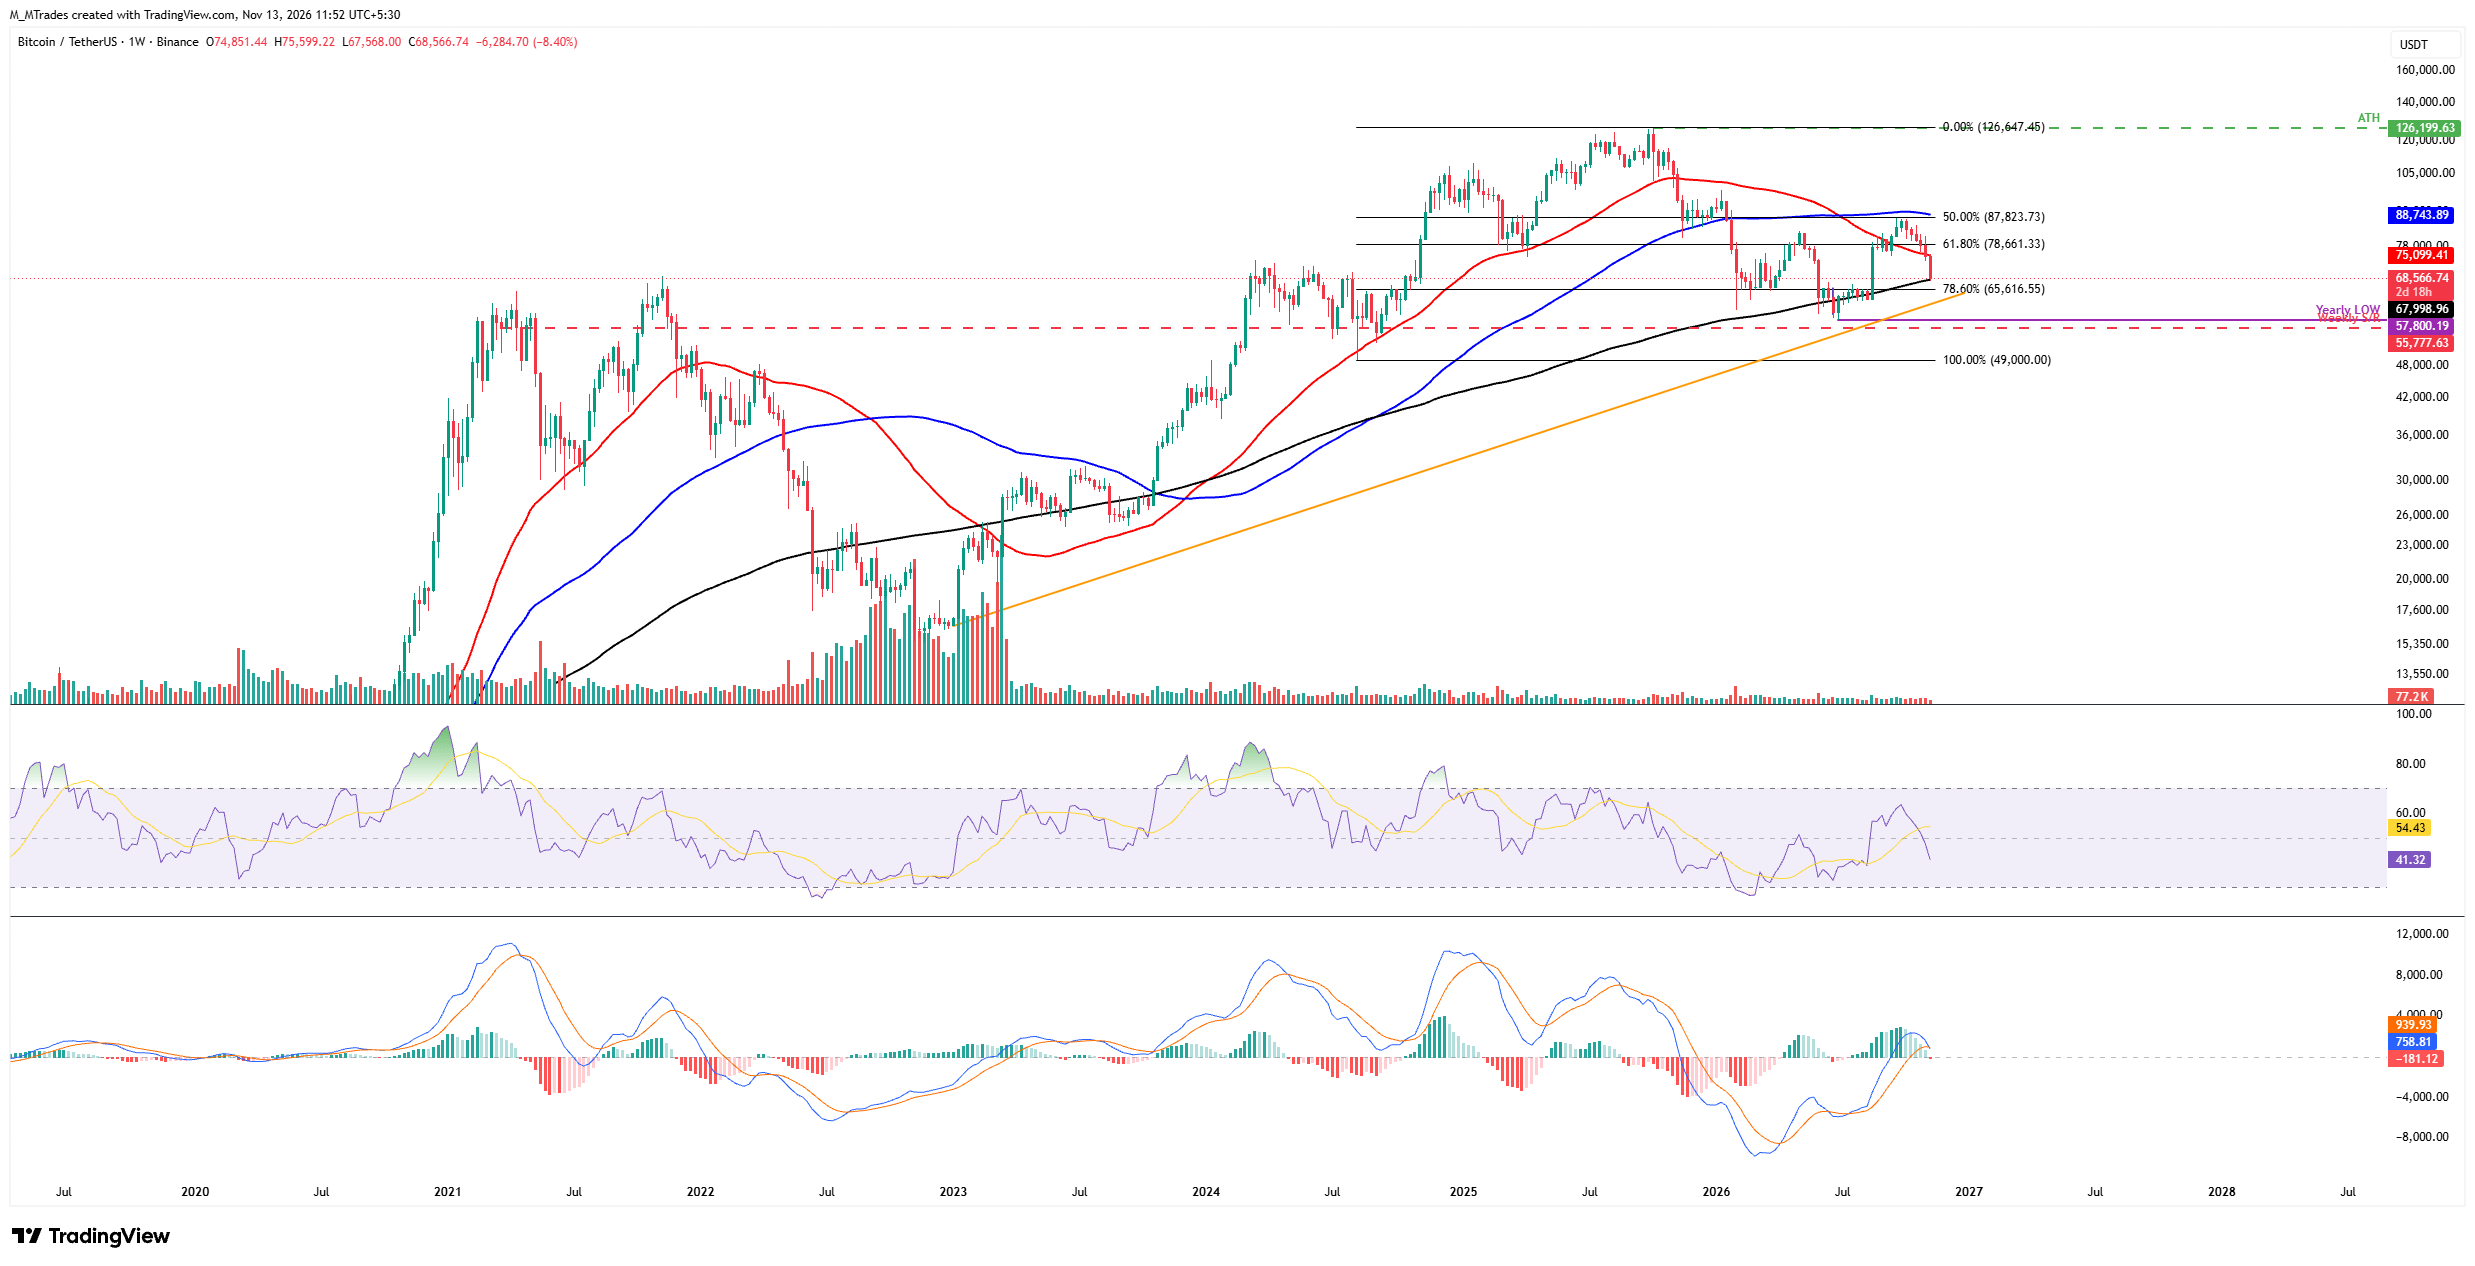
Taken together, market conditions suggest a growing likelihood of a major storm for the Crypto King. Downside risks for Bitcoin are likely to stay high until institutional demand steadies, liquidity improves and leveraged positioning resets. In the meantime, a sustained recovery remains difficult, with a deeper correction more likely.
FAQs on Bitcoin, altcoins and stablecoins
Designed to function as money, Bitcoin is a virtual currency and the largest cryptocurrency by market capitalisation. No single individual, group or entity can control this payment method, removing the need for third-party involvement in financial transactions.
The term altcoin covers any cryptocurrency other than Bitcoin. Some, however, also exclude Ethereum from this category, since these two cryptocurrencies are the basis for forks. Under that definition, Litecoin is the first altcoin: it was forked from the Bitcoin protocol and is therefore an “improved” version of it.
A stablecoin is a cryptocurrency intended to maintain a steady price, backed by reserves of the asset it represents. Its value is therefore pegged to a commodity or financial instrument, such as the US Dollar (USD), while an algorithm or demand regulates its supply. Stablecoins primarily give investors a way to enter and exit cryptocurrency trading and investment. They also enable investors to store value, as cryptocurrencies generally experience volatility.
Measured as Bitcoin’s market capitalisation divided by the combined market capitalisation of all cryptocurrencies, Bitcoin dominance indicates the level of investor interest in Bitcoin. BTC dominance is usually high before and during a bull run, when investors favour a relatively stable, high-market-capitalisation cryptocurrency such as Bitcoin. Falling BTC dominance generally signals that investors are shifting capital and/or profits into altcoins in search of higher returns, often triggering a surge in altcoin rallies.
POPULAR ARTICLES
1Eurozone Q3 GDP rises faster by 0.6% vs. flash estimates of 0.4%2As US bond yields surge, Australian Dollar falls further against US Dollar3Silver price today: FXStreet data shows little change in silver prices4Crypto Today: Mounting bearish pressure drives further losses in Bitcoin, Ethereum, XRP5Why has the Swiss Franc fallen to fresh monthly lows amid higher US yields and a hawkish Fed?6Euro extends losses below 1.1050 against US Dollar as attention turns to US PPI7GBP/USD: Why has strong UK data failed to lift the Pound? – Societe Generale8With USD bulls awaiting US PPI, Canadian Dollar hovers near one-month low around 1.42509Japan: December BoJ hike supported by trade and inflation data – DBS


Get Started!
Sign up and access the Global Markets in less than 3 minutes

Connect With Us












The information provided on this website is of a general nature only and does not constitute personal financial advice. Before acting on any information on this website, you should consider the suitability of the information in relation to your objectives, financial situation and needs. Investing in CFDs and FX Margin Contracts carries significant risks and is not suitable for all investors. You may lose more than your initial deposit. You do not own, or have, any interest in the underlying asset. We recommend that you seek independent advice and ensure you fully understand the risks involved before trading. It is important that you read and consider the disclosure document before you acquire any product listed on the website. The information and advertisements offered on this website are not intended for use by any person in any country or jurisdiction where such use would be contrary to local laws and regulations. The Products and Services offered on this website are not intended for residents of the United States, Malaysia and Thailand.
TMGM is authorized and regulated in various jurisdictions.
Trademax Australia Limited, trading as TMGM, is regulated by the Australian Securities and Investments Commission (ASIC), AFSL no. 436416 and is located at Level 28, One International Tower, 100 Barangaroo Avenue, 2000 Sydney, NSW Australia.
Email: support@tmgm.com.au
Trademax Global Limited, trading as TMGM, is authorized and regulated by the Vanuatu Financial Services Commission (VFSC), registration number 40356 and registered at 1276, Kumul Highway, Port Vila, Vanuatu, Republic of Vanuatu.
Email: support@tmgm.com
Trademax Global Markets (SE) Limited, trading as TMGM, is authorized and regulated by the Financial Services Authority (FSA) of Seychelles, with license number SD224. The company is registered at Office No 13, Providence Estate ABIS Centre, Mahe, Seychelles.
Email: support@tmgm.com
Trademax Global Markets (International) Pty Ltd, trading as TMGM, is authorized and regulated by the Financial Services Commission, Mauritius (FSC) with license no. GB22201012, and registered at 33, Edith Cavell Street C/o IQ EQ Fund Services (Mauritius) Ltd Port Louis, 11324 Mauritius.
Email: support@tmgm.com
Copyright © TMGM. All rights reserved