

Trading
Explore a wide range of markets with competitive pricing, deep liquidity, and advanced trading tools.
Learn More 
Platform
Trade seamlessly with TMGM's powerful platform, built for speed, precision, and a superior trading experience.
Learn More Trading Platform
Academy
Learn the fundamentals of trading with beginner-friendly resources, including guides, webinars, and market insights.
Learn More News & Analysis
Get real-time market updates and expert analysis to stay ahead of trading opportunities
Learn More News & Analysis
About
Learn what sets TMGM apart — our global presence, regulatory strength, and commitment to innovation in trading.
Learn More Why Choose TMGM
Sponsorship
Cardano Price Forecast: Does weakness in on-chain and derivatives markets signal further ADA downside?
- Selling pressure keeps Cardano below $0.169 on Friday, taking its losses for the week so far to nearly 4%.
- The continuing correction is reinforced by softer derivatives metrics and bearish signals from on-chain indicators.
- Further downside remains a risk for ADA as its technical outlook weakens.
Sellers remain in control of Cardano (ADA), which trades below $0.169 on Friday as its decline for the week so far approaches 4%. The token is also on course for its sixth straight weekly correction, having shed more than 30% since early October. Deteriorating derivatives metrics and bearish on-chain signals indicate waning market participation. The technical picture, meanwhile, points to the risk of further declines.

What signals a bearish bias in derivatives data?
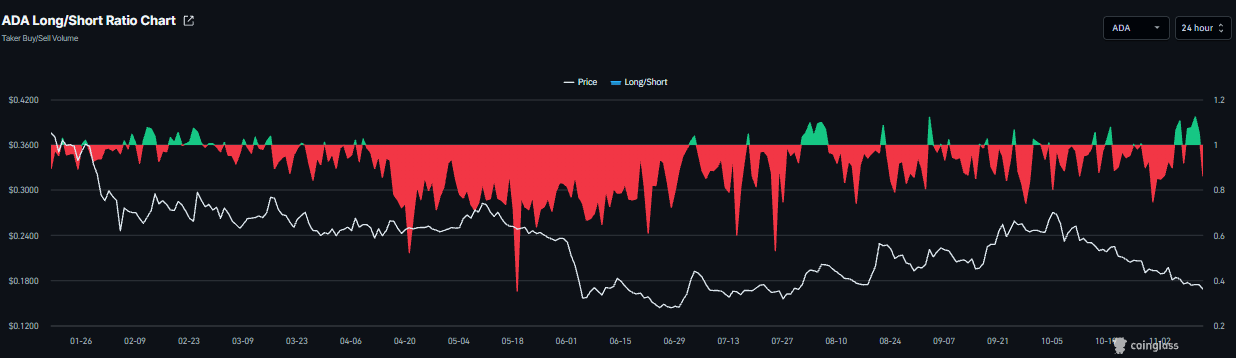
Bearish positioning is evident in Cardano’s derivatives data, with CoinGlass’ ADA long-to-short ratio standing at 0.86 on Monday, close to its lowest reading in over a month. Readings below one reflect bearish sentiment, with traders positioning for a fall in asset prices.
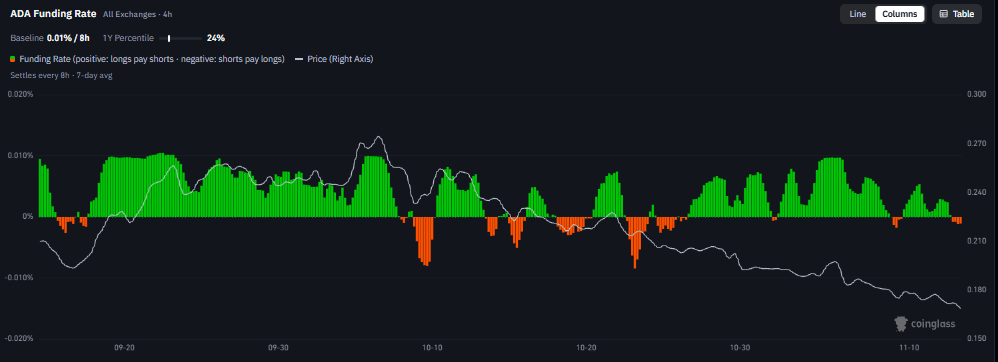
A further bearish signal comes from Cardano’s funding rate, which turned negative on Thursday and stands at -0.0015% on Friday. This means short-position holders are paying long-position holders, pointing to a bearish outlook.
Why do on-chain metrics warrant caution?
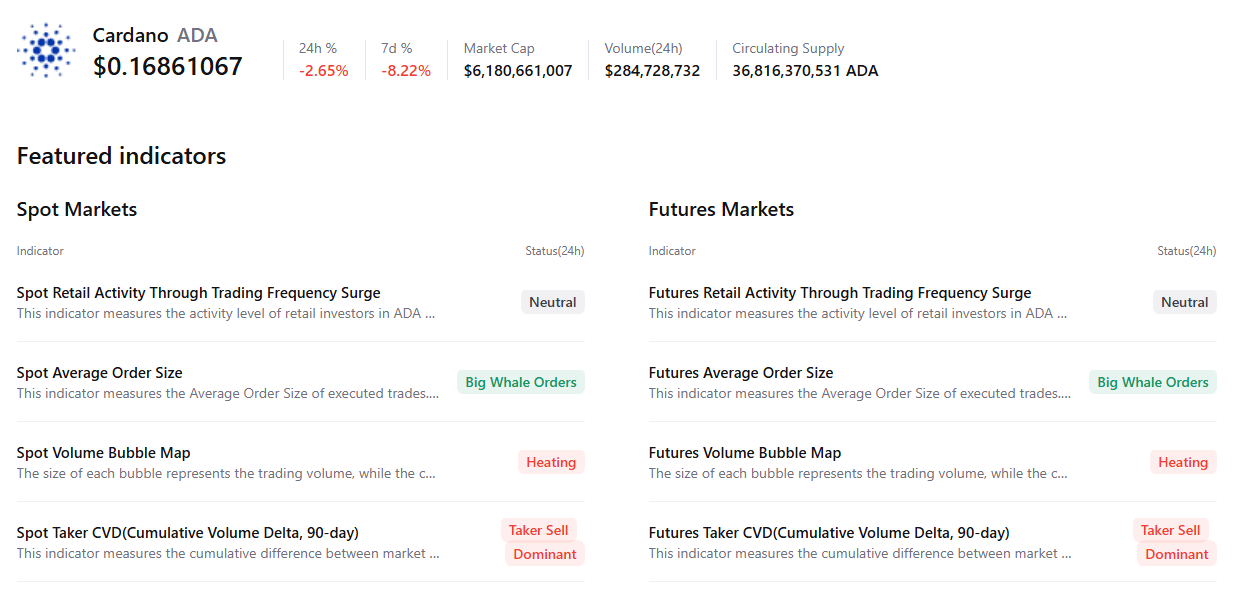
Caution characterises the outlook for Cardano in CryptoQuant’s summary data. Large whale orders and heating conditions are visible across ADA’s spot and futures markets, with sellers dominating both. Together, these signals reflect a cautious, bearish bias among ADA traders.
Cardano technical outlook: Can bears drive ADA further down?
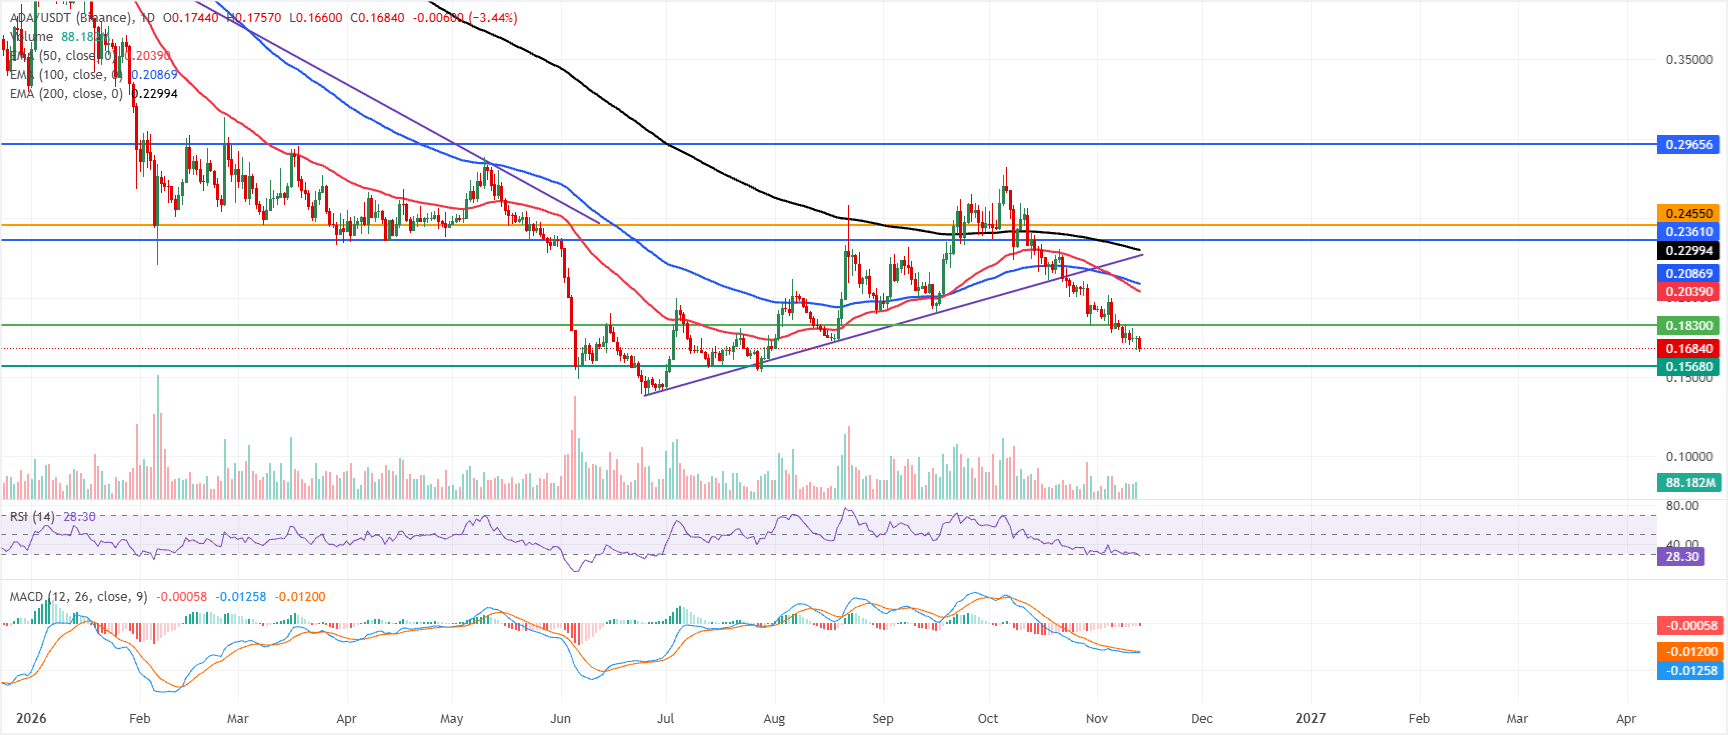
A bearish near-term bias persists as Cardano trades at $0.168 on Friday. The price remains firmly below its 50-day, 100-day and 200-day Exponential Moving Averages (EMAs), positioned at $0.203, $0.208 and $0.229, respectively.
With the Relative Strength Index (RSI) edging towards oversold territory near 28, momentum continues to look weak. A negative Moving Average Convergence Divergence (MACD) reading and a flat histogram also point to sustained downward pressure, rather than a reversal in the immediate term.
Any recovery would first encounter the horizontal resistance near $0.183, followed by a closely packed EMA cluster spanning $0.203 to $0.229. Further overhead, resistance levels lie at $0.236, $0.245 and $0.296.
Below the current price, the horizontal level at $0.156 provides the next significant support. A decisive break below it would leave ADA exposed to further selling within the ongoing downtrend.
(The technical analysis of this story was written with the help of an AI tool. Know more.)
POPULAR ARTICLES
1Cardano Price Forecast: Does weakness in on-chain and derivatives markets signal further ADA downside?2Currency market: Japan’s Takaichi reports close contact with US financial authorities3EUR/JPY Price Forecast: Bearish bias persists below 100-day SMA despite gains above 176.504India Gold price today: FXStreet data shows Gold prices moving higher5Fed bets and Iran risks underpin US Dollar Index (DXY) above 10.300, near April 2025 highs6US early-warning radar in Bahrain targeted and destroyed, Iran's IRGC says7How Are Asian Stocks Faring Amid Nvidia Leadership Turmoil and Anthropic IPO Buzz? Mixed Results Emerge8Gold reclaims $3,900 after recovering from YTD low; will Fed hike bets and bullish USD limit gains?9Top 3 Price Predictions: Bitcoin, Ethereum, Ripple – Bearish momentum drives further losses in BTC, ETH and XRP


Get Started!
Sign up and access the Global Markets in less than 3 minutes

Connect With Us












The information provided on this website is of a general nature only and does not constitute personal financial advice. Before acting on any information on this website, you should consider the suitability of the information in relation to your objectives, financial situation and needs. Investing in CFDs and FX Margin Contracts carries significant risks and is not suitable for all investors. You may lose more than your initial deposit. You do not own, or have, any interest in the underlying asset. We recommend that you seek independent advice and ensure you fully understand the risks involved before trading. It is important that you read and consider the disclosure document before you acquire any product listed on the website. The information and advertisements offered on this website are not intended for use by any person in any country or jurisdiction where such use would be contrary to local laws and regulations. The Products and Services offered on this website are not intended for residents of the United States, Malaysia and Thailand.
TMGM is authorized and regulated in various jurisdictions.
Trademax Australia Limited, trading as TMGM, is regulated by the Australian Securities and Investments Commission (ASIC), AFSL no. 436416 and is located at Level 28, One International Tower, 100 Barangaroo Avenue, 2000 Sydney, NSW Australia.
Email: support@tmgm.com.au
Trademax Global Limited, trading as TMGM, is authorized and regulated by the Vanuatu Financial Services Commission (VFSC), registration number 40356 and registered at 1276, Kumul Highway, Port Vila, Vanuatu, Republic of Vanuatu.
Email: support@tmgm.com
Trademax Global Markets (SE) Limited, trading as TMGM, is authorized and regulated by the Financial Services Authority (FSA) of Seychelles, with license number SD224. The company is registered at Office No 13, Providence Estate ABIS Centre, Mahe, Seychelles.
Email: support@tmgm.com
Trademax Global Markets (International) Pty Ltd, trading as TMGM, is authorized and regulated by the Financial Services Commission, Mauritius (FSC) with license no. GB22201012, and registered at 33, Edith Cavell Street C/o IQ EQ Fund Services (Mauritius) Ltd Port Louis, 11324 Mauritius.
Email: support@tmgm.com
Copyright © TMGM. All rights reserved