

Trading
Explore a wide range of markets with competitive pricing, deep liquidity, and advanced trading tools.
Learn More 
Platform
Trade seamlessly with TMGM's powerful platform, built for speed, precision, and a superior trading experience.
Learn More Trading Platform
Academy
Learn the fundamentals of trading with beginner-friendly resources, including guides, webinars, and market insights.
Learn More News & Analysis
Get real-time market updates and expert analysis to stay ahead of trading opportunities
Learn More News & Analysis
About
Learn what sets TMGM apart — our global presence, regulatory strength, and commitment to innovation in trading.
Learn More Why Choose TMGM
Sponsorship
Silver Price Forecast: Why does XAG/USD remain confined to a descending channel?
- Silver faces a weekly decline of over 5%, with expectations of Fed rate hikes lending support to the US Dollar.
- Below its key moving averages, XAG/USD continues to trade within a descending channel on the daily chart.
- Weak momentum persists as RSI hovers near 33 and MACD histogram bars shrink.
Selling pressure pushes Silver (XAG/USD) back below $50 on Friday, leaving the metal headed for a weekly decline of more than 5%. Traders are positioning for more aggressive tightening by the Federal Reserve (Fed) over the coming months. Silver is trading around $49 at the time of writing, marginally above the year-to-date low of $48.87 recorded on 30 October.

Traders now fully price in a December rate hike, according to the CME FedWatch Tool, following this week’s US consumer and producer inflation releases and hawkish comments from the Fed. While a quarter-point increase is the preferred expectation, markets assign a small probability to a half-point rise. Near 103.40, the US Dollar Index (DXY) is at its strongest since April 2025. The 10-year US Treasury yield, meanwhile, has moved back above 5% after climbing about 30 basis points this week.
For buyers holding other currencies, a firmer US Dollar increases the cost of Silver. Rising Treasury yields also make holding the non-yielding metal less attractive by increasing its opportunity cost. Buyers remain largely on the sidelines, while technical signals reinforce the picture of subdued momentum.
Can Silver Break Out of Its Bearish Technical Structure?
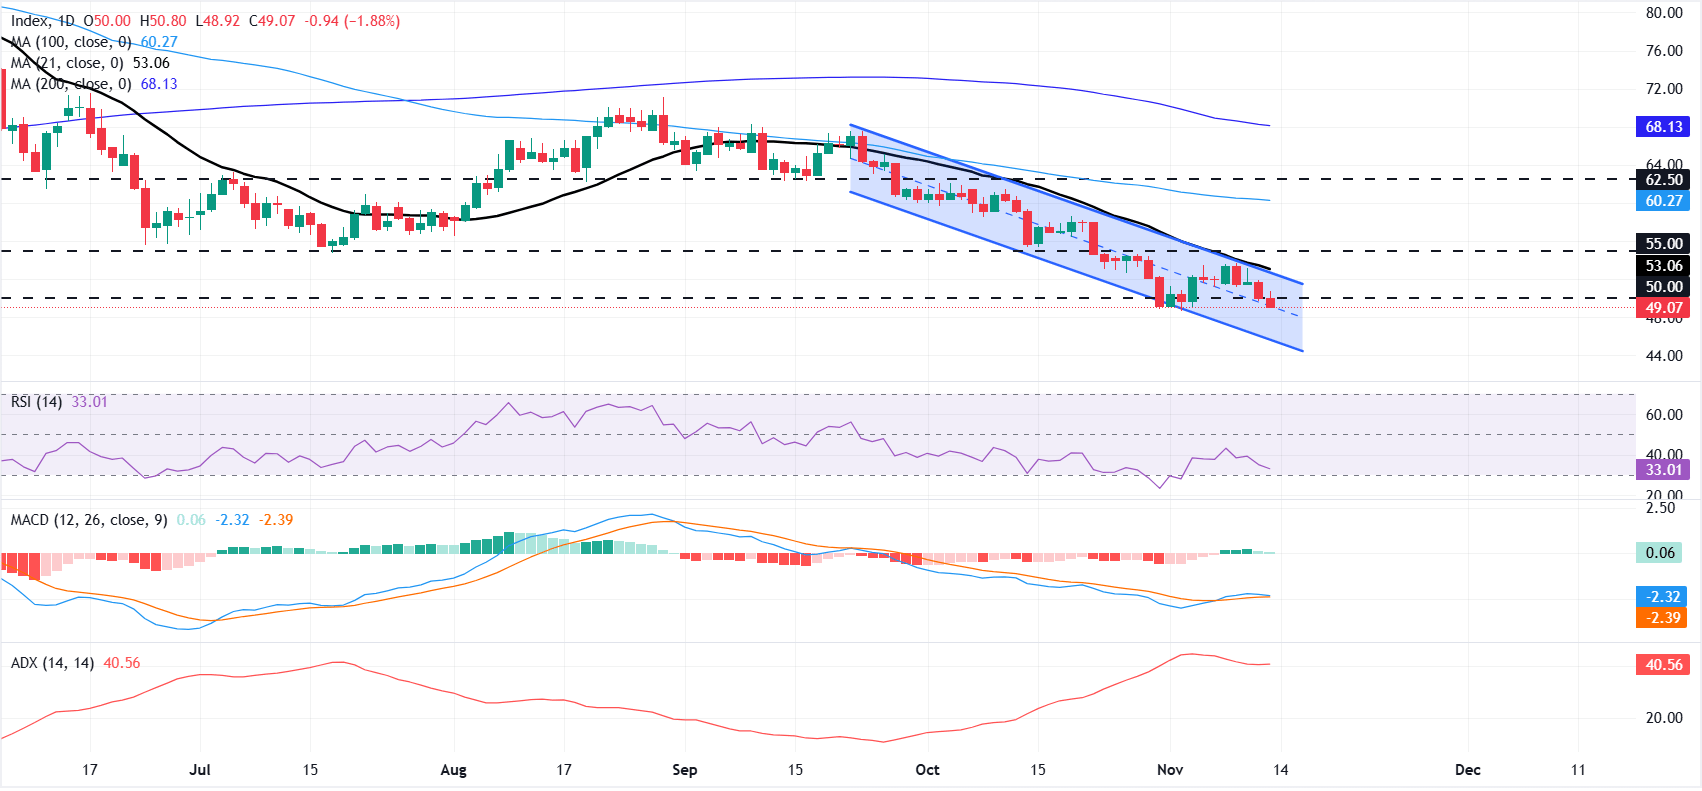
A clearly defined descending parallel channel continues to guide XAG/USD lower on the daily chart, with the price beneath every major moving average. Overhead resistance comes from the 21-day simple moving average (SMA), the 100-day SMA and the 200-day SMA. As long as this cluster limits advances, the near-term bias remains bearish.
At around 33, the 14-day Relative Strength Index (RSI) sits just above oversold territory, signalling continued weakness in momentum. Although the Moving Average Convergence Divergence (MACD) is still slightly positive, its shrinking green histogram bars indicate that the recent improvement in momentum is fading.
Any recovery would first encounter resistance at the psychological $50.00 level. Beyond that, the descending channel’s upper boundary near $52.17 and the 21-day SMA at $53.06 create a concentrated supply zone ahead of $55.00. Further resistance lies at the 100-day SMA of $60.27, followed by the horizontal barrier at $62.50. The 200-day SMA at $68.13 provides the longer-term ceiling underpinning the broader bearish structure.
The next significant support lies around $45 at the channel’s lower boundary. A decisive break below it would pave the way for the existing downtrend to extend.
(The technical analysis of this story was written with the help of an AI tool. Know more.)
Silver: Key Questions Answered
Investors actively trade Silver, a precious metal with a long history as both a store of value and a means of exchange. Gold attracts greater interest, but traders may choose Silver for its intrinsic value, to diversify their portfolios or as a possible hedge when inflation is high. Exposure can take the form of physical coins and bars or instruments such as Exchange Traded Funds that follow Silver’s price in international markets.
A broad set of influences can drive Silver prices. Its safe-haven appeal can lift prices during geopolitical turmoil or concerns about a severe recession, though this effect is generally weaker than for Gold. Lower interest rates usually favour Silver because it generates no yield. The US Dollar (USD) is another key influence, as Silver is quoted in dollars (XAG/USD): a stronger Dollar generally restrains prices, while a weaker currency is likely to lift them. Investment demand, the supply from mines and recycling rates also matter, with Silver considerably more abundant than Gold.
With electrical conductivity among the highest of any metal, exceeding that of Copper and Gold, Silver has extensive industrial applications, notably in electronics and solar energy. Prices can rise when demand surges and tend to fall when it weakens. Developments in the US, Chinese and Indian economies can also drive price fluctuations. Large industrial sectors in the US and, especially, China consume Silver across a range of processes, while Indian consumer demand for Silver jewellery is another important influence on prices.
Given the metals’ similar safe-haven status, an increase in Gold prices is usually accompanied by a rise in Silver, which tends to track Gold’s direction. Their relative valuations may be assessed using the Gold/Silver ratio, the number of ounces of Silver equivalent in value to one ounce of Gold. A high ratio may be interpreted by some investors as a sign that Silver is undervalued or Gold overvalued. Conversely, a low ratio may indicate that Gold is undervalued compared with Silver.
POPULAR ARTICLES
1Can gold avoid a weekly rout as high US yields bolster Fed rate hike bets?2Silver Price Forecast: Why does XAG/USD remain confined to a descending channel?3Why is the Swiss Franc facing broad-based weakness as low interest rates weigh?4Further rate hikes likely as firms look to pass on costs, Fed’s Daly expects5Why does ECB’s Nagel see another hike as second-round risks build?6Rising US yields and Fed tightening outlook push Australian Dollar lower7Fed's Collins backs cautious rate hikes amid warning of broadening inflation8Is the British Pound heading for weekly losses as US PPI keeps Fed hawks in control?9Firmer Oil supports Canadian Dollar as traders await inflation data

Get Started!
Sign up and access the Global Markets in less than 3 minutes

Connect With Us












The information provided on this website is of a general nature only and does not constitute personal financial advice. Before acting on any information on this website, you should consider the suitability of the information in relation to your objectives, financial situation and needs. Investing in CFDs and FX Margin Contracts carries significant risks and is not suitable for all investors. You may lose more than your initial deposit. You do not own, or have, any interest in the underlying asset. We recommend that you seek independent advice and ensure you fully understand the risks involved before trading. It is important that you read and consider the disclosure document before you acquire any product listed on the website. The information and advertisements offered on this website are not intended for use by any person in any country or jurisdiction where such use would be contrary to local laws and regulations. The Products and Services offered on this website are not intended for residents of the United States, Malaysia and Thailand.
TMGM is authorized and regulated in various jurisdictions.
Trademax Australia Limited, trading as TMGM, is regulated by the Australian Securities and Investments Commission (ASIC), AFSL no. 436416 and is located at Level 28, One International Tower, 100 Barangaroo Avenue, 2000 Sydney, NSW Australia.
Email: support@tmgm.com.au
Trademax Global Limited, trading as TMGM, is authorized and regulated by the Vanuatu Financial Services Commission (VFSC), registration number 40356 and registered at 1276, Kumul Highway, Port Vila, Vanuatu, Republic of Vanuatu.
Email: support@tmgm.com
Trademax Global Markets (SE) Limited, trading as TMGM, is authorized and regulated by the Financial Services Authority (FSA) of Seychelles, with license number SD224. The company is registered at Office No 13, Providence Estate ABIS Centre, Mahe, Seychelles.
Email: support@tmgm.com
Trademax Global Markets (International) Pty Ltd, trading as TMGM, is authorized and regulated by the Financial Services Commission, Mauritius (FSC) with license no. GB22201012, and registered at 33, Edith Cavell Street C/o IQ EQ Fund Services (Mauritius) Ltd Port Louis, 11324 Mauritius.
Email: support@tmgm.com
Copyright © TMGM. All rights reserved