

Trading
Explore a wide range of markets with competitive pricing, deep liquidity, and advanced trading tools.
Learn More 
Platform
Trade seamlessly with TMGM's powerful platform, built for speed, precision, and a superior trading experience.
Learn More Trading Platform
Academy
Learn the fundamentals of trading with beginner-friendly resources, including guides, webinars, and market insights.
Learn More News & Analysis
Get real-time market updates and expert analysis to stay ahead of trading opportunities
Learn More News & Analysis
About
Learn what sets TMGM apart — our global presence, regulatory strength, and commitment to innovation in trading.
Learn More Why Choose TMGM
Sponsorship
Zcash Price Forecast: Can ZEC Hold $1,000 Support as Hot US CPI Data Counters Grayscale’s Marketing?
- Selling pressure drags Zcash towards $1,000 on Wednesday as losses extend into a fifth straight day.
- Investor appetite for high-risk assets weakens as hot US CPI data raises the likelihood of Fed rate hikes.
- Alongside a major Zcash advertising push, Grayscale channels sponsor fees into the network's development, marketing, community and education.
Sustained selling has pushed Zcash (ZEC) close to $1,000 on Wednesday, with cumulative losses exceeding 20% over the past five days. Weighing on sentiment, stronger-than-expected US monthly inflation figures have outweighed support from Grayscale’s Zcash marketing campaign and its contribution of sponsor fees to the network.

With downward momentum gathering pace, Zcash’s technical outlook remains bearish, putting a key moving average near $880 in focus.
How is US inflation weighing on the crypto market?
Inflation worries intensified after Tuesday’s US Consumer Price Index (CPI) release showed a 0.4% increase in October, exceeding the market forecast of 0.3%. Coming after September’s 0.6% rise, the reading also increased the likelihood of a US rate hike.
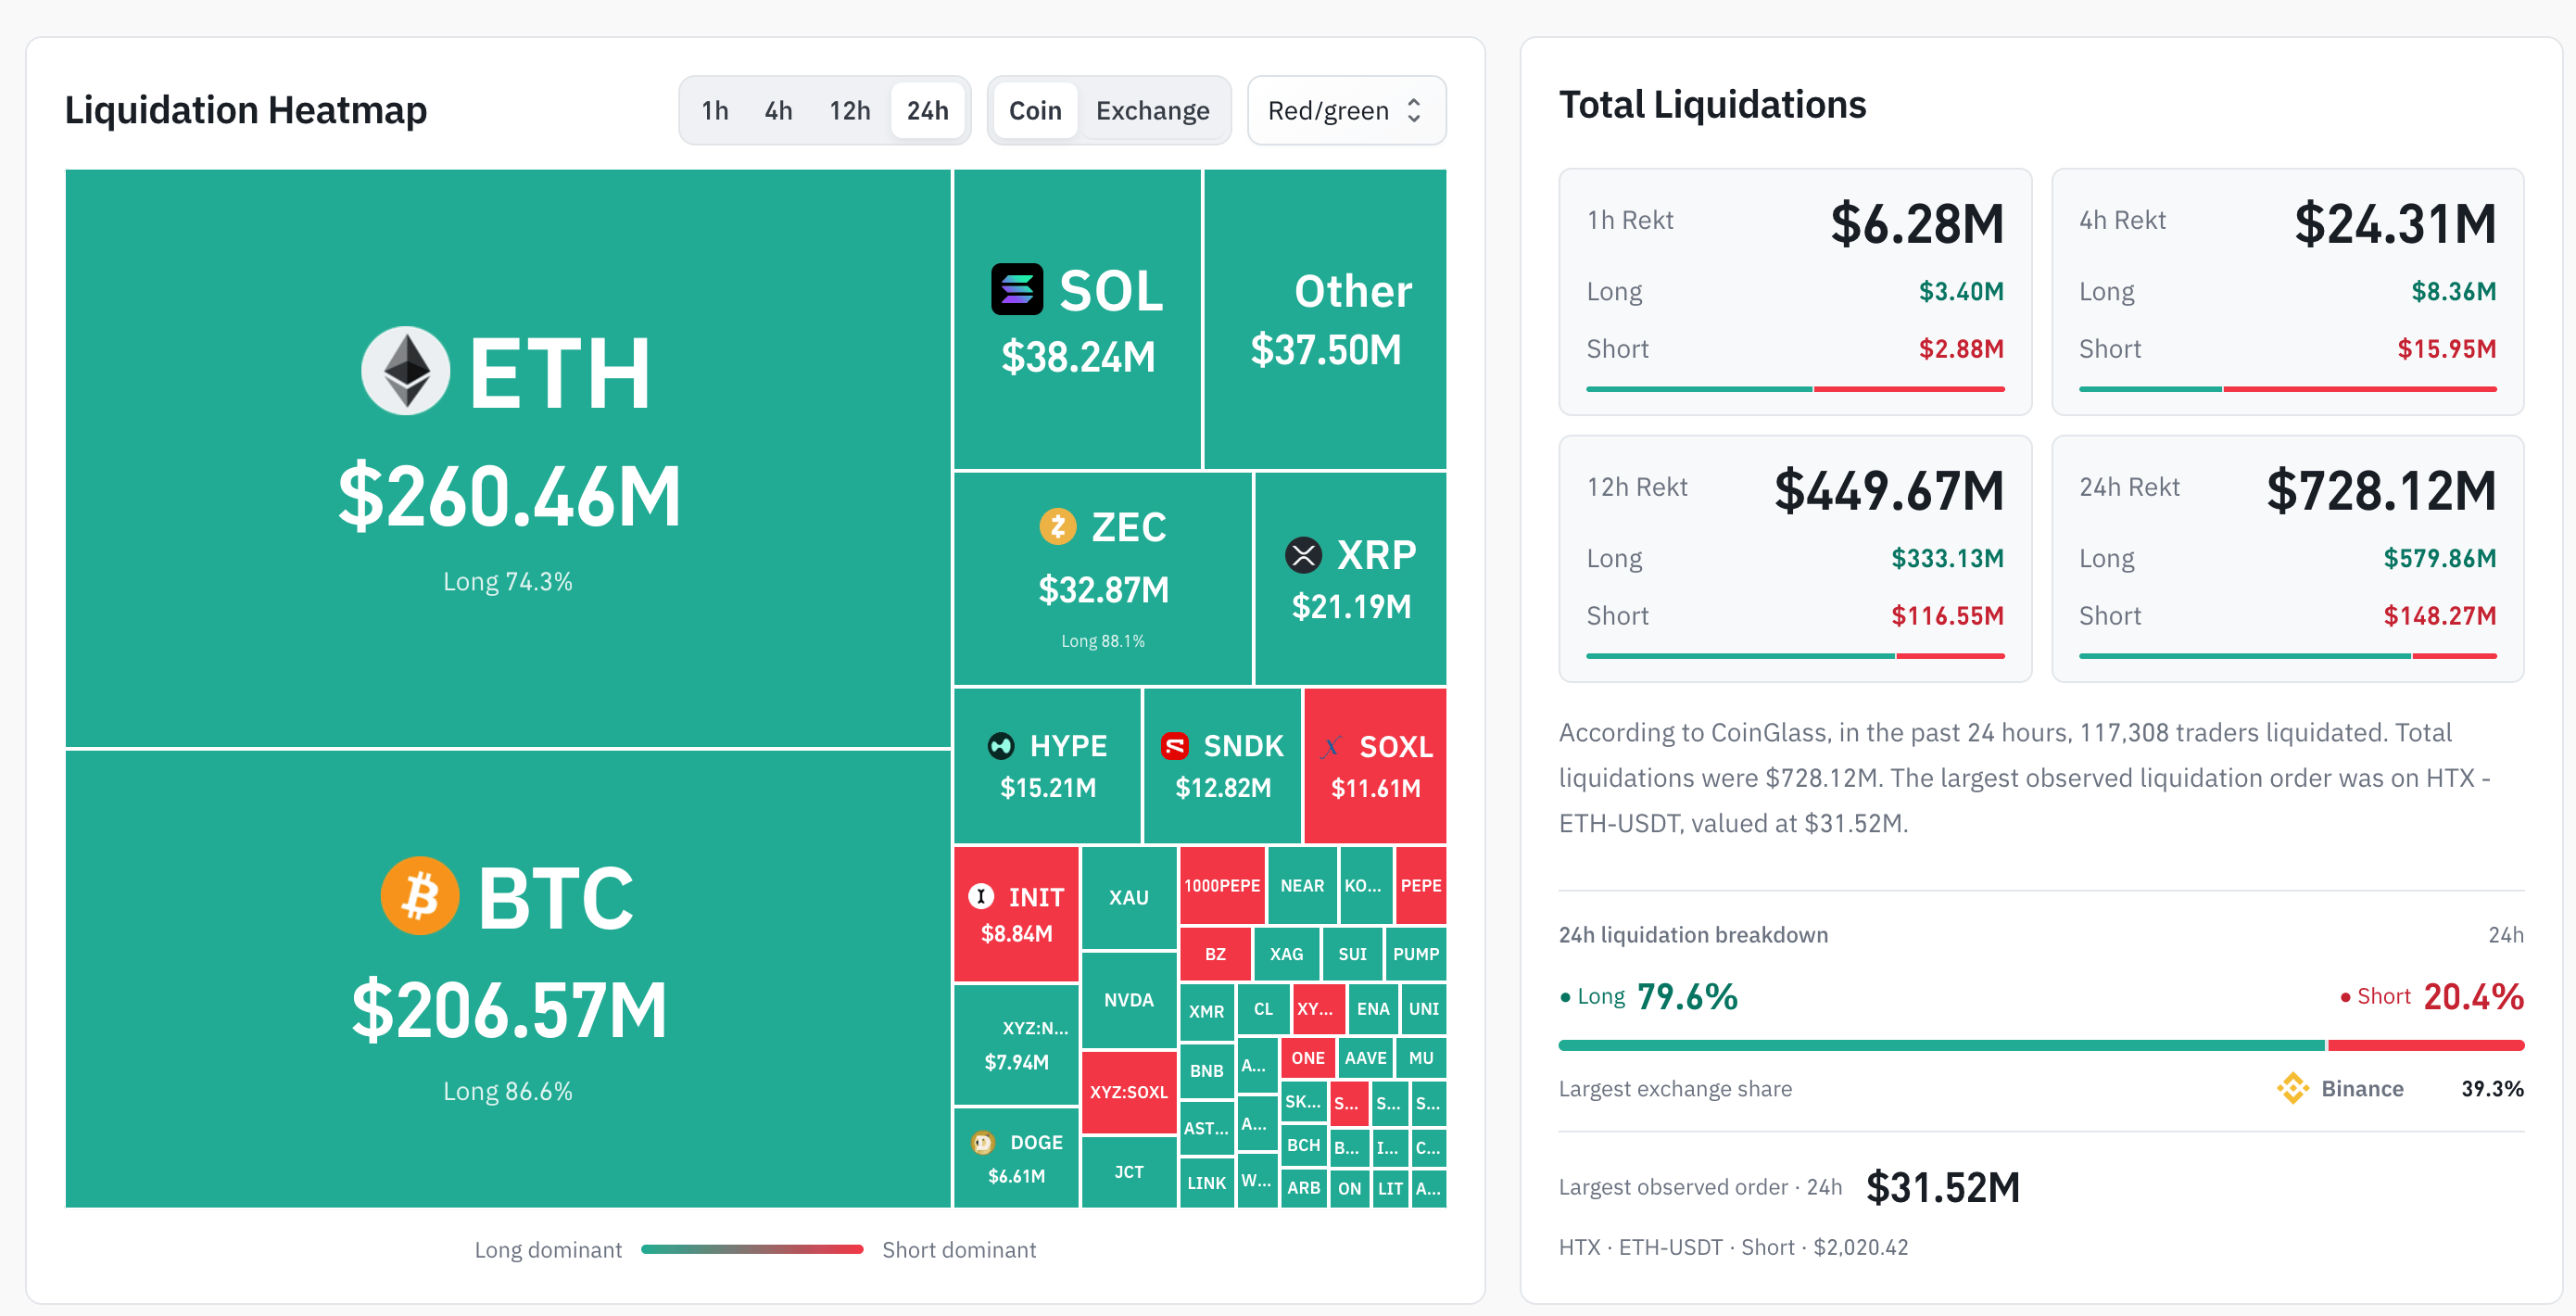
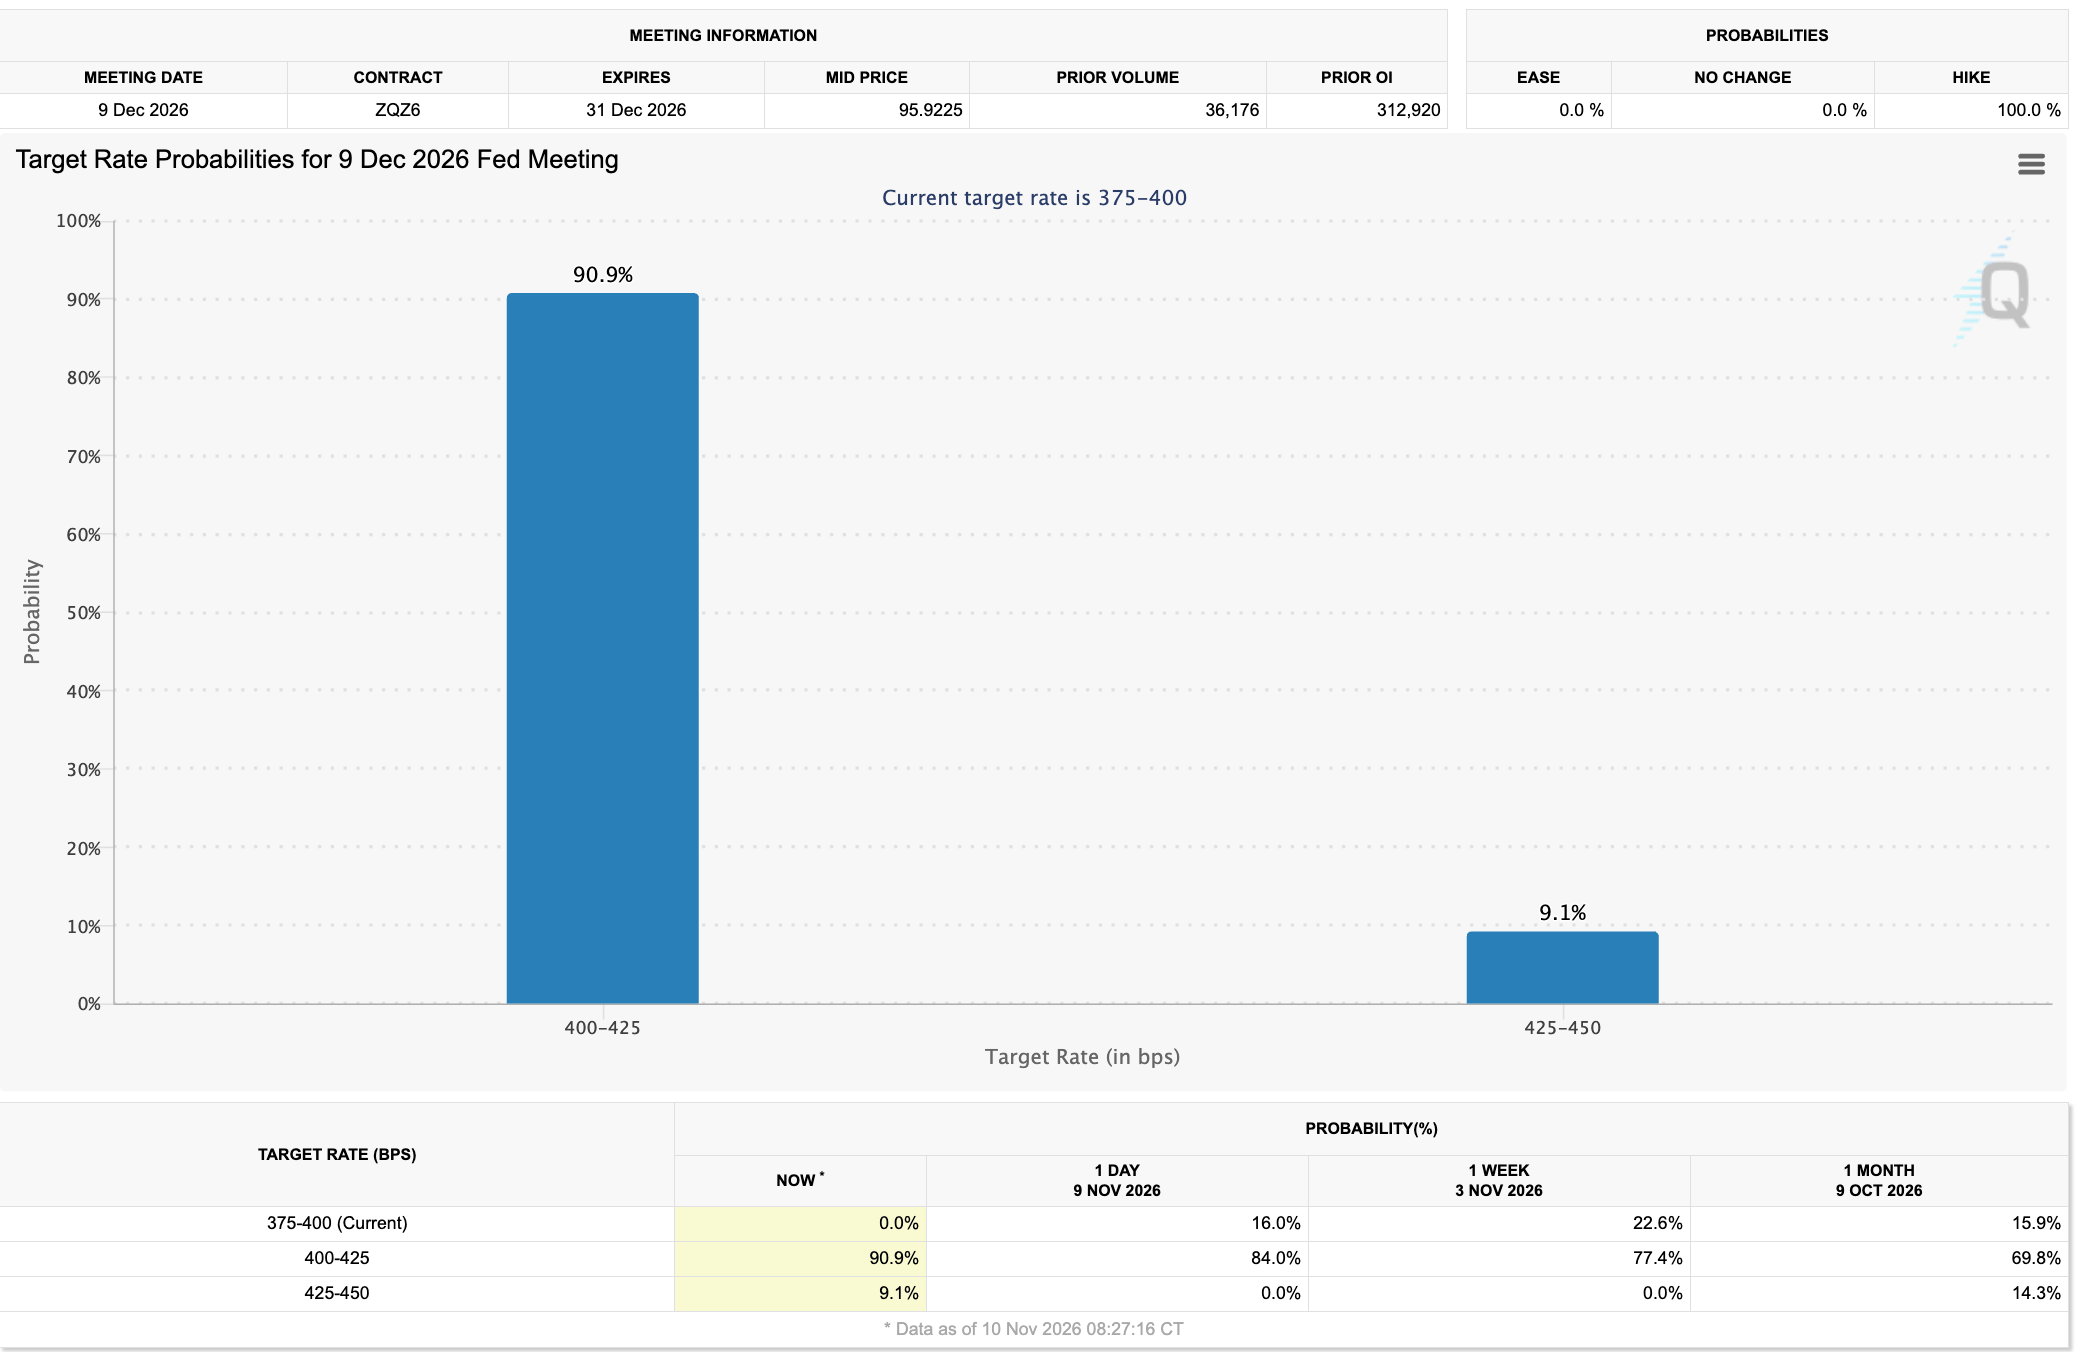
According to the CME FedWatch Tool, the probability of the Fed raising rates by 25 basis points (bps) at its December 9 meeting stands at 90%, reducing liquidity in high-risk assets. The crypto market has borne the brunt: as previously reported by FXStreet, liquidations exceeded $700 million over the last 24 hours, with long positions accounting for nearly $580 million.
While Bitcoin (BTC) dropped below $74,000, Tuesday’s 10% decline in Zcash left it vulnerable to further losses below $1,000. The fall in ZEC outweighed the potential benefits of Grayscale’s front-page marketing campaign in the Wall Street Journal and its allocation of sponsor fees to Zcash’s network development, marketing, community and education.
The correction nevertheless suggests that markets are factoring in the possibility of a 25 bps rate hike. Once that occurs, crypto prices could stabilise or even recover.
Why have Zcash derivatives turned bearish?
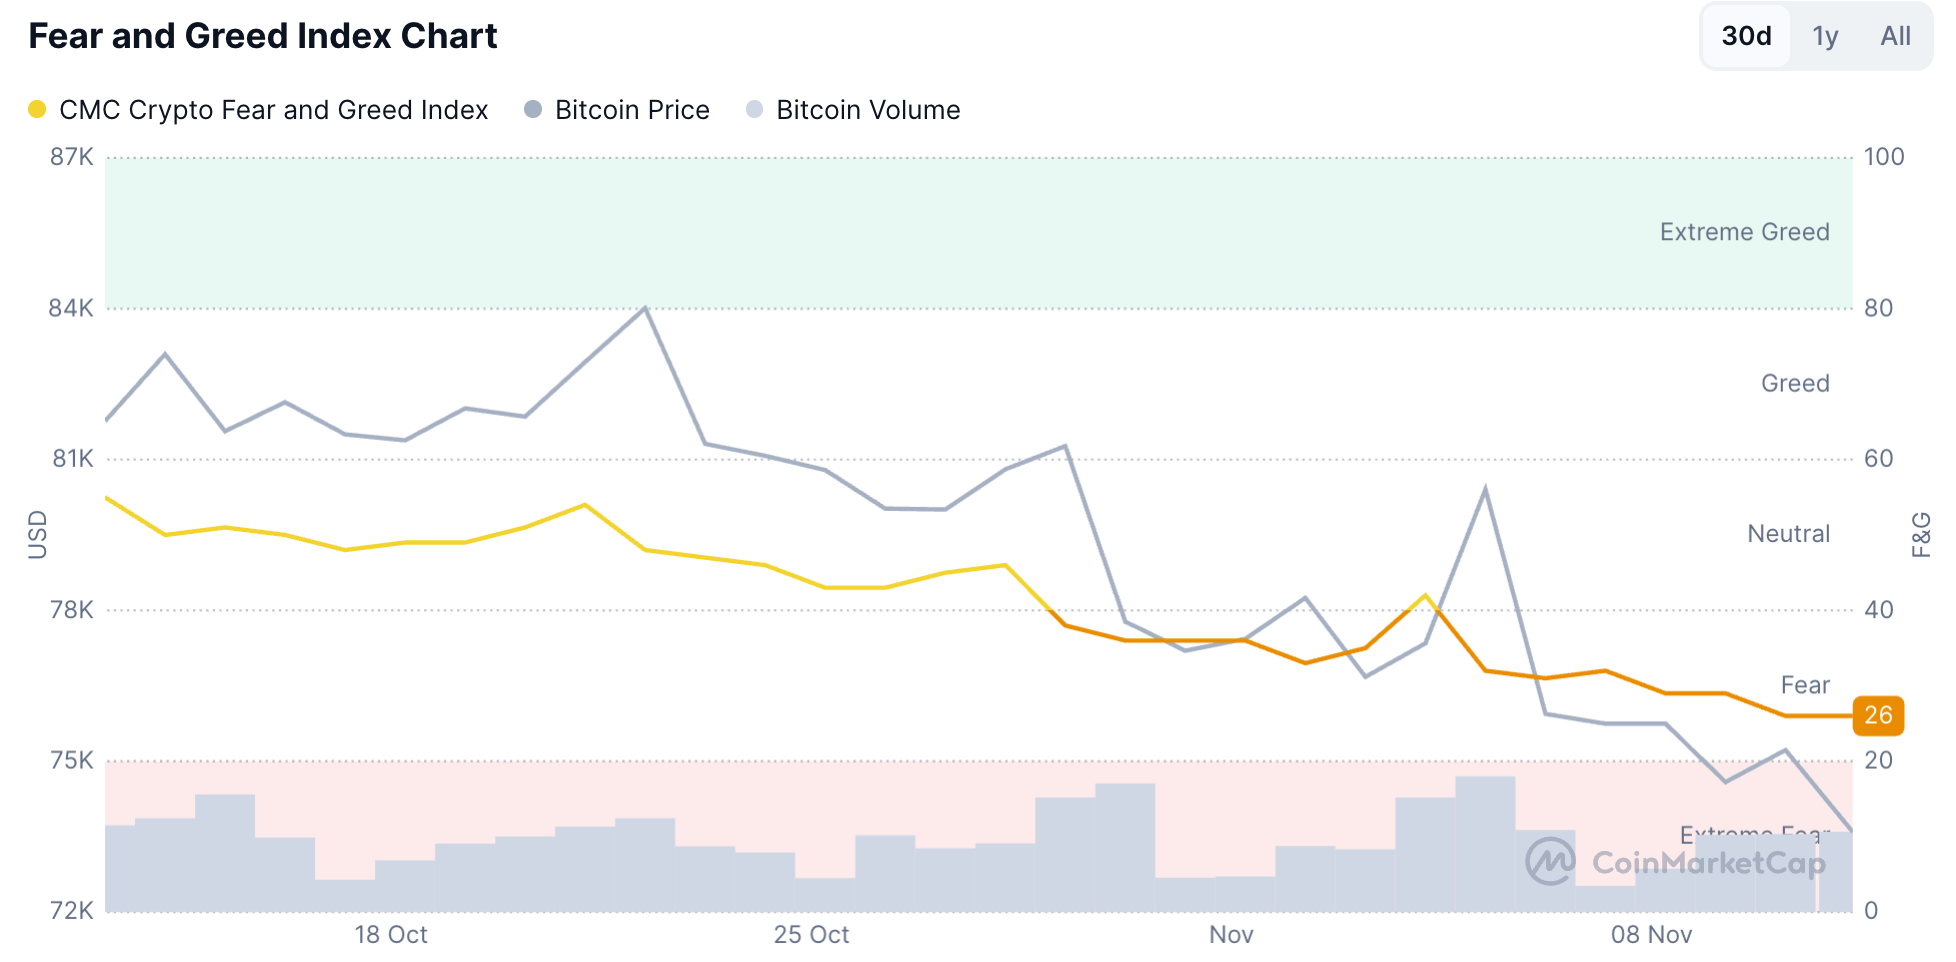
As investor fears peak, selling dominates the crypto derivatives market. CoinMarketCap’s Fear and Greed Index has fallen to 26 on Wednesday from 42 last week, signalling a sustained deterioration in risk appetite following the Democratic Party’s victory in last week’s US midterm elections and, more recently, mounting inflation concerns.
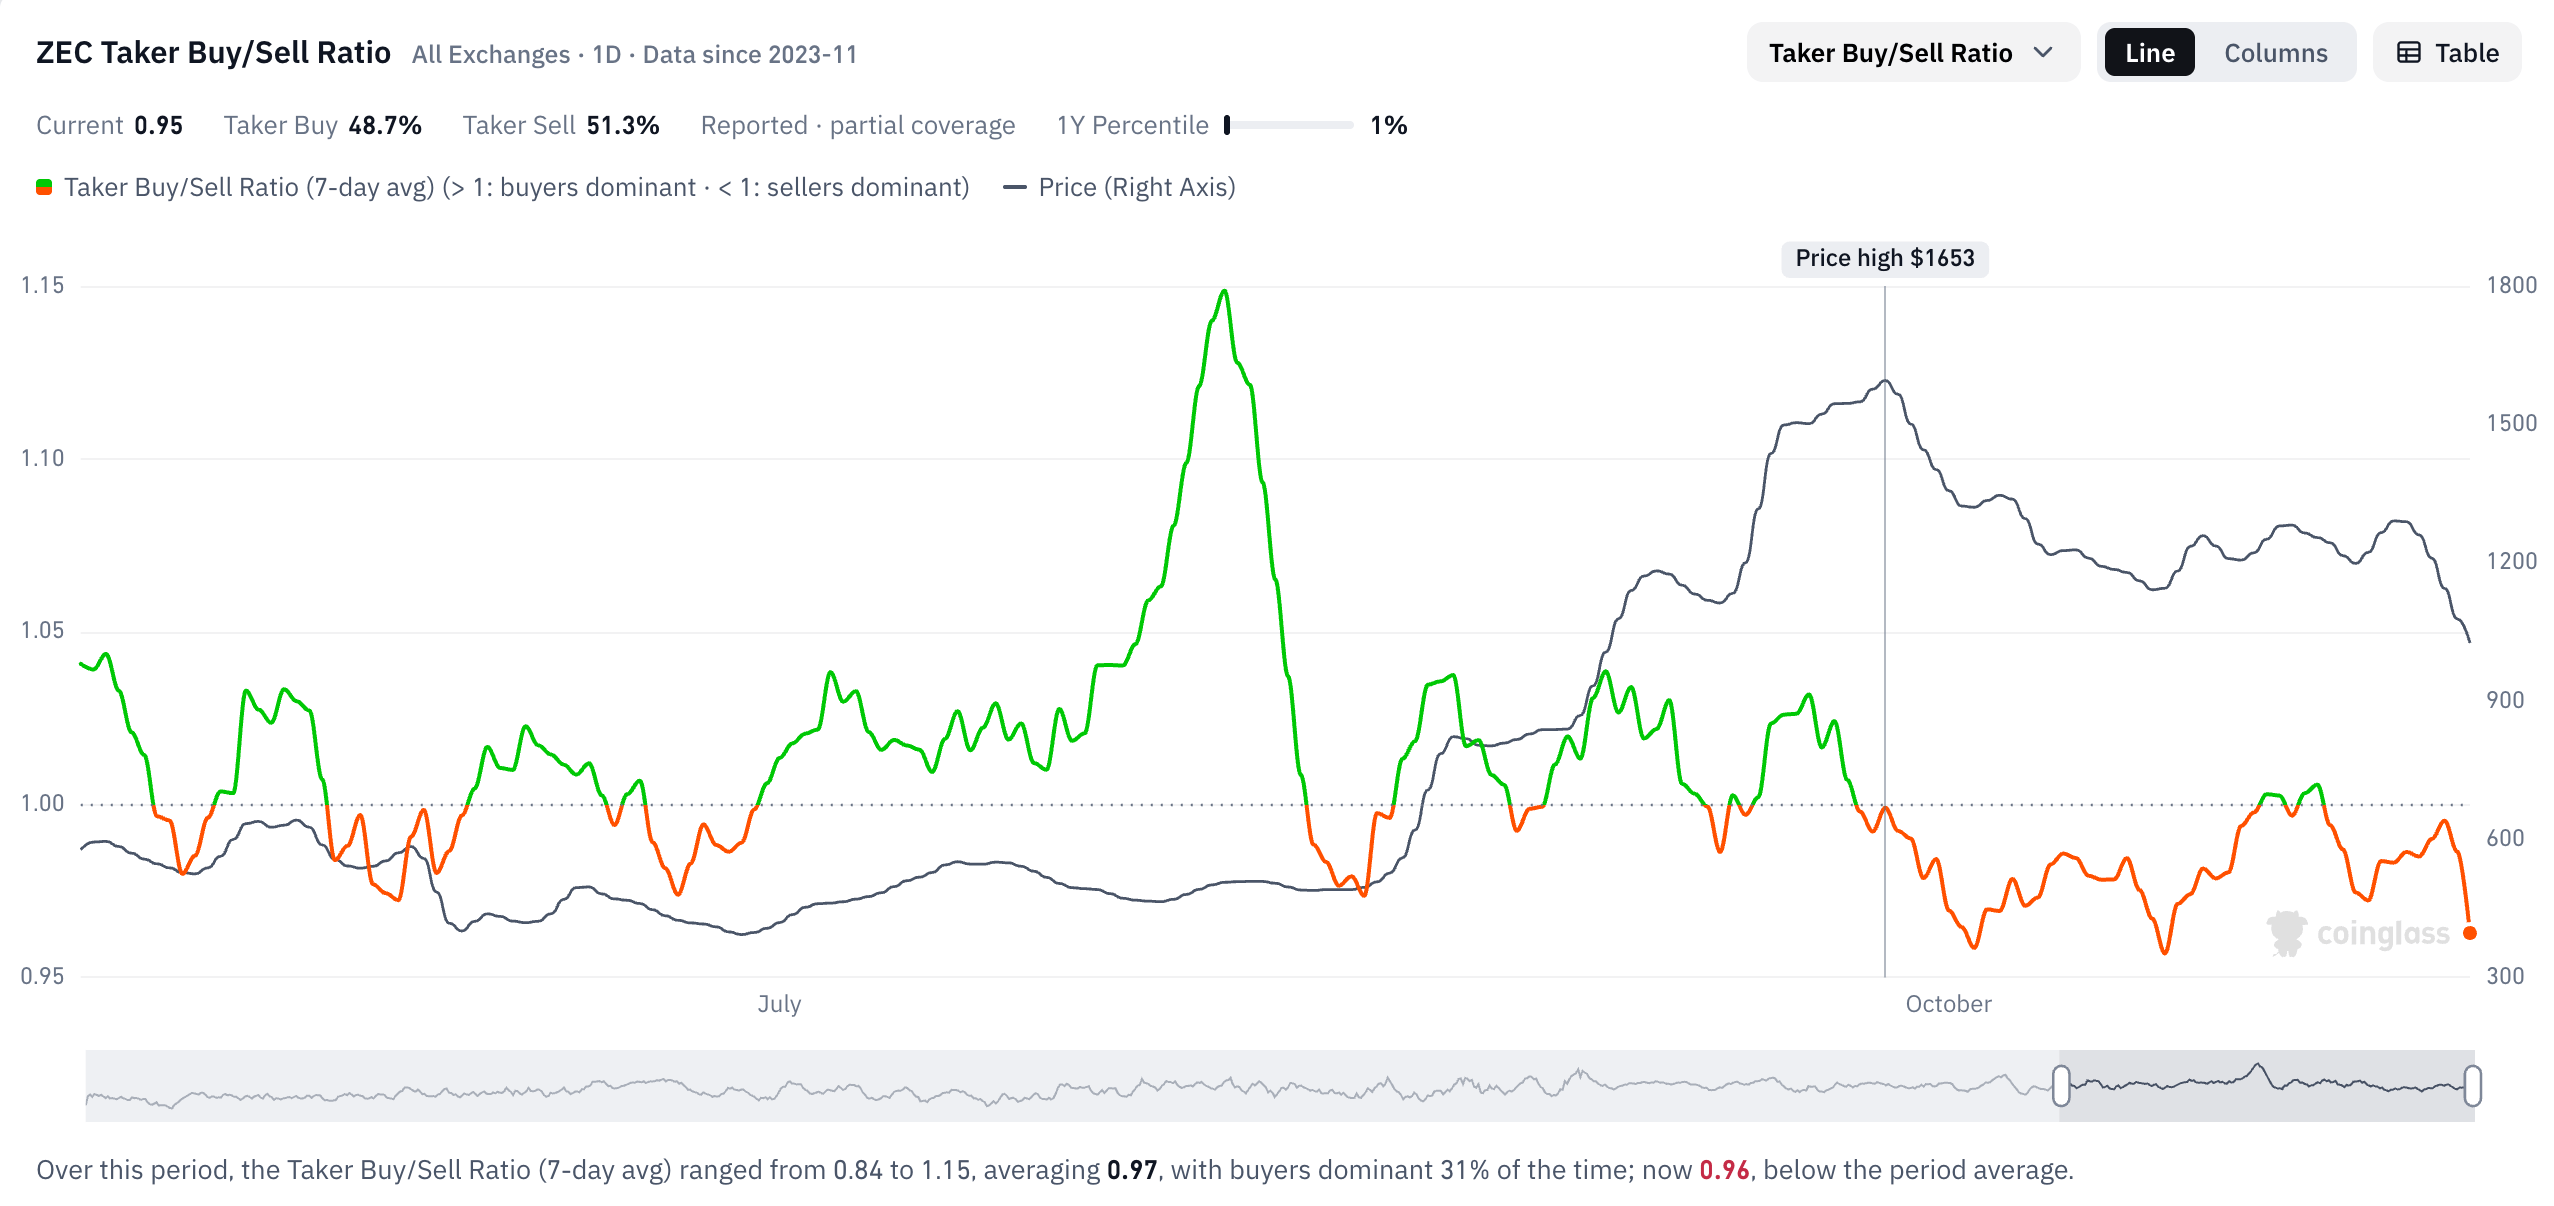
Zcash’s futures taker buy-to-sell ratio has slipped below 1 to 0.95 on Wednesday, according to CoinGlass. This suggests that incoming market orders are immediately consuming resting bids. As the wider crypto market retreats, diminishing buy-side liquidity points to downward pressure and suggests panic selling.
Technical outlook: Can Zcash defend $1,000?
At the time of writing on Wednesday, Zcash is trading 3% lower, extending its steep five-day slide. The privacy coin’s correction has taken it below the 50-day Exponential Moving Average (EMA) of $1,202 and closer to the longer-term 200-day EMA at $880.
Tuesday’s 10% decline confirmed a bearish break from the consolidation range defined by the October 8 high of $1,340 and low of $1,112. Zcash also closed below horizontal support at $1,050, which had underpinned its October 18 rebound, clearing the way for a move towards the 200-day EMA at $880.
Daily-chart indicators favour further downside. The Moving Average Convergence Divergence (MACD) is moving below zero with an expanding negative histogram, while sustained selling pressure has pulled the Relative Strength Index (RSI) down to 36.
To reduce near-term bearish pressure, Zcash needs to regain former support levels near $1,050 and $1,112, which now act as resistance. Such a recovery would reopen the route to the 50-day EMA at $1,202.
(The technical analysis of this story was written with the help of an AI tool. Know more.)
POPULAR ARTICLES
1India Gold price today: FXStreet data shows an increase in Gold prices2Fed policy: December hike viewed as a done deal, with 50bps risk – TD Securities3Dogecoin Price Forecast: What next as DOGE falls to a new yearly low?4US Dollar: How is hot CPI driving yields and Fed bets higher? – Rabobank5US inflation: What range does Societe Generale’s core PCE guidance suggest?6Why is the New Zealand Dollar gaining despite lower RBNZ rate hike odds?7Zcash Price Forecast: Can ZEC Hold $1,000 Support as Hot US CPI Data Counters Grayscale’s Marketing?8Silver Price Forecast: Below pivotal resistance at $53.00, XAG/USD bears retain control9Fed rate-hike odds help United States Dollar Index hold steady


Get Started!
Sign up and access the Global Markets in less than 3 minutes

Connect With Us












The information provided on this website is of a general nature only and does not constitute personal financial advice. Before acting on any information on this website, you should consider the suitability of the information in relation to your objectives, financial situation and needs. Investing in CFDs and FX Margin Contracts carries significant risks and is not suitable for all investors. You may lose more than your initial deposit. You do not own, or have, any interest in the underlying asset. We recommend that you seek independent advice and ensure you fully understand the risks involved before trading. It is important that you read and consider the disclosure document before you acquire any product listed on the website. The information and advertisements offered on this website are not intended for use by any person in any country or jurisdiction where such use would be contrary to local laws and regulations. The Products and Services offered on this website are not intended for residents of the United States, Malaysia and Thailand.
TMGM is authorized and regulated in various jurisdictions.
Trademax Australia Limited, trading as TMGM, is regulated by the Australian Securities and Investments Commission (ASIC), AFSL no. 436416 and is located at Level 28, One International Tower, 100 Barangaroo Avenue, 2000 Sydney, NSW Australia.
Email: support@tmgm.com.au
Trademax Global Limited, trading as TMGM, is authorized and regulated by the Vanuatu Financial Services Commission (VFSC), registration number 40356 and registered at 1276, Kumul Highway, Port Vila, Vanuatu, Republic of Vanuatu.
Email: support@tmgm.com
Trademax Global Markets (SE) Limited, trading as TMGM, is authorized and regulated by the Financial Services Authority (FSA) of Seychelles, with license number SD224. The company is registered at Office No 13, Providence Estate ABIS Centre, Mahe, Seychelles.
Email: support@tmgm.com
Trademax Global Markets (International) Pty Ltd, trading as TMGM, is authorized and regulated by the Financial Services Commission, Mauritius (FSC) with license no. GB22201012, and registered at 33, Edith Cavell Street C/o IQ EQ Fund Services (Mauritius) Ltd Port Louis, 11324 Mauritius.
Email: support@tmgm.com
Copyright © TMGM. All rights reserved