

Trading
Explore a wide range of markets with competitive pricing, deep liquidity, and advanced trading tools.
Learn More 
Platform
Trade seamlessly with TMGM's powerful platform, built for speed, precision, and a superior trading experience.
Learn More Trading Platform
Academy
Learn the fundamentals of trading with beginner-friendly resources, including guides, webinars, and market insights.
Learn More News & Analysis
Get real-time market updates and expert analysis to stay ahead of trading opportunities
Learn More News & Analysis
About
Learn what sets TMGM apart — our global presence, regulatory strength, and commitment to innovation in trading.
Learn More Why Choose TMGM
Sponsorship
BTC faces risk of sharp swings as derivatives leverage rises: Bitcoin Price Forecast
- $73,800 is Bitcoin’s approximate trading level on Wednesday. It had dropped to $72,727 after the previous day’s hot US inflation data.
- $95 million left US-listed BTC spot ETFs on Tuesday, extending withdrawals to a fourth consecutive day.
- Heavy leverage in BTC derivatives raises the risk of an abrupt move in either direction, reports indicate.
$73,800 is Bitcoin’s (BTC) approximate trading level on Wednesday. Gains remain constrained after a fall to $72,727 in response to the previous day’s hot US inflation data. Institutional appetite is still fading: BTC spot exchange-traded funds (ETFs) posted withdrawals of $95 million on Tuesday, their fourth consecutive day of outflows. A K33 Research report points to mounting derivatives leverage and the associated risk of sharp BTC moves, warranting caution among traders.

0.4% US CPI rise lifts yields and US Dollar, pressures BTC
October’s headline US Consumer Price Index (CPI) increased 0.4%, exceeding the market forecast of 0.3%, according to Tuesday’s closely watched release. Excluding volatile food and energy prices, core CPI advanced 0.3%. That matched September’s rise and exceeded the 0.2% estimate.
Annual inflation readings were absent from the release. October 2025 monthly data are unavailable because of the government shutdown from 1 October 2025 to 12 November 2025.
Risk appetite is weakening after the above-forecast US CPI readings. At the same time, rising expectations of additional monetary tightening by the Federal Reserve (Fed) are lending support to the US Dollar (USD) and US Treasuries.
Concerns over a possible December interest-rate increase by the Federal Reserve (Fed) have intensified following Tuesday’s inflation release. A stronger-than-expected core CPI rise of 0.3% could lead Fed Governor Christopher Waller to consider a larger 50-basis-point (bps) increase at the 8–9 December policy meeting, he warned. Restricting the move to 25 bps could jeopardise the Fed’s credibility, he added.
Restrictive policy must remain in place to bring inflation back to 2%, Philadelphia Fed President Anna Paulson noted. Dallas Fed President Lorie Logan, meanwhile, suggested that interest-rate increases may have to proceed more quickly than previously expected.
With the 10-year Treasury yield climbing above 5%, this hawkish position is boosting the USD and pushing yields higher. Risk assets, including Bitcoin, are under pressure as a result.
$72,727 BTC low sparks crypto liquidations
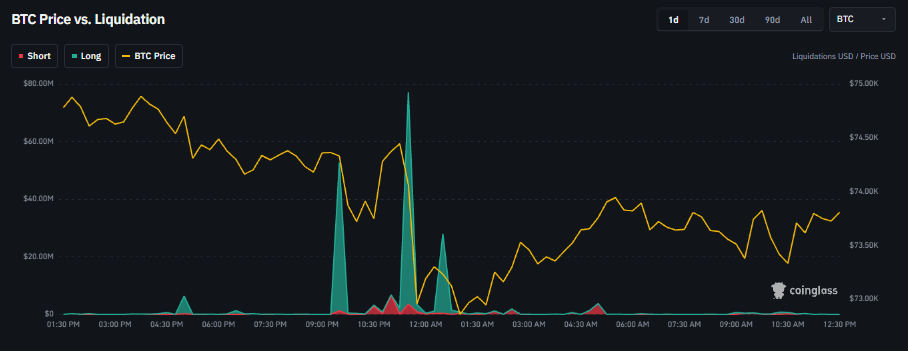
A sharp BTC correction following the above-forecast US CPI release took the price to $72,727 on Tuesday, its lowest level since 20 August. The CoinGlass liquidation chart below illustrates the move.
Liquidations spread across the crypto market as prices fell sharply. Leveraged long positions accounted for most of those wiped out, underscoring the excessive bullish exposure.
Further sharp moves remain a significant risk for Bitcoin as derivatives leverage keeps accumulating.
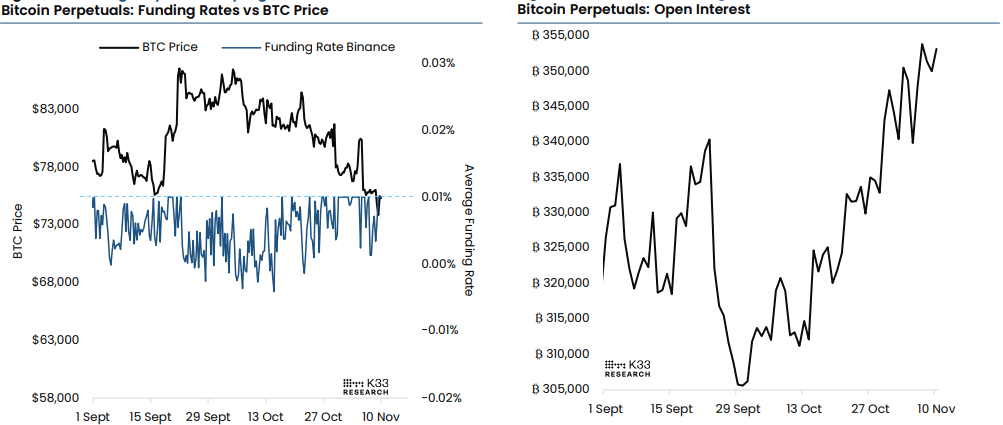
BTC perpetual futures Open Interest (OI) totals 353,000 BTC, placing it in the 99th percentile of readings over the past two years, according to K33 Research. Over the past week, annualised funding rates have averaged 8.4%. This points to continued demand for long exposure while BTC tests important support levels.
The analyst concluded: “Historically, similarly elevated open interest has coincided with price extremes and periods of substantial volatility, often preceding sharp reversals. While elevated leverage provided fuel for upside moves in June and August, current positioning appears less directional, leaving considerable scope for volatility in either direction. A breakdown could trigger substantial long liquidations, while a recovery could fuel short covering, amplifying price moves as leveraged positions unwind,”
$95 million ETF outflow extends withdrawal streak
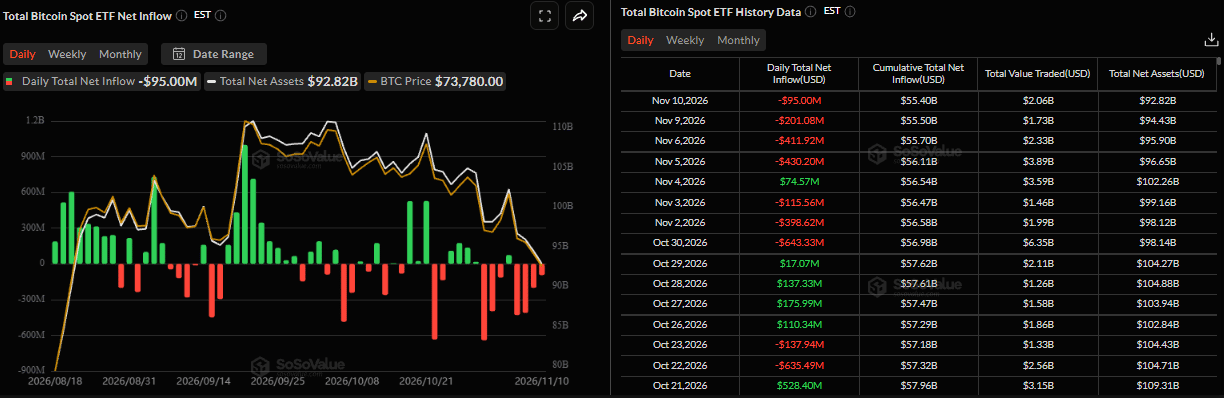
$95 million in net withdrawals hit BTC spot ETFs on Tuesday, SoSoValue data show. This was the fourth consecutive day of outflows since last week, with institutional demand for Bitcoin continuing to soften this week. Should withdrawals persist and accelerate through the rest of the week, BTC could face further pressure and a deeper price correction.
Diplomatic optimism offers potential BTC support
Near-term support for BTC could come from emerging signs of optimism. Following a G7 foreign ministers’ meeting in Paris on Tuesday, US Secretary of State Marco Rubio said the economic campaign against Iran had inflicted such damage that major combat operations were not currently needed.
US President Donald Trump has also sought to ease concerns about escalation after the midterm elections. Renewed US attacks on Iran were "highly unlikely", he told reporters, adding that negotiations to end the Middle East conflict had positive momentum. Iran, meanwhile, called on the US to meet its demands under a plan to reopen the Strait of Hormuz.
Hopes for a diplomatic breakthrough to end the US-Iran war are consequently gaining ground. Reduced geopolitical risk concerns could offer Bitcoin support in the near term.
$73,789 Bitcoin technical outlook: Rallies likely to attract selling
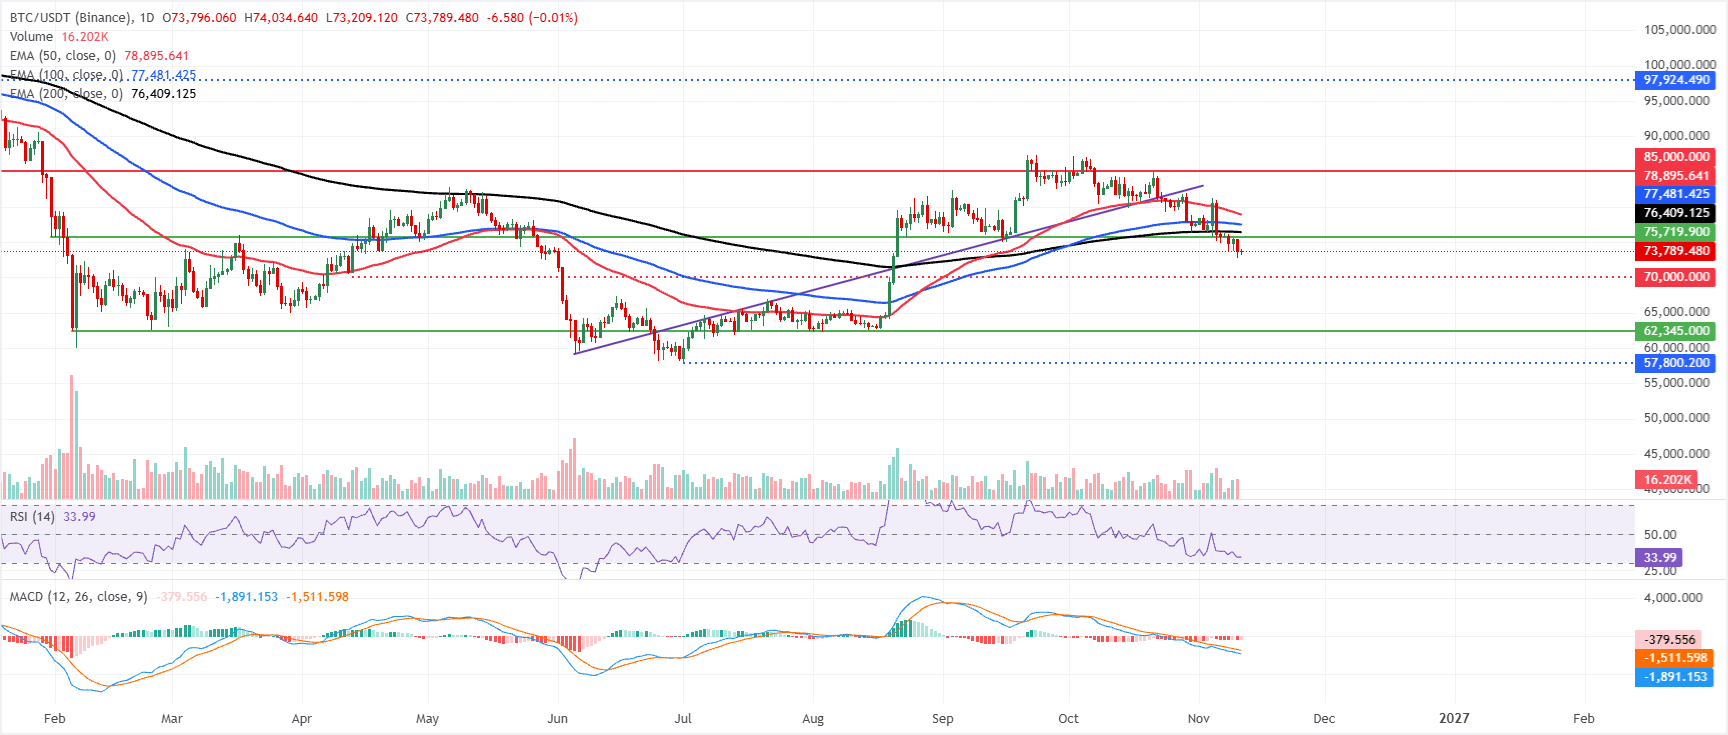
$73,789 is Bitcoin’s price at the time of writing on Wednesday. The bearish correction continues, with BTC below its 50-day, 100-day and 200-day Exponential Moving Averages (EMAs), grouped at roughly $76,400 to $78,900.
Rallies are likely to encounter selling in this configuration. On the daily chart, the Relative Strength Index (RSI) is near 33, just above oversold territory, while the Moving Average Convergence Divergence (MACD) histogram stays negative. Together, these signals underline sustained downside pressure, even with short-term conditions stretched.
The 200-day EMA around $76,409 provides the first resistance on any rebound. Next are the 100-day EMA near $77,481 and the 50-day EMA close to $78,895. Bulls would need to recover this concentrated supply zone to reduce the bearish bias. Beyond it, horizontal resistance around $85,000 presents a more significant hurdle. A daily close above that level would be needed to indicate a more lasting return to a constructive medium-term trend.
With no nearby support mapped out, a break below current levels would suggest a move towards the psychological support area around $70,000 before BTC stabilises.
(The technical analysis of this story was written with the help of an AI tool. Know more.)
Bitcoin, altcoins and stablecoins: Key questions
By market capitalisation, Bitcoin ranks as the largest cryptocurrency. It is a virtual currency intended to function as money. No single individual, group or entity can control this means of payment, removing the need for third-party involvement in financial transactions.
Any cryptocurrency other than Bitcoin is classed as an altcoin. Some, however, also exclude Ethereum because forks originate from these two cryptocurrencies. Under that interpretation, Litecoin is the first altcoin: it was forked from the Bitcoin protocol and is therefore an “improved” version of it.
Designed to maintain a stable price, stablecoins are cryptocurrencies backed by reserves of the assets they represent. Each stablecoin’s value is pegged to a commodity or financial instrument, such as the US Dollar (USD), while an algorithm or demand regulates its supply. Their primary purpose is to provide an entry and exit route for investors seeking to trade and invest in cryptocurrencies. They also enable investors to store value, as cryptocurrencies are generally prone to volatility.
The share of total cryptocurrency market capitalisation accounted for by Bitcoin is known as Bitcoin dominance. It offers a clear indication of investor interest in Bitcoin. BTC dominance is typically high before and during a bull run, when investors favour a relatively stable, large-cap cryptocurrency such as Bitcoin. When BTC dominance declines, it usually signals that investors are shifting capital and/or profits into altcoins in pursuit of higher returns. This typically sparks a surge in altcoin rallies.
POPULAR ARTICLES
1Silver Price Forecast: XAG/USD surges to near $53 despite rising US bond Yields2Euro steady against Canadian Dollar as oil prices soften3US Dollar Index gains as Fed expectations are repriced – Deutsche Bank4British Pound retreats despite hawkish BoE; weak Yen appears to limit downside5US Treasuries: Markets price in further hikes, driving bear flattening – TD Securities6Dow Jones futures rally as AI earnings and easing geopolitical risks lift market sentiment7Euro: ECB ready for new tools, Knot signals – Rabobank8December rate hike: Expectations of a Federal Reserve increase strengthen – Commerzbank9Q4 likely to bring faster German growth: ECB’s Nagel


Get Started!
Sign up and access the Global Markets in less than 3 minutes

Connect With Us












The information provided on this website is of a general nature only and does not constitute personal financial advice. Before acting on any information on this website, you should consider the suitability of the information in relation to your objectives, financial situation and needs. Investing in CFDs and FX Margin Contracts carries significant risks and is not suitable for all investors. You may lose more than your initial deposit. You do not own, or have, any interest in the underlying asset. We recommend that you seek independent advice and ensure you fully understand the risks involved before trading. It is important that you read and consider the disclosure document before you acquire any product listed on the website. The information and advertisements offered on this website are not intended for use by any person in any country or jurisdiction where such use would be contrary to local laws and regulations. The Products and Services offered on this website are not intended for residents of the United States, Malaysia and Thailand.
TMGM is authorized and regulated in various jurisdictions.
Trademax Australia Limited, trading as TMGM, is regulated by the Australian Securities and Investments Commission (ASIC), AFSL no. 436416 and is located at Level 28, One International Tower, 100 Barangaroo Avenue, 2000 Sydney, NSW Australia.
Email: support@tmgm.com.au
Trademax Global Limited, trading as TMGM, is authorized and regulated by the Vanuatu Financial Services Commission (VFSC), registration number 40356 and registered at 1276, Kumul Highway, Port Vila, Vanuatu, Republic of Vanuatu.
Email: support@tmgm.com
Trademax Global Markets (SE) Limited, trading as TMGM, is authorized and regulated by the Financial Services Authority (FSA) of Seychelles, with license number SD224. The company is registered at Office No 13, Providence Estate ABIS Centre, Mahe, Seychelles.
Email: support@tmgm.com
Trademax Global Markets (International) Pty Ltd, trading as TMGM, is authorized and regulated by the Financial Services Commission, Mauritius (FSC) with license no. GB22201012, and registered at 33, Edith Cavell Street C/o IQ EQ Fund Services (Mauritius) Ltd Port Louis, 11324 Mauritius.
Email: support@tmgm.com
Copyright © TMGM. All rights reserved