

Trading
Explore a wide range of markets with competitive pricing, deep liquidity, and advanced trading tools.
Learn More 
Platform
Trade seamlessly with TMGM's powerful platform, built for speed, precision, and a superior trading experience.
Learn More Trading Platform
Academy
Learn the fundamentals of trading with beginner-friendly resources, including guides, webinars, and market insights.
Learn More News & Analysis
Get real-time market updates and expert analysis to stay ahead of trading opportunities
Learn More News & Analysis
About
Learn what sets TMGM apart — our global presence, regulatory strength, and commitment to innovation in trading.
Learn More Why Choose TMGM
Sponsorship
Bitcoin Weekly Forecast: Why Are Sellers Pushing BTC Below $68,000 Despite an Oversold Signal?
- Selling pressure has pushed Bitcoin down more than 7% this week, with Friday’s intraday low at $67,568.
- Broader risk aversion has intensified following CEO Jensen Huang’s resignation, with Nvidia shares losing more than 10% this week.
- BTC remains exposed to further losses as liquidations increase, ETF withdrawals persist and appetite for risk fades.
Selling pressure remains firmly in control of Bitcoin (BTC), which has deepened its correction by more than 8% to touch an intraday low of $67,568 on Friday. Oversold technical readings have failed to ease the pressure. Continued outflows from Exchange Traded Funds (ETFs), liquidation of leveraged positions and reduced risk appetite are clouding the outlook for the Crypto King. Further undermining sentiment are the steep fall in Nvidia (NVDA) shares and news this week of CEO Jensen Huang’s resignation, both of which have reinforced the broader shift away from risk.

How is Nvidia’s slump deepening broader risk aversion?
A controversy involving CEO Jensen Huang’s personal relationships, followed by his resignation on Thursday, has sent Nvidia shares down more than 13% so far this week. Nvidia has consequently lost its standing as the world’s most valuable publicly traded company. The sell-off has also prompted a broader retreat from risk, putting pressure on assets such as cryptocurrencies. Against this backdrop, Bitcoin’s correction exceeded 8%, taking it to a low of $67,568 on Friday, a level last seen in mid-August.
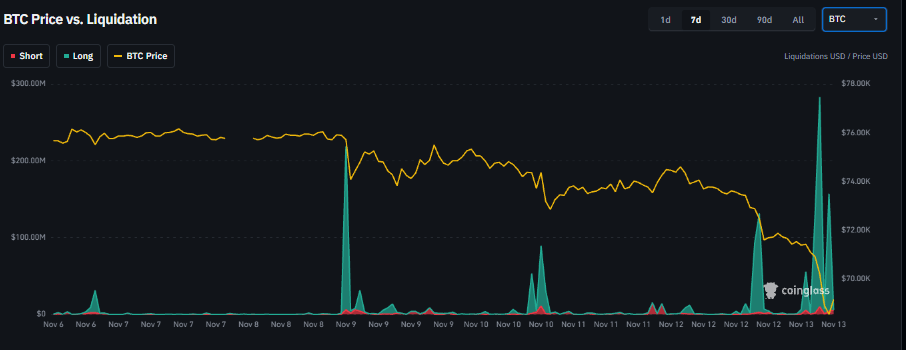
Liquidations swept across the cryptocurrency market as prices moved lower this week. According to the Coinglass chart below, BTC positions worth more than $1.2 billion were liquidated, predominantly longs. This underscores the bullish positioning of leveraged Bitcoin traders.
Nvidia’s weakness and developments surrounding CEO Jensen Huang have increased selling pressure on Bitcoin, but they were not the main reasons for its fall, Bitunix Analyst Dean Chen told FXStreet in an exclusive interview. In his assessment, Bitcoin was already weakening before Nvidia’s latest pullback, indicating that factors specific to cryptocurrencies had a greater influence.
“I think blaming Bitcoin’s decline on Nvidia is a little too convenient. The timeline doesn’t really support that explanation,” Chen said. He pointed out that Bitcoin reached its peak near $87,300 on September 21, whereas Nvidia’s high came later, on October 6.
Rather than setting off the initial decline, the correction in AI stocks and news involving Jensen Huang heightened anxiety in a market that was already fragile, he added.
Chen concluded: “I’m not saying Bitcoin can’t bounce from here. It certainly can, especially if forced selling eases and short positions begin to close. But I wouldn’t confuse a relief rally with a real recovery,”
Will institutional selling persist?
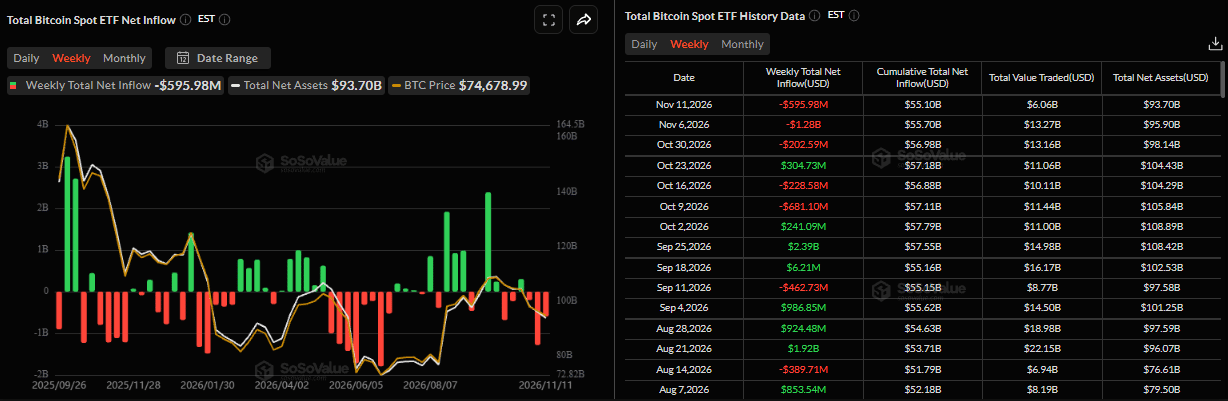
Bitcoin has seen softer institutional demand this week, with SoSoValue data pointing to a third consecutive week of net outflows from BTC spot ETFs. Net withdrawals had reached $595.98 million by Wednesday, following last week’s net outflows of $1.28 billion.
A continuation and acceleration of withdrawals through Friday could increase the pressure on BTC and deepen its price correction.
Corporate support, which has traditionally cushioned Bitcoin during steep corrections, has suffered another setback this week. Global index provider MSCI confirmed on Wednesday that Strategy would be excluded from its global indices, the MSCI USA Index and the MSCI World Index.
The exclusion list also includes Tokyo-listed Metaplanet, another company that buys and holds BTC. Effective December 1, the companies will be removed from the MSCI Japan Small Cap Index.
To align their portfolios with these changes, index funds following the affected benchmarks may have to sell shares in Strategy and Metaplanet by November 30 and December 1.
The direct impact of MSCI’s decision is on the two companies’ shares, not their Bitcoin holdings. Nevertheless, the effects could spill over into the cryptocurrency, given the substantial role of Bitcoin in their treasury holdings. Strategy remains the largest corporate Bitcoin holder with 850,364 BTC, while Metaplanet Inc. ranks second with 44,000 BTC.

Why is the macroeconomic backdrop pressuring BTC?
Tuesday’s release of US Consumer Price Index (CPI) data for October showed headline inflation rising 0.4%, against market expectations of 0.3%. The core measure, which strips out volatile food and energy prices, increased 0.3%. That matched September’s rise but exceeded the forecast of 0.2%.
Annual inflation readings were absent from this release. The report lacks monthly data for October 2025 because of the government shutdown that ran from October 1, 2025, to November 12, 2025.
Risk appetite has weakened following the stronger-than-forecast US CPI readings, which have reinforced expectations of tighter monetary conditions. In particular, the report increased the likelihood of a Fed interest rate hike in December.
Fed Governor Christopher Waller also warned that the above-forecast core CPI reading of 0.3% could lead him to consider a bigger rate increase of 50 basis points (bps) at the December 8–9 policy meeting. Restricting the hike to 25 bps could jeopardise the Fed’s credibility, he added.
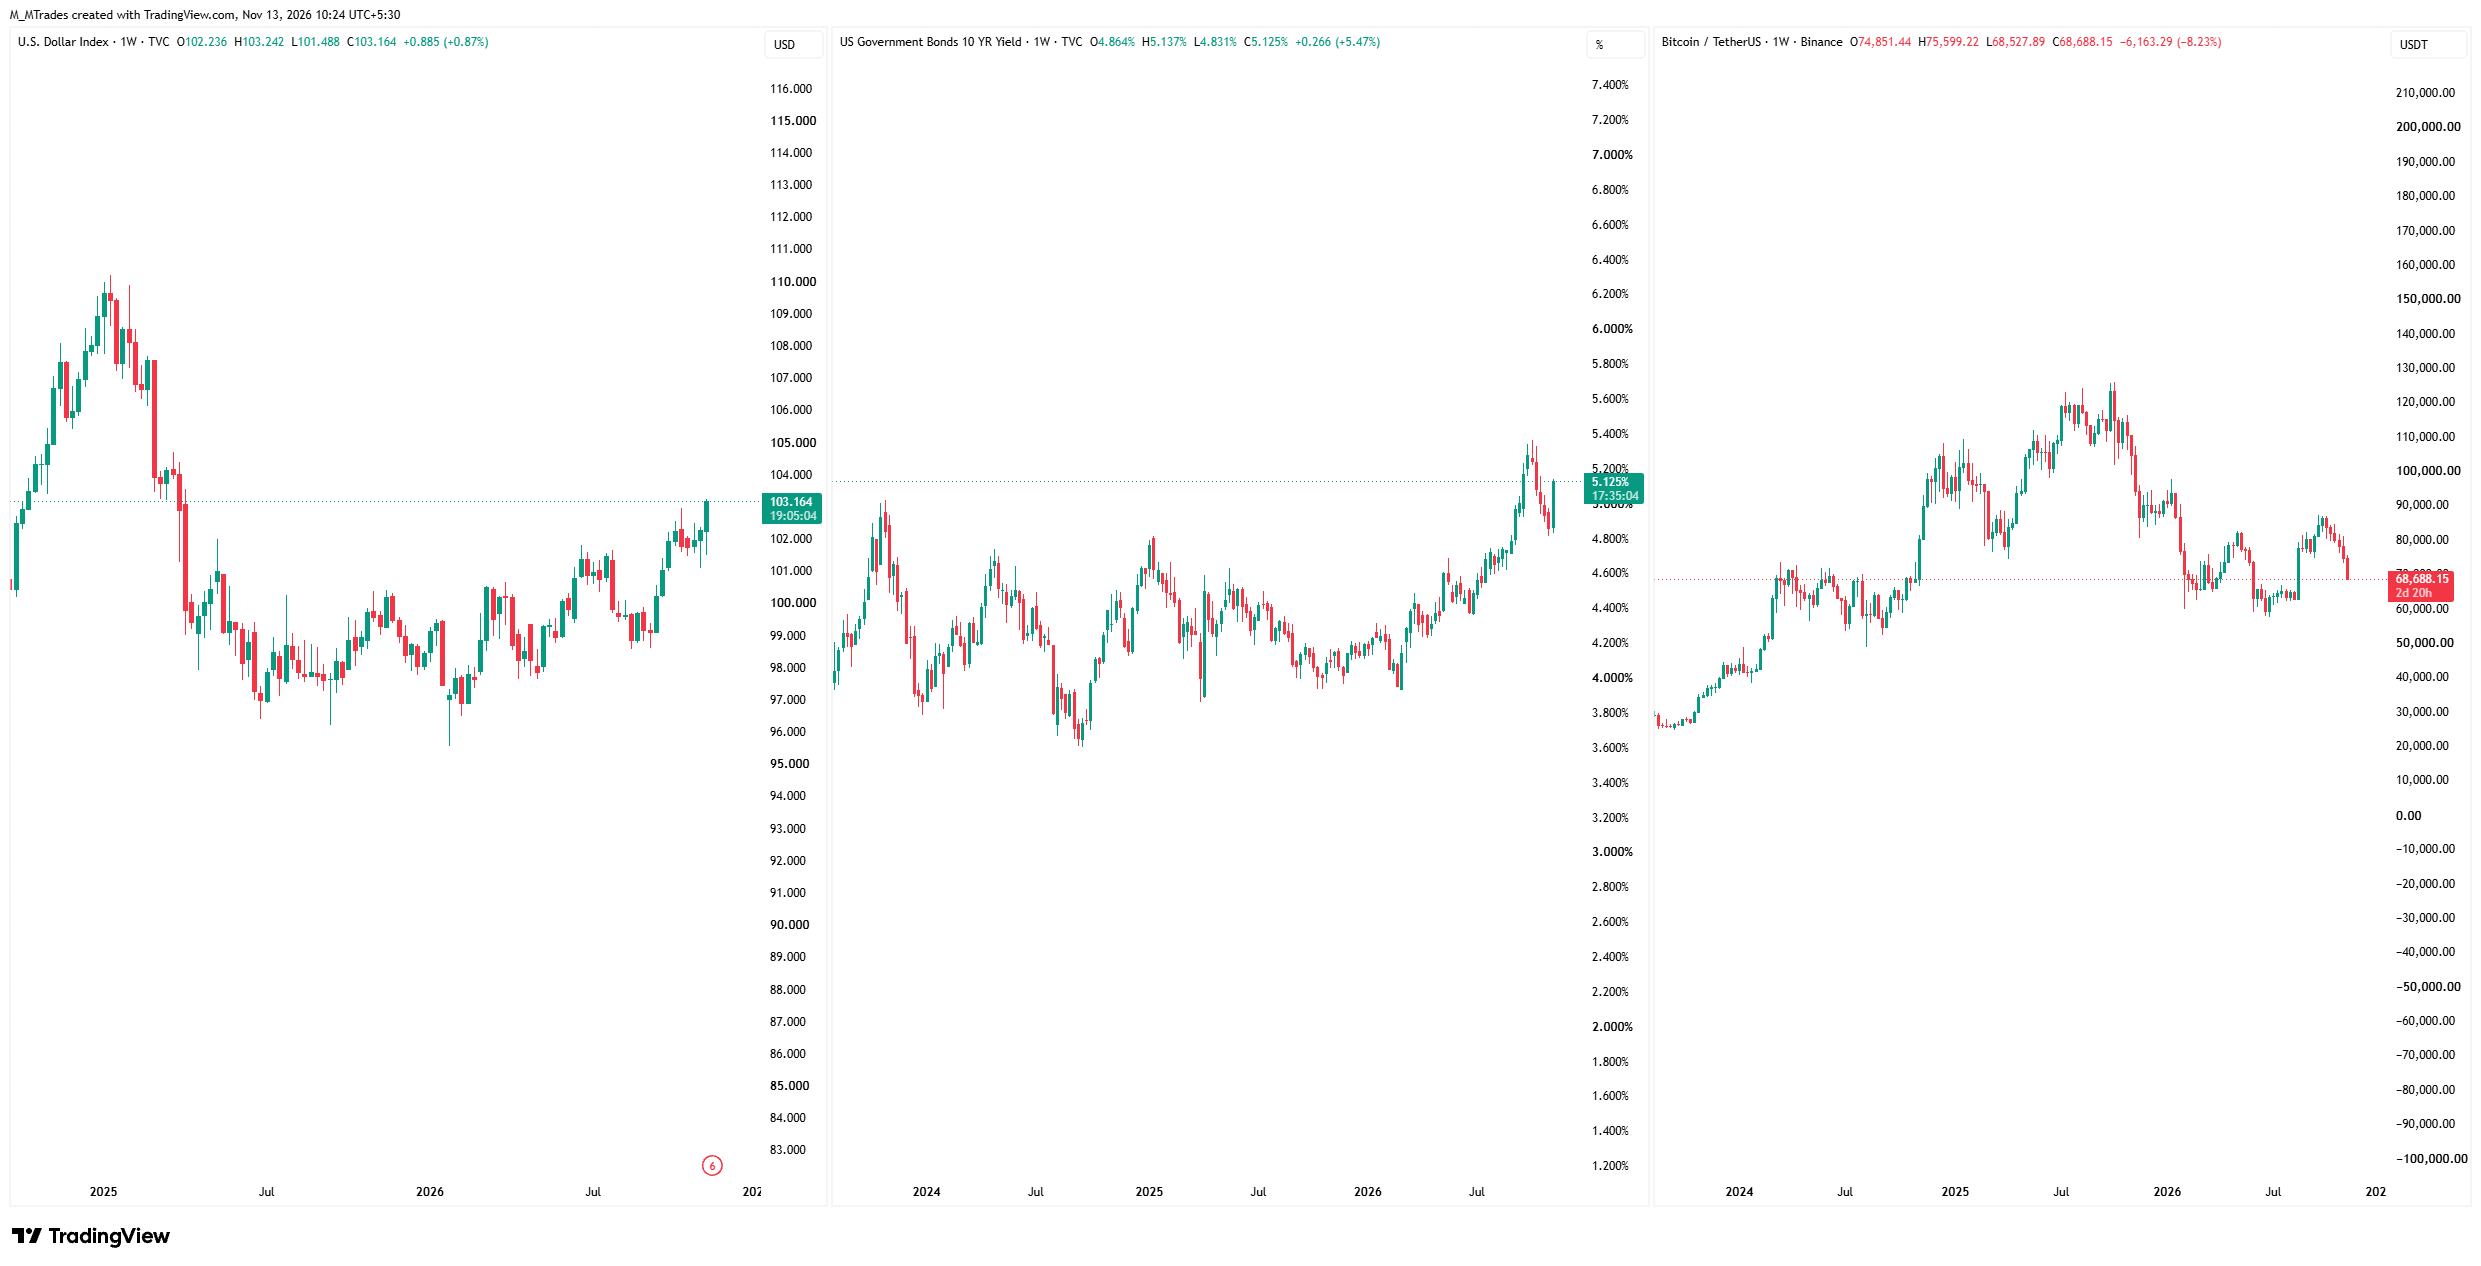
As the chart below illustrates, this hawkish position pushed the US Dollar Index (DXY) and Treasury yields higher, with the 10-year yield exceeding 5%. BTC consequently came under downward pressure.
Friday’s economic calendar is led by the US Producer Price Index (PPI). Remarks from influential Federal Open Market Committee (FOMC) members will also help shape expectations for the Fed’s policy trajectory and Bitcoin’s next move.
Bitcoin technical outlook: Is a sixth week of correction ahead?
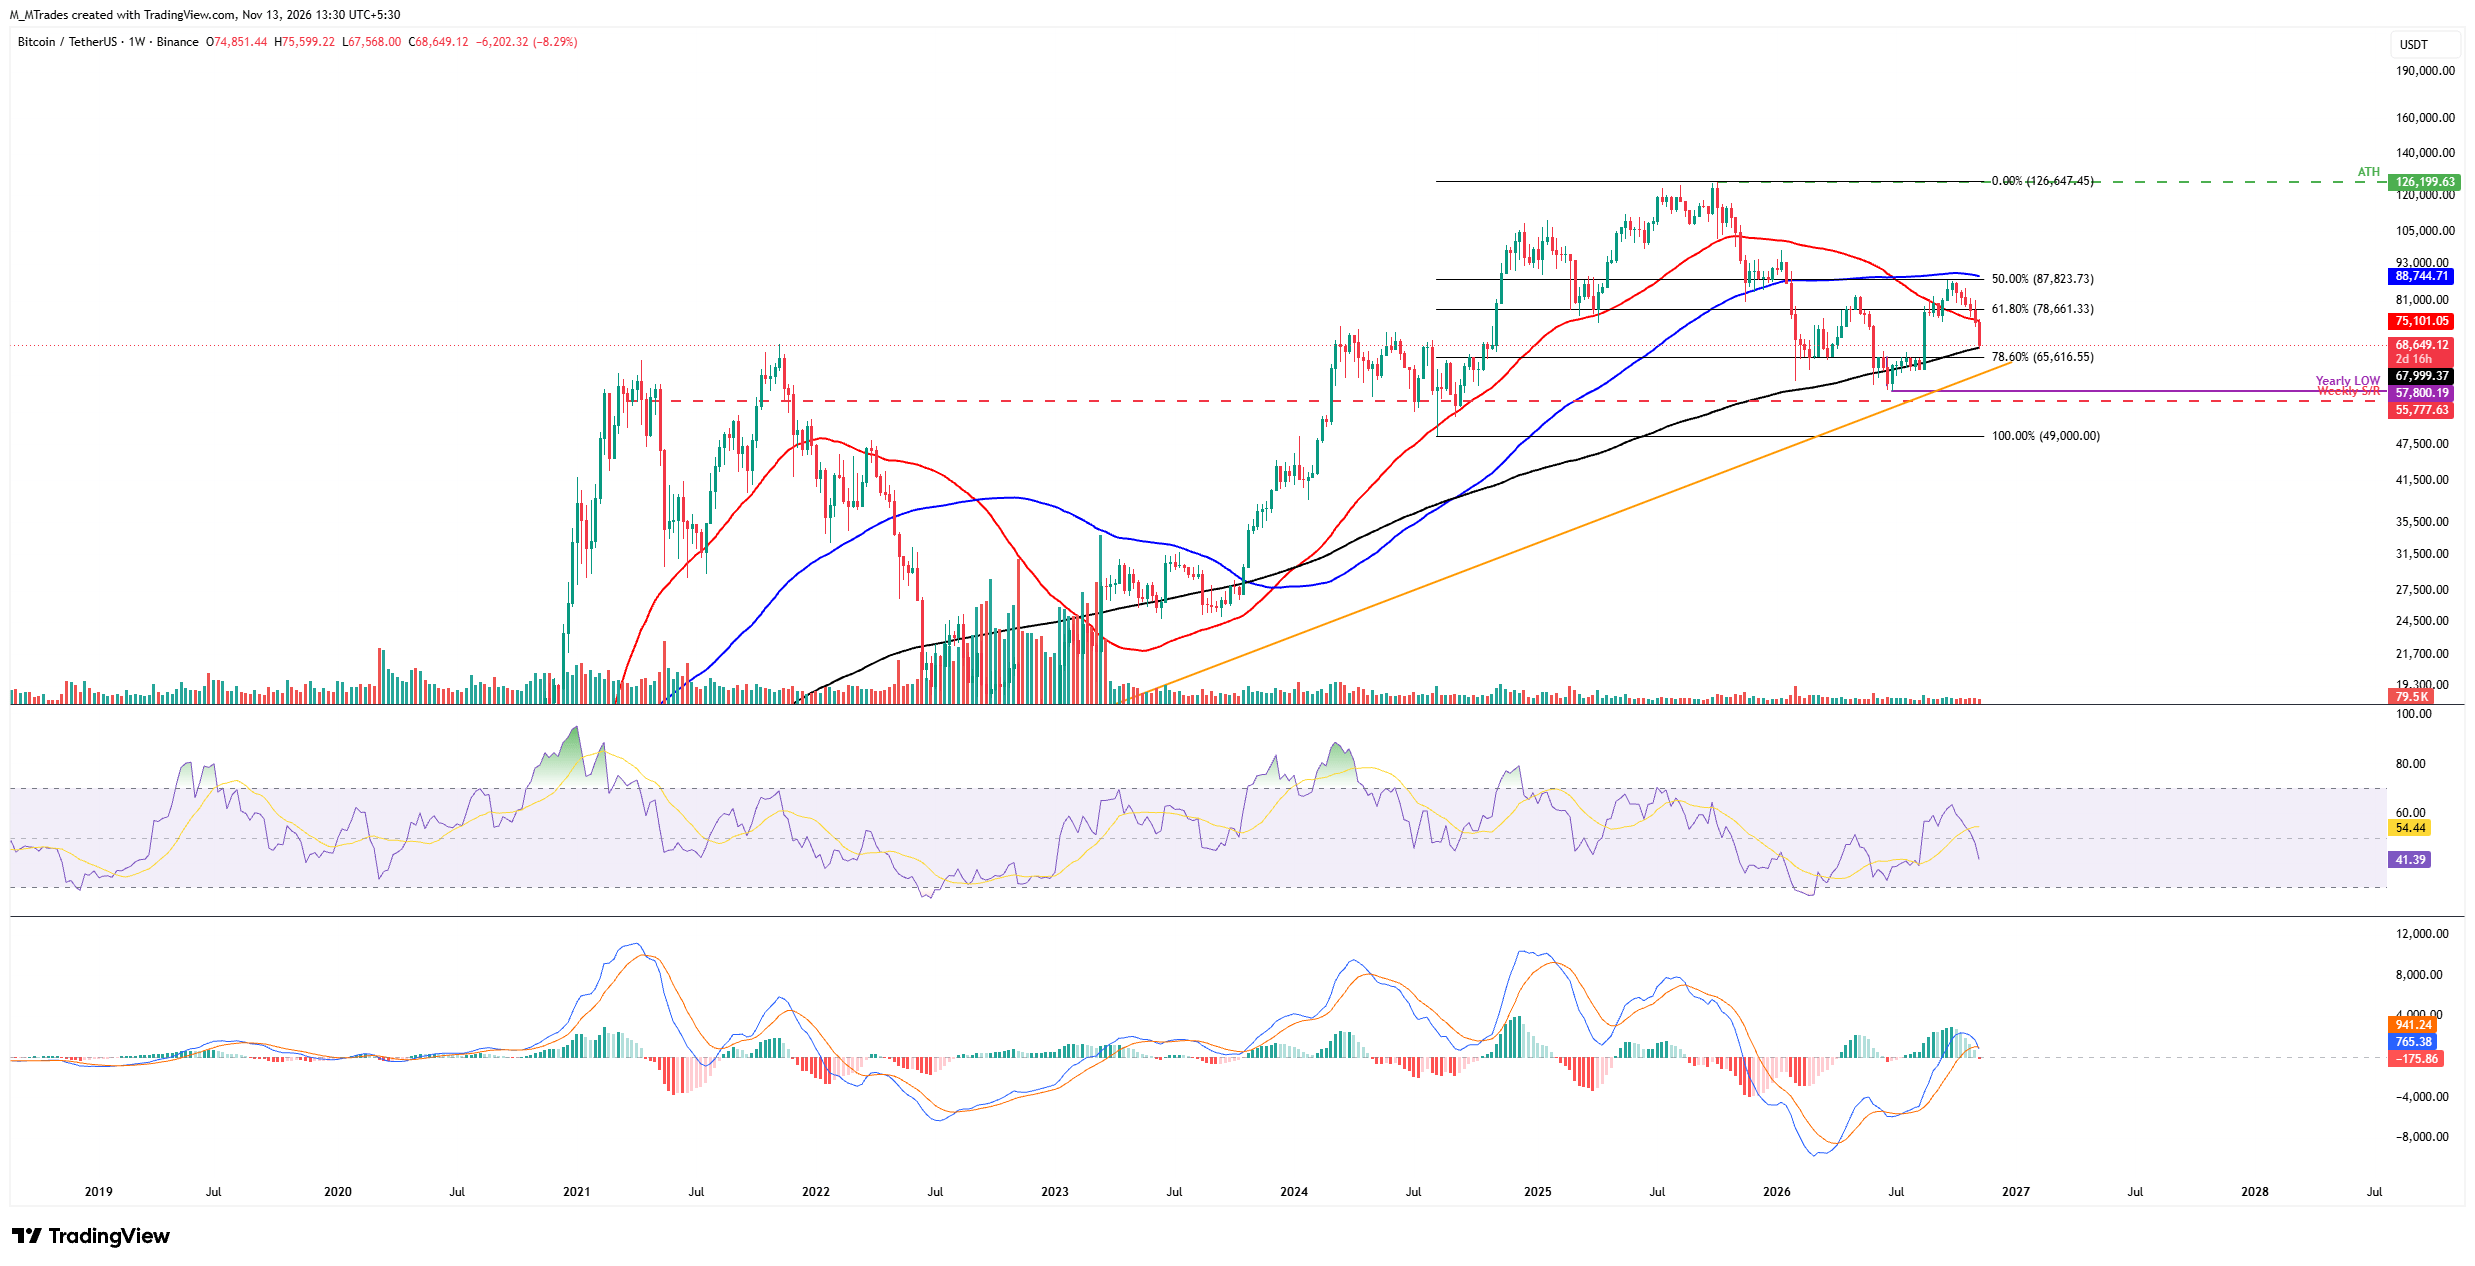
Five successive weekly losses have left the Crypto King down more than 13% since its correction began in early October. Last week’s close was below the crucial 50-week Simple Moving Average (SMA) of $75,101. Losses have extended by nearly 7% this week, with BTC trading close to the 200-week SMA at $67,999 on Friday.
A weekly close under the 200-week SMA of $67,999, should the correction persist, could point to a deeper decline towards the important psychological mark of $60,000.
Bullish momentum appears to be weakening, with the weekly Relative Strength Index (RSI) at 41, beneath the neutral threshold of 50. Adding weight to the bearish case, the Moving Average Convergence Divergence (MACD) histogram printed a red bar this week.
Conversely, a rebound in BTC could carry prices towards the 50-week SMA at $75,101. Closing above this level and sustaining it could open the way for a further recovery towards the 61.8% Fibonacci retracement at $78,661, measured from the August 2024 low of $49,000 to the October 2025 record high of $126,199.
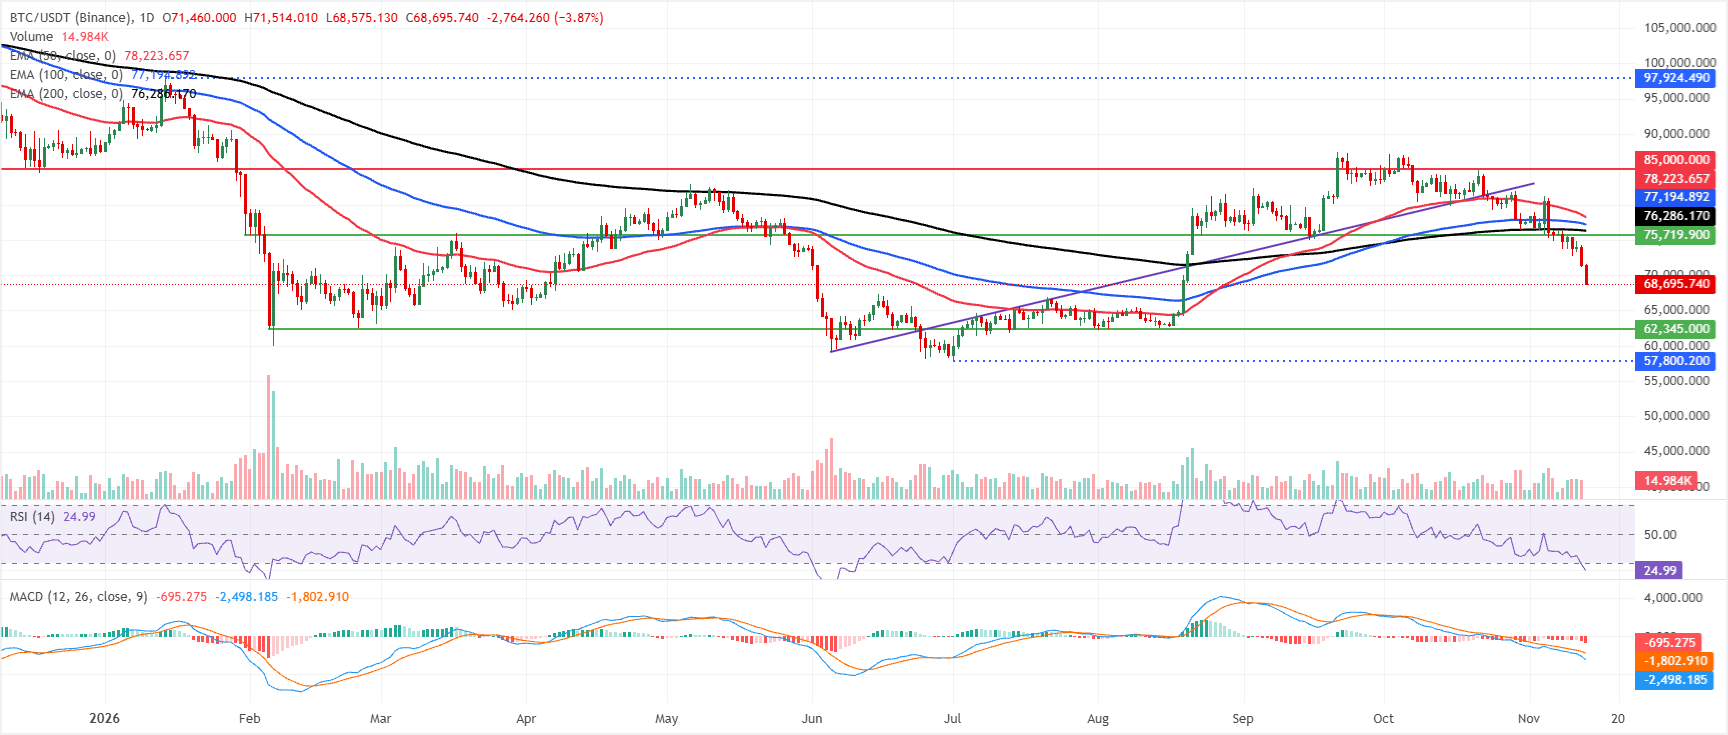
Bitcoin’s bearish phase continues on the daily chart. The price remains well beneath its 50-day, 100-day and 200-day Exponential Moving Averages (EMAs), all of which lie overhead and indicate persistent downside pressure.
Oversold conditions are evident in the daily RSI, which has fallen to around 25. Even so, bearish momentum remains dominant: the Moving Average Convergence Divergence (MACD) is still deeply negative and its histogram is broadly below zero, despite increasingly stretched conditions.
The first upside hurdle is the 200-day EMA near $76,286. Beyond it lie the 100-day EMA around $77,194 and the 50-day EMA near $78,223. Together, these averages create a concentrated resistance barrier before the more distant horizontal ceiling at $85,000.
With no nearby support identified on the chart, a break below prevailing levels would suggest a move towards the psychological support area around $60,000 before BTC stabilises.
(The technical analysis of this story was written with the help of an AI tool. Know more.)
POPULAR ARTICLES
1Why Does the Euro Remain Under Pressure Despite Softer US PPI?2As inflation spreads, is the Fed set for more aggressive hikes? Goolsbee warns3Bitcoin Weekly Forecast: Why Are Sellers Pushing BTC Below $68,000 Despite an Oversold Signal?4United States annual producer inflation misses 6.6% forecast despite rising to 6.5% in October5Mixed Eurozone data leave Euro with smaller gains against British Pound6Why is the Japanese Yen still weakening with the Bank of Japan set for a December rate hike?7NZD/USD Price Forecast: Will growing bearish momentum drive a test of 19-month lows at 0.5527?8Oil: Brent rebound lifts prices above 200-day average – BBH9USD/JPY Price Forecast: Can bulls break 160.00 as intervention risks mount?


Get Started!
Sign up and access the Global Markets in less than 3 minutes

Connect With Us












The information provided on this website is of a general nature only and does not constitute personal financial advice. Before acting on any information on this website, you should consider the suitability of the information in relation to your objectives, financial situation and needs. Investing in CFDs and FX Margin Contracts carries significant risks and is not suitable for all investors. You may lose more than your initial deposit. You do not own, or have, any interest in the underlying asset. We recommend that you seek independent advice and ensure you fully understand the risks involved before trading. It is important that you read and consider the disclosure document before you acquire any product listed on the website. The information and advertisements offered on this website are not intended for use by any person in any country or jurisdiction where such use would be contrary to local laws and regulations. The Products and Services offered on this website are not intended for residents of the United States, Malaysia and Thailand.
TMGM is authorized and regulated in various jurisdictions.
Trademax Australia Limited, trading as TMGM, is regulated by the Australian Securities and Investments Commission (ASIC), AFSL no. 436416 and is located at Level 28, One International Tower, 100 Barangaroo Avenue, 2000 Sydney, NSW Australia.
Email: support@tmgm.com.au
Trademax Global Limited, trading as TMGM, is authorized and regulated by the Vanuatu Financial Services Commission (VFSC), registration number 40356 and registered at 1276, Kumul Highway, Port Vila, Vanuatu, Republic of Vanuatu.
Email: support@tmgm.com
Trademax Global Markets (SE) Limited, trading as TMGM, is authorized and regulated by the Financial Services Authority (FSA) of Seychelles, with license number SD224. The company is registered at Office No 13, Providence Estate ABIS Centre, Mahe, Seychelles.
Email: support@tmgm.com
Trademax Global Markets (International) Pty Ltd, trading as TMGM, is authorized and regulated by the Financial Services Commission, Mauritius (FSC) with license no. GB22201012, and registered at 33, Edith Cavell Street C/o IQ EQ Fund Services (Mauritius) Ltd Port Louis, 11324 Mauritius.
Email: support@tmgm.com
Copyright © TMGM. All rights reserved