

Trading
Explore a wide range of markets with competitive pricing, deep liquidity, and advanced trading tools.
Learn More 
Platform
Trade seamlessly with TMGM's powerful platform, built for speed, precision, and a superior trading experience.
Learn More Trading Platform
Academy
Learn the fundamentals of trading with beginner-friendly resources, including guides, webinars, and market insights.
Learn More News & Analysis
Get real-time market updates and expert analysis to stay ahead of trading opportunities
Learn More News & Analysis
About
Learn what sets TMGM apart — our global presence, regulatory strength, and commitment to innovation in trading.
Learn More Why Choose TMGM
Sponsorship
Pump.fun Price Forecast: Why Is PUMP Rising Despite Muted Retail Demand?
- Supported by the 200-day EMA, Pump.fun recovers towards $0.0036 on Wednesday.
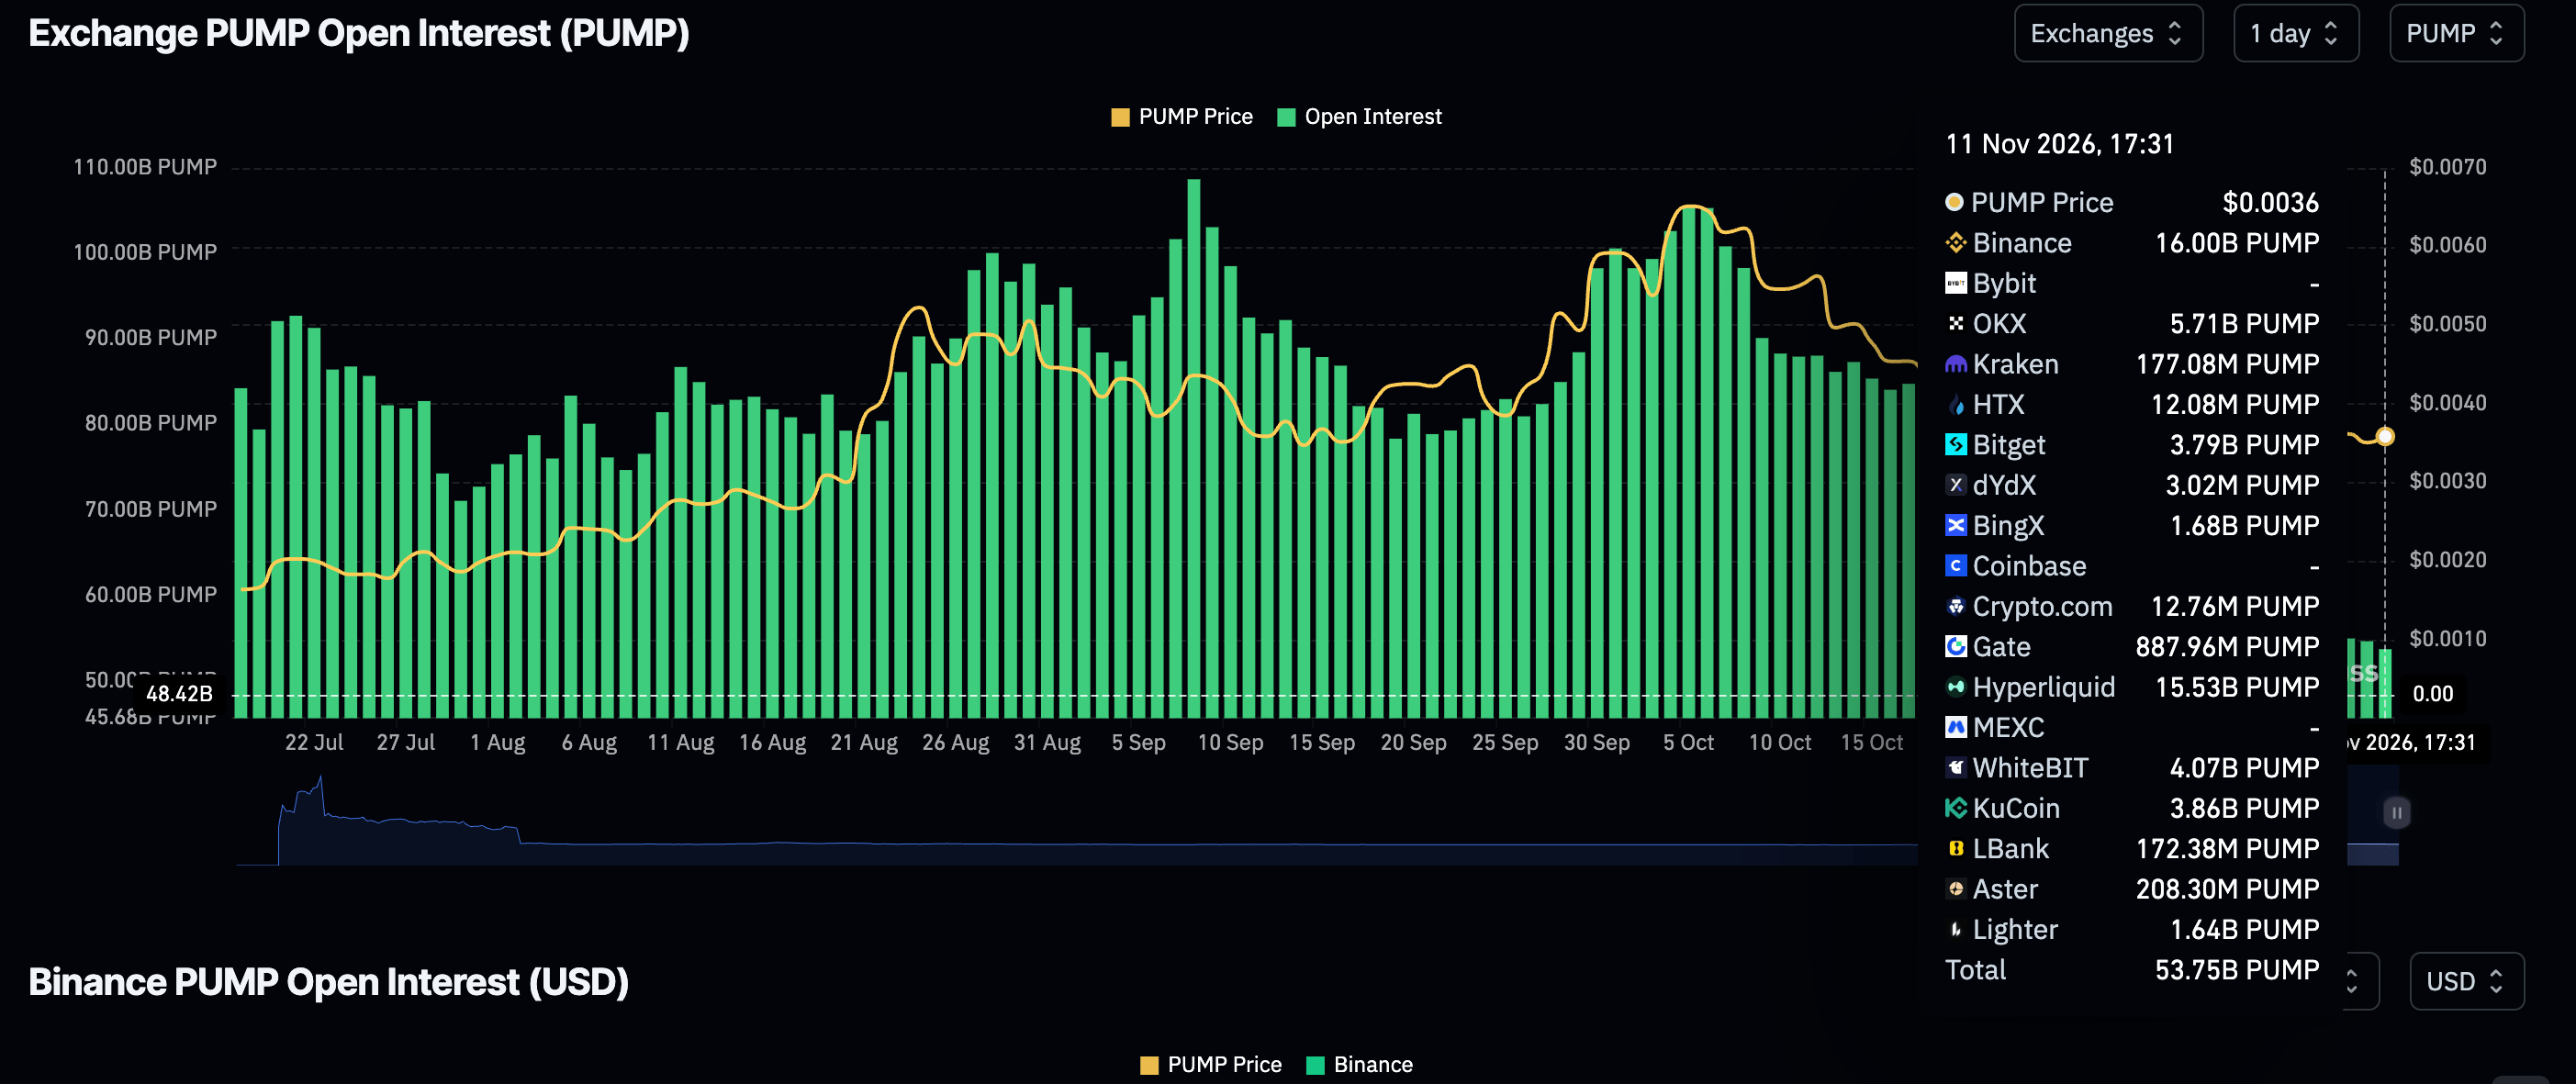
- Subdued retail demand weighs on Pump.fun as perpetual futures Open Interest stands at 54M PUMP, against 88M a month earlier.
- Despite its advance, PUMP remains largely range-bound, with short-term support at the 200-day EMA and resistance at the 100-day EMA.
Buying momentum returns to Pump.fun (PUMP) on Wednesday, lifting the token to $0.0036. After testing lows near $0.0035, the meme coin launchpad’s native token has gained over 2% for the day.
The wider technical outlook, however, continues to favour sellers. Key indicators, including the Moving Average Convergence Divergence (MACD), remain in negative territory. Breaking the bearish hold will require sustained price gains, particularly at the important psychological barriers of $0.0040 and $0.0050.
Can PUMP overcome subdued derivatives demand?
A pronounced bearish bias persists in Pump.fun’s derivatives market. On Wednesday, perpetual futures Open Interest (OI) falls to 54 million PUMP, marginally below the previous day’s 55 million. Measuring the notional value of futures contracts still open and unsettled, OI averaged 88 million on October 11; the decline is weighing on risk appetite.
Should more traders move to the sidelines and demand deteriorate further, the downside would remain the path of least resistance. PUMP would then be likely to extend its sell-off towards $0.0030.
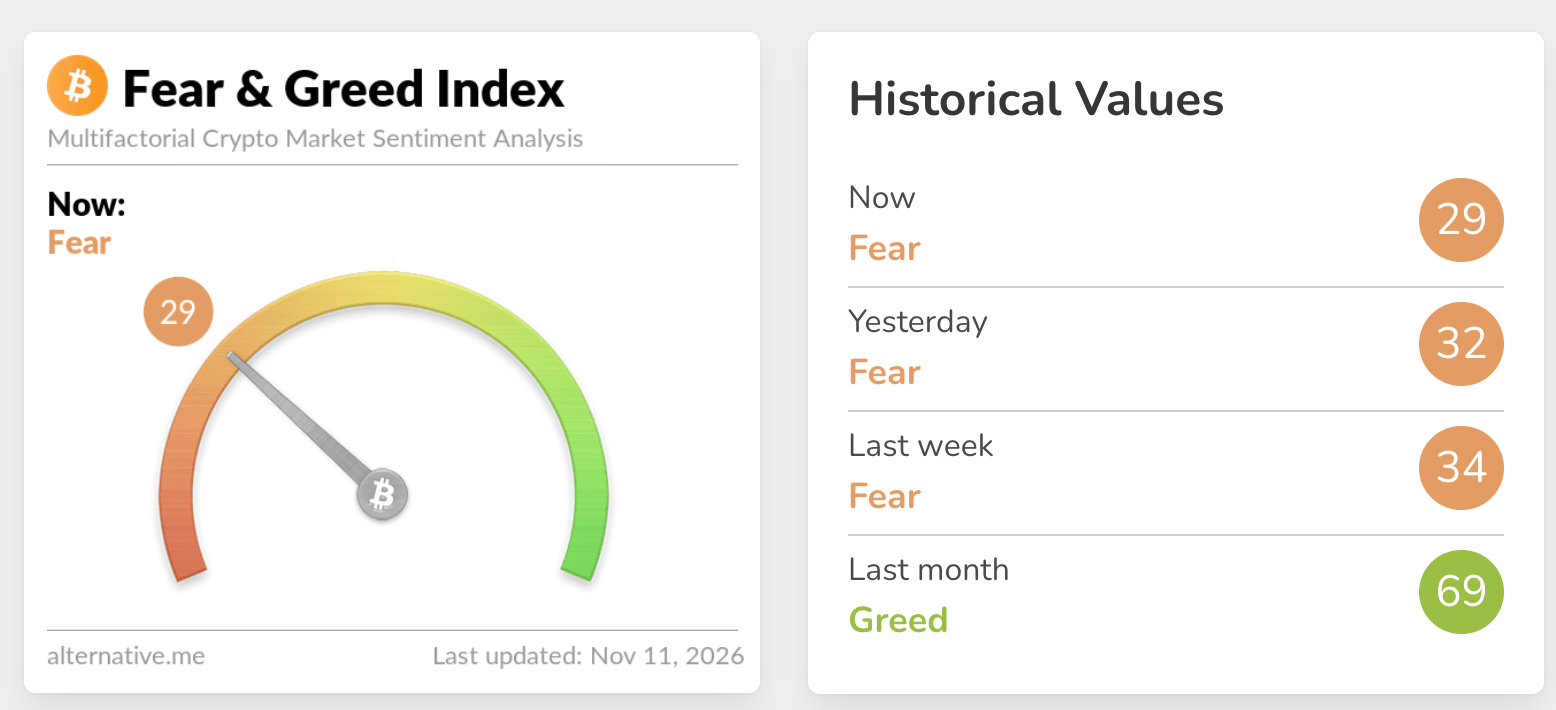
Demand weakness extends across the broader crypto market, not just Pump.fun. On Wednesday, the Fear & Greed Index registers 29, placing it in Fear territory and marginally below the previous day’s 32.
Against an average of 65 over the preceding month, the reading indicates that investors are currently reluctant to take risks. This is particularly evident following the Binance hack and ahead of the Federal Reserve (Fed) monetary policy meeting in December, at which a rate hike is widely anticipated.
Technical analysis: Can PUMP sustain its recovery above 200-day EMA support?
The near-term outlook for Pump.fun remains bearish at its trading price of $0.0036, as it sits below the 50-day and 100-day Exponential Moving Averages (EMAs) as well as the active SuperTrend line. With the price only slightly above the 200-day EMA at $0.0034, a broader base may be taking shape. Nevertheless, sellers retain control below a clearly defined descending resistance trendline.
At nearly 38, the Relative Strength Index (RSI) signals muted demand rather than outright oversold conditions. Meanwhile, the Moving Average Convergence Divergence (MACD) stays close to the zero line, suggesting subdued momentum within a market structure constrained by resistance.
For buyers seeking a rebound, the first resistance lies near $0.0040, where the earlier trendline break occurred. The 50-day EMA at $0.0043 provides a further ceiling. A move beyond these levels would bring the SuperTrend barrier at $0.0047 into focus, followed by the broader descending trendline zone towards $0.0071.
The first significant downside support sits at $0.0034, marked by the 200-day EMA. Closing below it on a daily basis would leave the pair vulnerable to additional losses, prolonging the prevailing bearish phase.
(The technical analysis of this story was written with the help of an AI tool. Know more.)
Bitcoin, altcoins and stablecoins: common questions
Ranked as the largest cryptocurrency by market capitalisation, Bitcoin is a virtual currency created to function as money. No single individual, group or entity can control this payment method, removing the need for a third party to participate in financial transactions.
Altcoins comprise all cryptocurrencies other than Bitcoin. Some, however, also exclude Ethereum from this category, since these two cryptocurrencies are the sources from which forks originate. Under that interpretation, Litecoin would be the first altcoin: it was forked from the Bitcoin protocol and is therefore an “improved” version of it.
Designed to maintain a stable price, stablecoins are cryptocurrencies backed by reserves of the assets they represent. Each stablecoin achieves this by pegging its value to a commodity or financial instrument, such as the US Dollar (USD), while an algorithm or demand regulates its supply. Their primary purpose is to offer an entry and exit route for investors looking to trade and invest in cryptocurrencies. They also enable investors to preserve value, as cryptocurrencies are generally subject to volatility.
By comparing Bitcoin’s market capitalisation with the combined market capitalisation of all cryptocurrencies, Bitcoin dominance offers a clear view of investor interest in Bitcoin. BTC dominance is typically high ahead of and during a bull run, when investors favour a relatively stable cryptocurrency with a large market capitalisation, such as Bitcoin. Conversely, a decline in BTC dominance generally signals that investors are shifting capital and/or profits into altcoins in pursuit of higher returns. This usually sparks a surge in altcoin rallies.
POPULAR ARTICLES
1Why is the New Zealand Dollar losing ground as Fed hawks reassert control?2Pump.fun Price Forecast: Why Is PUMP Rising Despite Muted Retail Demand?3Why is silver climbing above $52 despite rising US yields and Fed rate-hike bets?4Why has the British Pound tumbled below 1.33 following hot US CPI and hawkish Fed rhetoric?5Why is the Australian Dollar slipping towards March lows as Fed and RBA outlooks diverge?6USD/JPY climbs above 159.00 as Japanese Yen sinks to ten-week low7US Dollar: Deficit Concerns Counterbalanced by Supportive Fundamentals – Rabobank8Expectations of aggressive Fed rate hikes push euro to two-week low9Will UK inflation rise in October as Deutsche Bank expects?


Get Started!
Sign up and access the Global Markets in less than 3 minutes

Connect With Us












The information provided on this website is of a general nature only and does not constitute personal financial advice. Before acting on any information on this website, you should consider the suitability of the information in relation to your objectives, financial situation and needs. Investing in CFDs and FX Margin Contracts carries significant risks and is not suitable for all investors. You may lose more than your initial deposit. You do not own, or have, any interest in the underlying asset. We recommend that you seek independent advice and ensure you fully understand the risks involved before trading. It is important that you read and consider the disclosure document before you acquire any product listed on the website. The information and advertisements offered on this website are not intended for use by any person in any country or jurisdiction where such use would be contrary to local laws and regulations. The Products and Services offered on this website are not intended for residents of the United States, Malaysia and Thailand.
TMGM is authorized and regulated in various jurisdictions.
Trademax Australia Limited, trading as TMGM, is regulated by the Australian Securities and Investments Commission (ASIC), AFSL no. 436416 and is located at Level 28, One International Tower, 100 Barangaroo Avenue, 2000 Sydney, NSW Australia.
Email: support@tmgm.com.au
Trademax Global Limited, trading as TMGM, is authorized and regulated by the Vanuatu Financial Services Commission (VFSC), registration number 40356 and registered at 1276, Kumul Highway, Port Vila, Vanuatu, Republic of Vanuatu.
Email: support@tmgm.com
Trademax Global Markets (SE) Limited, trading as TMGM, is authorized and regulated by the Financial Services Authority (FSA) of Seychelles, with license number SD224. The company is registered at Office No 13, Providence Estate ABIS Centre, Mahe, Seychelles.
Email: support@tmgm.com
Trademax Global Markets (International) Pty Ltd, trading as TMGM, is authorized and regulated by the Financial Services Commission, Mauritius (FSC) with license no. GB22201012, and registered at 33, Edith Cavell Street C/o IQ EQ Fund Services (Mauritius) Ltd Port Louis, 11324 Mauritius.
Email: support@tmgm.com
Copyright © TMGM. All rights reserved