

Trading
Explore a wide range of markets with competitive pricing, deep liquidity, and advanced trading tools.
Learn More 
Platform
Trade seamlessly with TMGM's powerful platform, built for speed, precision, and a superior trading experience.
Learn More Trading Platform
Academy
Learn the fundamentals of trading with beginner-friendly resources, including guides, webinars, and market insights.
Learn More News & Analysis
Get real-time market updates and expert analysis to stay ahead of trading opportunities
Learn More News & Analysis
About
Learn what sets TMGM apart — our global presence, regulatory strength, and commitment to innovation in trading.
Learn More Why Choose TMGM
Sponsorship
BTC decline accelerates, XAU recoups some losses as US PPI rises: Bitcoin vs Gold Outlook
- $70,000 remains difficult for BTC to regain on Friday as Bitcoin sellers tighten their control.
- Above $3,900, Gold edges higher following three consecutive daily falls, although key technical indicators could constrain its recovery.
- 6.5% YoY headline producer inflation marks the highest annual reading since November 2022, with US PPI also showing a 0.3% rise in October.
Bitcoin (BTC) hovers near $69,000. Friday’s selling pressure mirrors subdued sentiment across the wider cryptocurrency market. Bulls are struggling to restore calm following a sharp correction in the Crypto King, driven largely by a shift away from risk after the resignation of Jensen Huang, Nvidia Co-founder and CEO.

Following a three-day retreat to lows near $3,852, Gold (XAU/USD) is trading just above $3,900. The metal is trimming its losses and may gather recovery momentum towards the crucial $4,000 mark.
0.3% October rise in US PPI
A 0.3% seasonally adjusted increase in October US producer inflation was reported by the Bureau of Labor Statistics (BLS) on Friday. Measured by the change in the Producer Price Index (PPI), the reading followed September’s final increase of 1.4%, revised from 1.3%.
At 6.5% in October, annual producer inflation accelerated from September’s 6.3% to its highest rate since November 2022. The result was nevertheless below the market forecast of 6.6%.
Excluding volatile food and energy prices, PPI increased by 0.3% month on month and 5% year on year. Both readings were in line with analysts’ forecasts.
Following the PPI release, Gold is maintaining its gradual advance, whereas Bitcoin is finding it difficult to build momentum above $69,000. A move back above $4,000 for Gold and a potential recovery beyond $70,000 for Bitcoin could improve both assets’ short-term recovery prospects.
Demand for digital assets remains markedly weak, however. On Friday, the Fear & Greed Index stands at 20, within Extreme Fear territory, compared with 28 in the Fear category a day earlier.
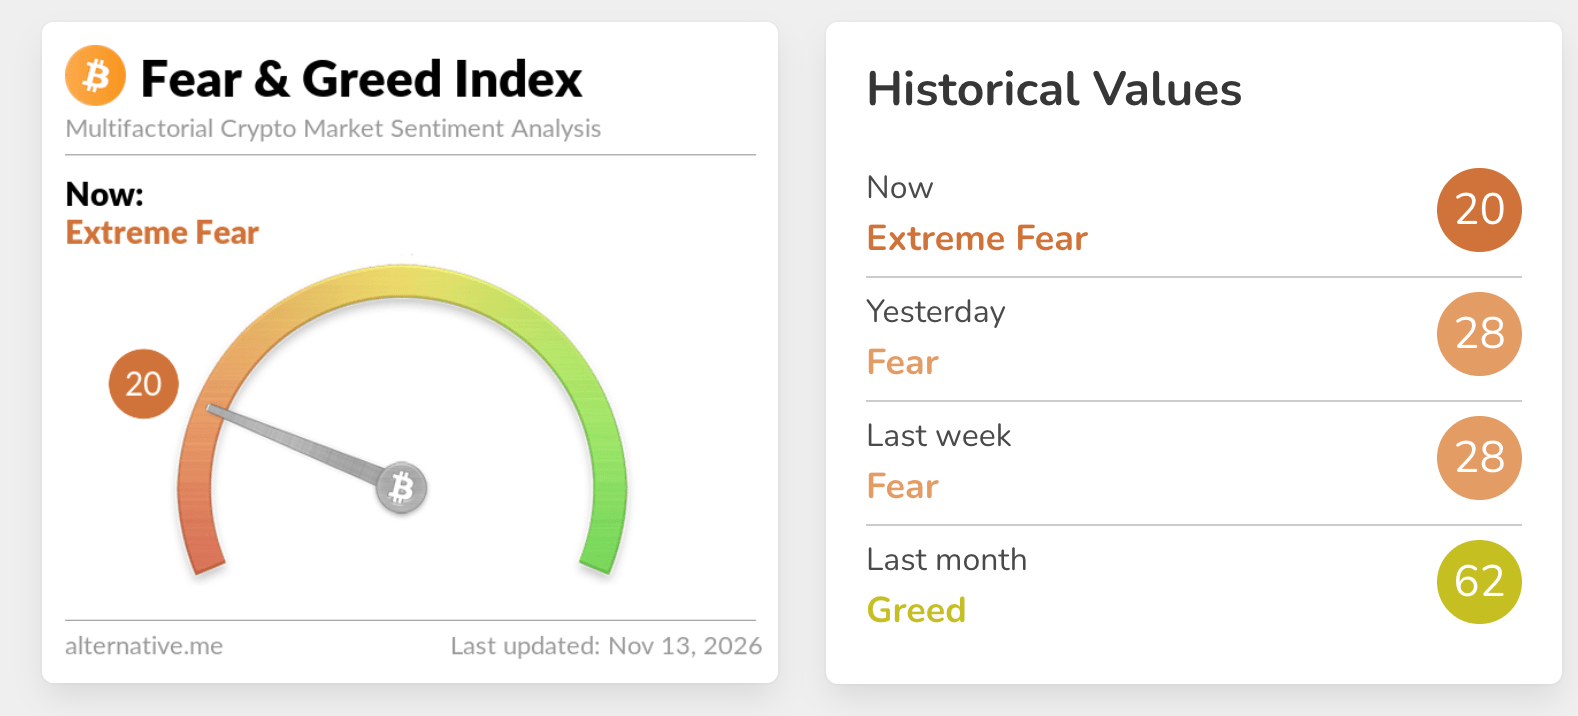
Investors appear to be stepping back and adjusting their portfolios before the Federal Reserve (Fed) meeting in December. Following October’s hold, market participants widely anticipate that the Fed will raise interest rates into the 4.00-4.25% range. That prospect could keep sentiment under pressure.
$69,232 Bitcoin: Technical floor remains elusive
At $69,232, Bitcoin remains in a bearish phase, trading substantially below every key Exponential Moving Average and the SuperTrend line. Overhead, the 50-day EMA stands at $78,245, the 100-day EMA at $77,208 and the 200-day EMA at $76,6417. This positioning points to continued downward pressure on the broader trend. The SuperTrend reading of $77,026 adds to the constraints on upside.
Sellers retain control, according to weak momentum signals. The Moving Average Convergence Divergence (MACD) is below zero, while the Relative Strength Index (RSI) is close to 26, within oversold territory.
The first resistance point is the 200-day EMA around $76,641. Above it sit the SuperTrend at $77,026 and the 100-day EMA at $77,208, followed by the higher resistance threshold of the 50-day EMA at $78,245. Only a daily close above this moving-average cluster would ease the prevailing bearish bias and allow a more constructive outlook.
No nearby support levels are mapped on the chart. Until fresh demand materialises, that leaves the price vulnerable to additional losses.
$4,000 in focus for Gold: Technical recovery faces resistance
At $3,905, Gold is attempting to recover as bulls seek to reassert control. The modest rebound has not removed the near-term bearish bias: prices remain below the 50-day EMA at $4,123, the 100-day EMA at $4,211 and the 200-day EMA at $4,246. Persistent overhead supply is also indicated by the SuperTrend line at $4,163. Momentum signals remain fragile, with the MACD under zero and the RSI close to 40. Together, they suggest weak downward pressure, but not yet oversold conditions.
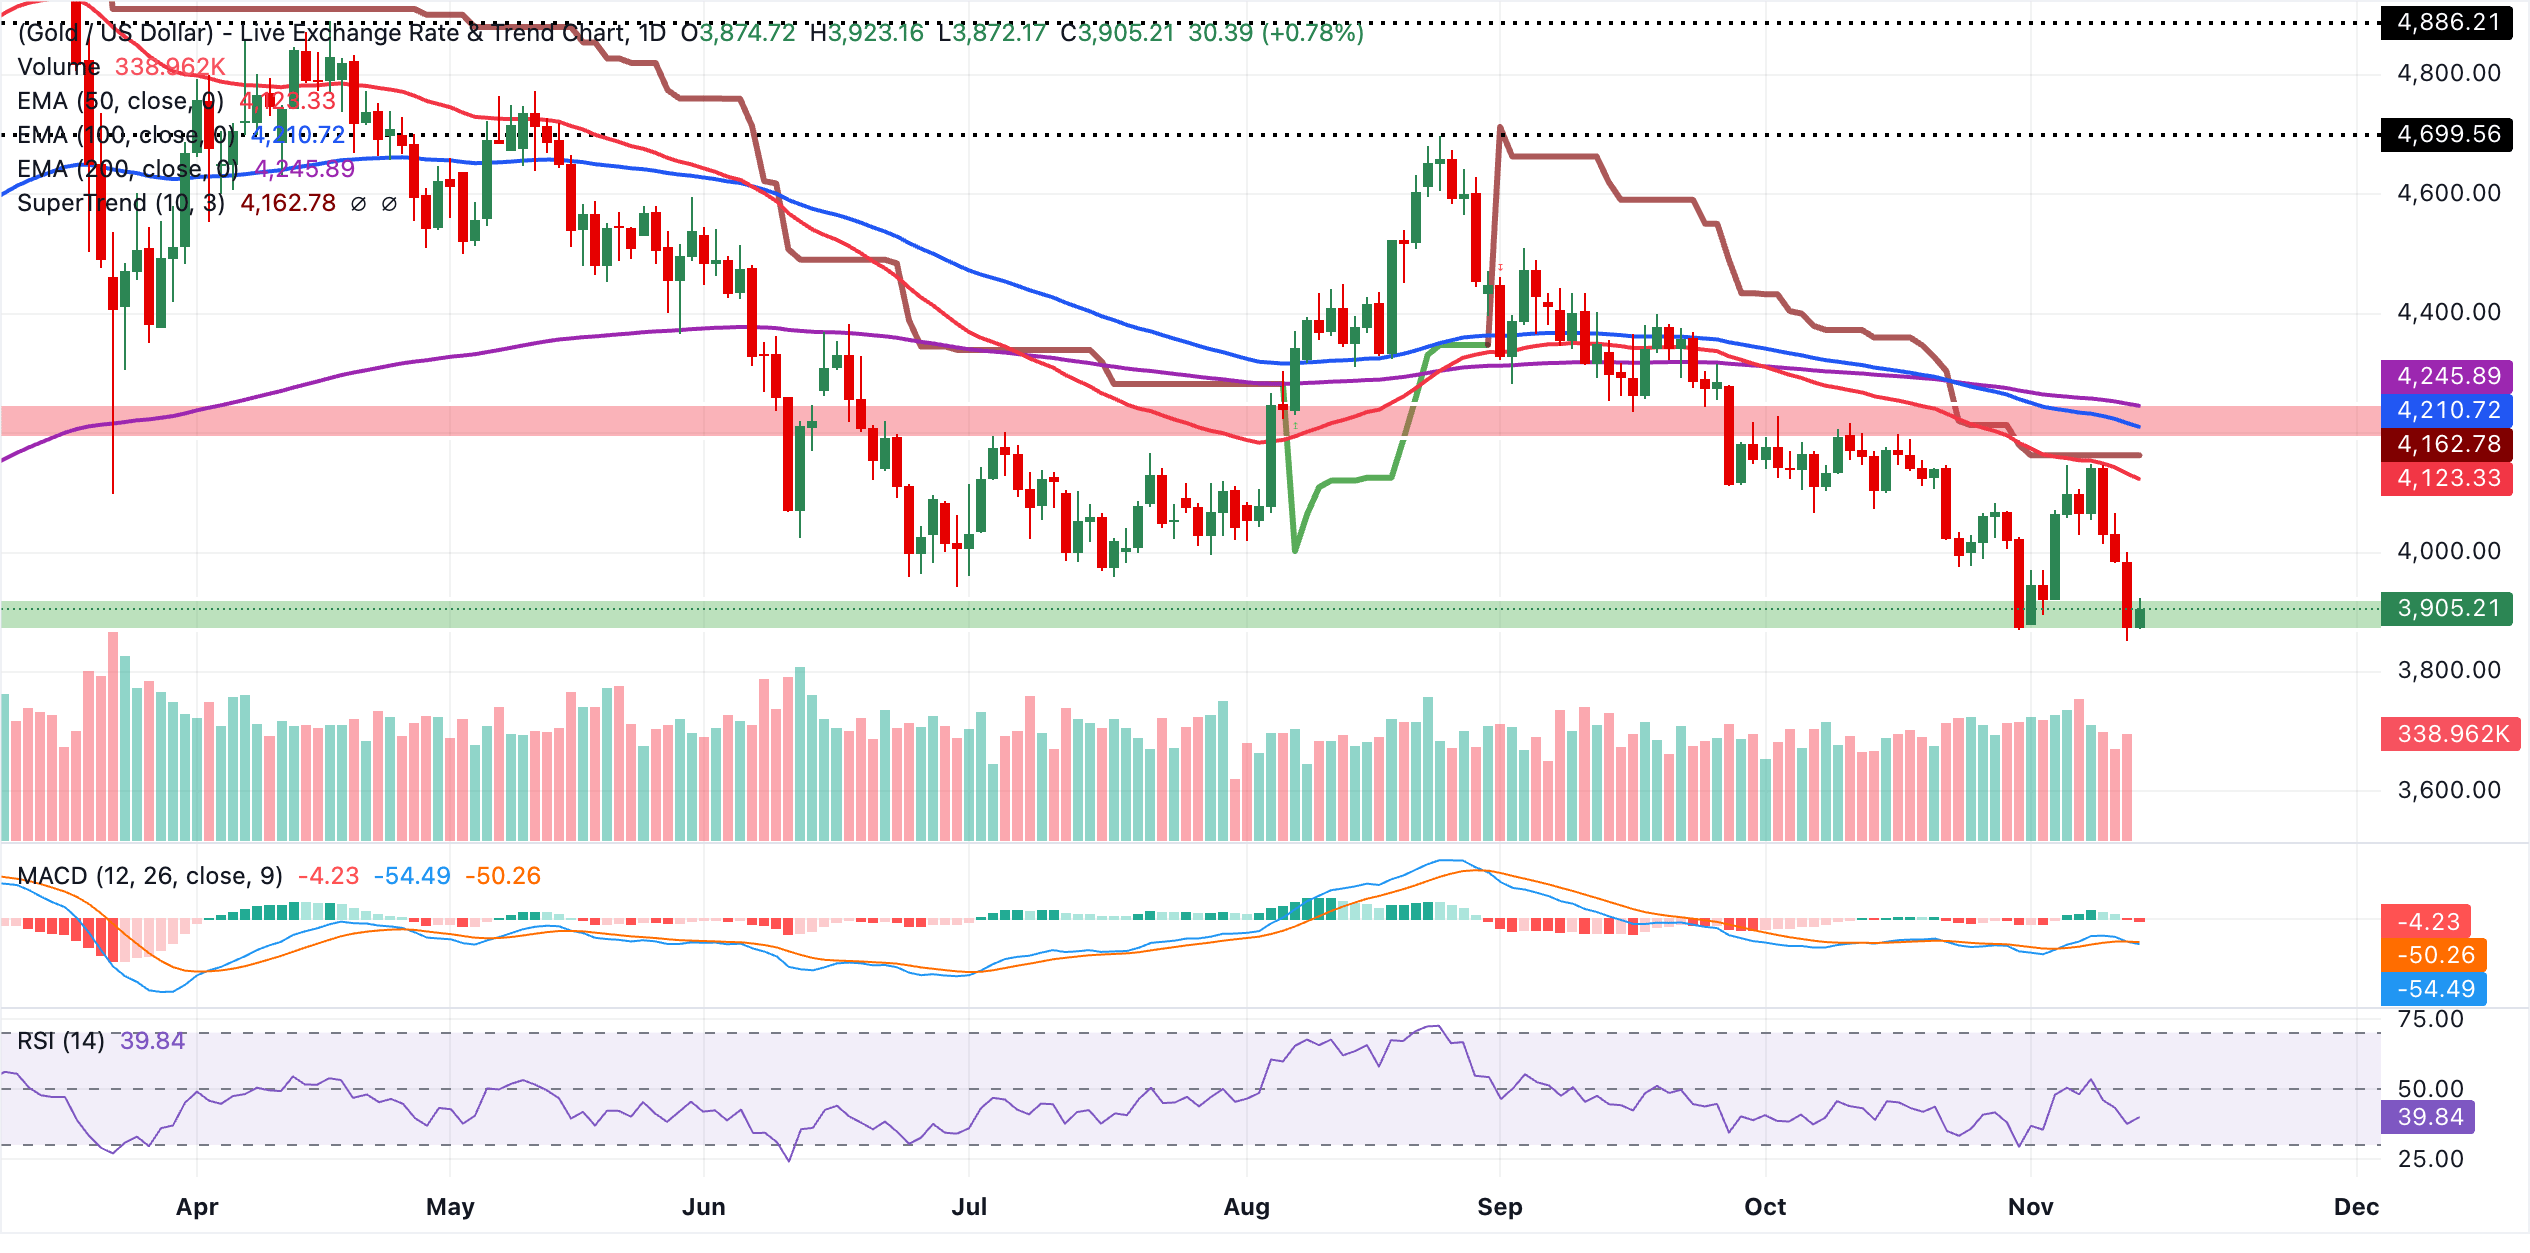
The 50-day EMA at $4,123 provides the first resistance test, followed by a firmer obstacle at the SuperTrend level around $4,163. Beyond those levels, the 100-day EMA at $4,211 and the 200-day EMA at $4,246 limit the scope of a broader rebound. As long as XAU/USD stays firmly below this resistance cluster, the bearish bias is likely to endure.
(An AI tool assisted in preparing this story’s technical analysis. Learn more.)
Bitcoin, altcoins and stablecoins: Frequently asked questions
Ranked by market capitalisation, Bitcoin is the largest cryptocurrency. It is a virtual currency created to function as money. No single person, group or entity can control this payment method, removing the need for a third party to participate in financial transactions.
Any cryptocurrency other than Bitcoin is classified as an altcoin. Some also exclude Ethereum, however, on the grounds that forks originate from these two cryptocurrencies. Under that definition, Litecoin would be the first altcoin: it was forked from the Bitcoin protocol and is therefore an “improved” version of it.
A stablecoin is a cryptocurrency intended to maintain a stable price, backed by reserves of the asset it represents. Its value is pegged to a commodity or financial instrument, such as the US Dollar (USD), while an algorithm or demand regulates its supply. Stablecoins primarily give investors a way to enter and exit cryptocurrency trading and investment. They also offer a store of value, as cryptocurrencies are generally subject to price volatility.
By comparing Bitcoin’s market capitalisation with the combined market capitalisation of all cryptocurrencies, Bitcoin dominance offers a clear gauge of investor interest in Bitcoin. BTC dominance is typically high before and during a bull run, when investors turn to relatively stable, large-cap cryptocurrencies such as Bitcoin. Falling BTC dominance generally signals that investors are shifting capital and/or profits into altcoins in pursuit of stronger returns. Such moves usually spark sharp rallies across altcoins.
POPULAR ARTICLES
1Firmer Oil supports Canadian Dollar as inflation data comes into focus2BTC decline accelerates, XAU recoups some losses as US PPI rises: Bitcoin vs Gold Outlook3Softer US PPI brings little respite for euro under pressure4Broadening inflation: Fed’s Goolsbee warns of more aggressive rate hikes5Below $68,000: Bitcoin Weekly Forecast as BTC selling persists despite oversold signal66.5%: United States annual producer inflation rises in October, below 6.6% forecast7Mixed Eurozone data: Euro pares gains against British Pound8December rate hike expected from Bank of Japan: Why is the Japanese Yen still weakening?90.5527 in focus: NZD/USD price forecast as bears build momentum to test 19-month lows

Get Started!
Sign up and access the Global Markets in less than 3 minutes

Connect With Us












The information provided on this website is of a general nature only and does not constitute personal financial advice. Before acting on any information on this website, you should consider the suitability of the information in relation to your objectives, financial situation and needs. Investing in CFDs and FX Margin Contracts carries significant risks and is not suitable for all investors. You may lose more than your initial deposit. You do not own, or have, any interest in the underlying asset. We recommend that you seek independent advice and ensure you fully understand the risks involved before trading. It is important that you read and consider the disclosure document before you acquire any product listed on the website. The information and advertisements offered on this website are not intended for use by any person in any country or jurisdiction where such use would be contrary to local laws and regulations. The Products and Services offered on this website are not intended for residents of the United States, Malaysia and Thailand.
TMGM is authorized and regulated in various jurisdictions.
Trademax Australia Limited, trading as TMGM, is regulated by the Australian Securities and Investments Commission (ASIC), AFSL no. 436416 and is located at Level 28, One International Tower, 100 Barangaroo Avenue, 2000 Sydney, NSW Australia.
Email: support@tmgm.com.au
Trademax Global Limited, trading as TMGM, is authorized and regulated by the Vanuatu Financial Services Commission (VFSC), registration number 40356 and registered at 1276, Kumul Highway, Port Vila, Vanuatu, Republic of Vanuatu.
Email: support@tmgm.com
Trademax Global Markets (SE) Limited, trading as TMGM, is authorized and regulated by the Financial Services Authority (FSA) of Seychelles, with license number SD224. The company is registered at Office No 13, Providence Estate ABIS Centre, Mahe, Seychelles.
Email: support@tmgm.com
Trademax Global Markets (International) Pty Ltd, trading as TMGM, is authorized and regulated by the Financial Services Commission, Mauritius (FSC) with license no. GB22201012, and registered at 33, Edith Cavell Street C/o IQ EQ Fund Services (Mauritius) Ltd Port Louis, 11324 Mauritius.
Email: support@tmgm.com
Copyright © TMGM. All rights reserved