

Trading
Explore a wide range of markets with competitive pricing, deep liquidity, and advanced trading tools.
Learn More 
Platform
Trade seamlessly with TMGM's powerful platform, built for speed, precision, and a superior trading experience.
Learn More Trading Platform
Academy
Learn the fundamentals of trading with beginner-friendly resources, including guides, webinars, and market insights.
Learn More News & Analysis
Get real-time market updates and expert analysis to stay ahead of trading opportunities
Learn More News & Analysis
About
Learn what sets TMGM apart — our global presence, regulatory strength, and commitment to innovation in trading.
Learn More Why Choose TMGM
Sponsorship
Bitcoin Price Forecast: Can BTC withstand pressure as MSCI removes Strategy from global indices, putting billions in fund flows at risk?
- Selling pressure keeps Bitcoin below $73,800 on Thursday, with losses so far this week extending beyond 1.5%.
- Strategy faces removal from global indices following an announcement by index provider MSCI on Wednesday.
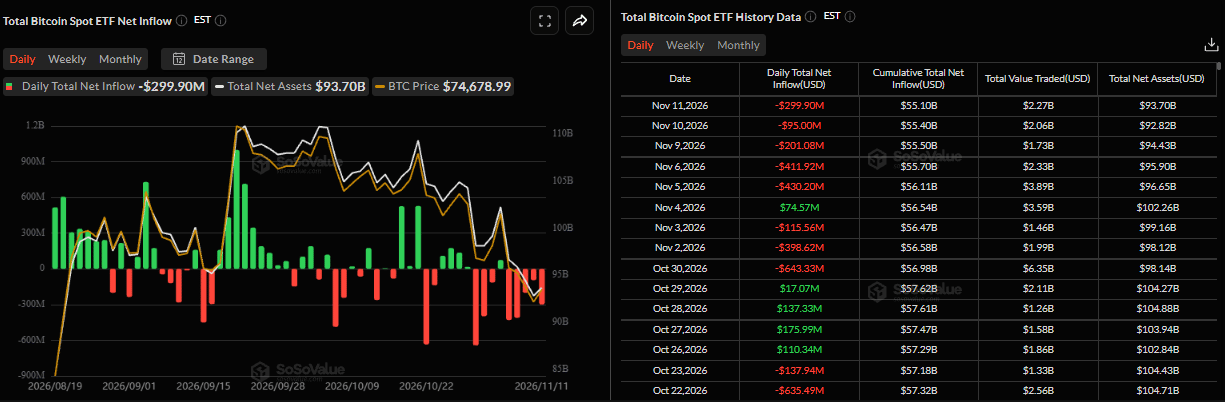
- Withdrawals from US-listed BTC spot ETFs reached $299.90 million on Wednesday, extending the outflow streak to a fifth consecutive day.
Bearish sentiment continues to weigh on Bitcoin (BTC), which trades below $73,800 on Thursday following a correction of over 1.5% so far this week. Wednesday’s announcement by global index provider MSCI that it will remove Strategy (MSTR) and other BTC-holding companies from global indices deepened the negative mood, placing billions in fund flows at risk. Weakening institutional demand this week has also constrained the Crypto King’s recovery: spot Exchange Traded Funds (ETFs) saw nearly $300 million withdrawn on Wednesday, their fifth consecutive day of outflows.

Could Strategy’s Removal Trigger Billions in Outflows?
Strategy faces exclusion from MSCI’s global indices after the global index provider announced its decision on Wednesday. With 850,364 BTC currently on its books, Strategy is the largest corporate holder of Bitcoin.
To align their portfolios with the changes, index funds following the affected benchmarks may have to sell their Strategy shares by November 30. MSCI’s move directly concerns Strategy’s shares, not its Bitcoin holdings. Nevertheless, the cryptocurrency could also feel the effects, given Strategy’s status as the largest Bitcoin treasury.
The exclusion list also names Tokyo-listed Metaplanet, another company that accumulates and holds Bitcoin, alongside UK-based uranium investment company Yellow Cake. Effective December 1, the companies will exit the MSCI USA and MSCI World indices.
Potential forced selling of shares could pressure the stocks of these BTC-holding companies and, indirectly, sentiment towards BTC. These businesses provide institutions with a route to Bitcoin exposure. Prolonged selling of their shares could therefore weaken investor confidence in corporate Bitcoin treasury strategies, creating an additional obstacle to BTC’s recovery.
Is Institutional Demand Losing Further Ground?
Demand for Bitcoin from institutions has weakened further so far this week. According to SoSoValue data, net withdrawals from BTC spot ETFs totalled $299.90 million on Wednesday, extending a run of outflows that began last week to five consecutive days. Should withdrawals persist and gather pace through this week, BTC could come under further pressure and enter a deeper price correction.
Can the Nasdaq’s Recovery Shape Bitcoin’s Next Move?
A marked divergence has emerged between Bitcoin and the Nasdaq so far this week, with BTC continuing to lag the other risk-sensitive asset. Against Monday’s 3.55% rally in the Nasdaq, Bitcoin managed a gain of only 0.69%. Wednesday brought a similar contrast: the technology-heavy index climbed nearly 2%, while BTC advanced a modest 0.30%.
A K33 report found that, across all five observed instances, Bitcoin’s performance over the subsequent 20-day period moved in the same direction as the Nasdaq. In a wider sample covering 16 strong Nasdaq rebounds after market corrections, BTC rose in eight of the nine instances in which the Nasdaq extended its gains (Figure 15), delivering a median return of 2.9%. By contrast, all seven instances in which the Nasdaq’s rebound faltered saw Bitcoin fall (Figure 16), with a median loss of 21%. Whether the Nasdaq can maintain its recovery thus appears crucial to Bitcoin’s near-term prospects.
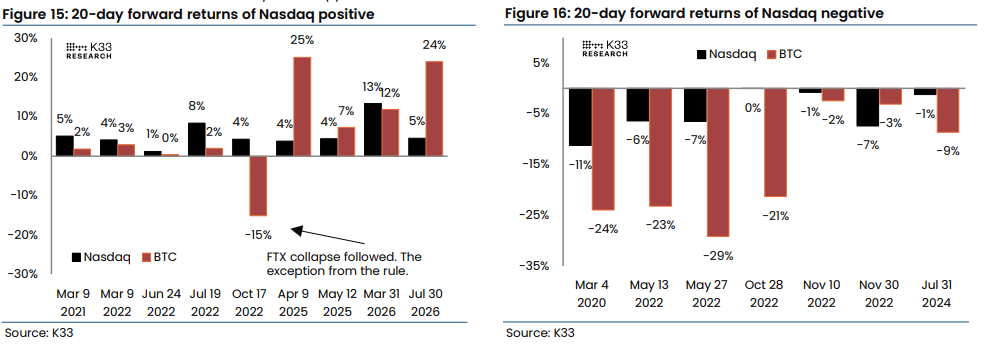
While Bitcoin has lost 1.5% so far this week, the technology-heavy index has recouped nearly all of last week’s losses. The gap underlines BTC’s relative weakness even as appetite for risk improves in equities. Historical observations suggest that, should the Nasdaq’s recovery falter, Bitcoin could suffer substantially larger losses than the technology index.
A lasting equity rebound, on the other hand, could lend Bitcoin support. Even so, BTC’s recent underperformance indicates that better risk appetite may not immediately produce a stronger recovery in the cryptocurrency.
Bitcoin Technical Outlook: Can Bulls Challenge Bearish Control?
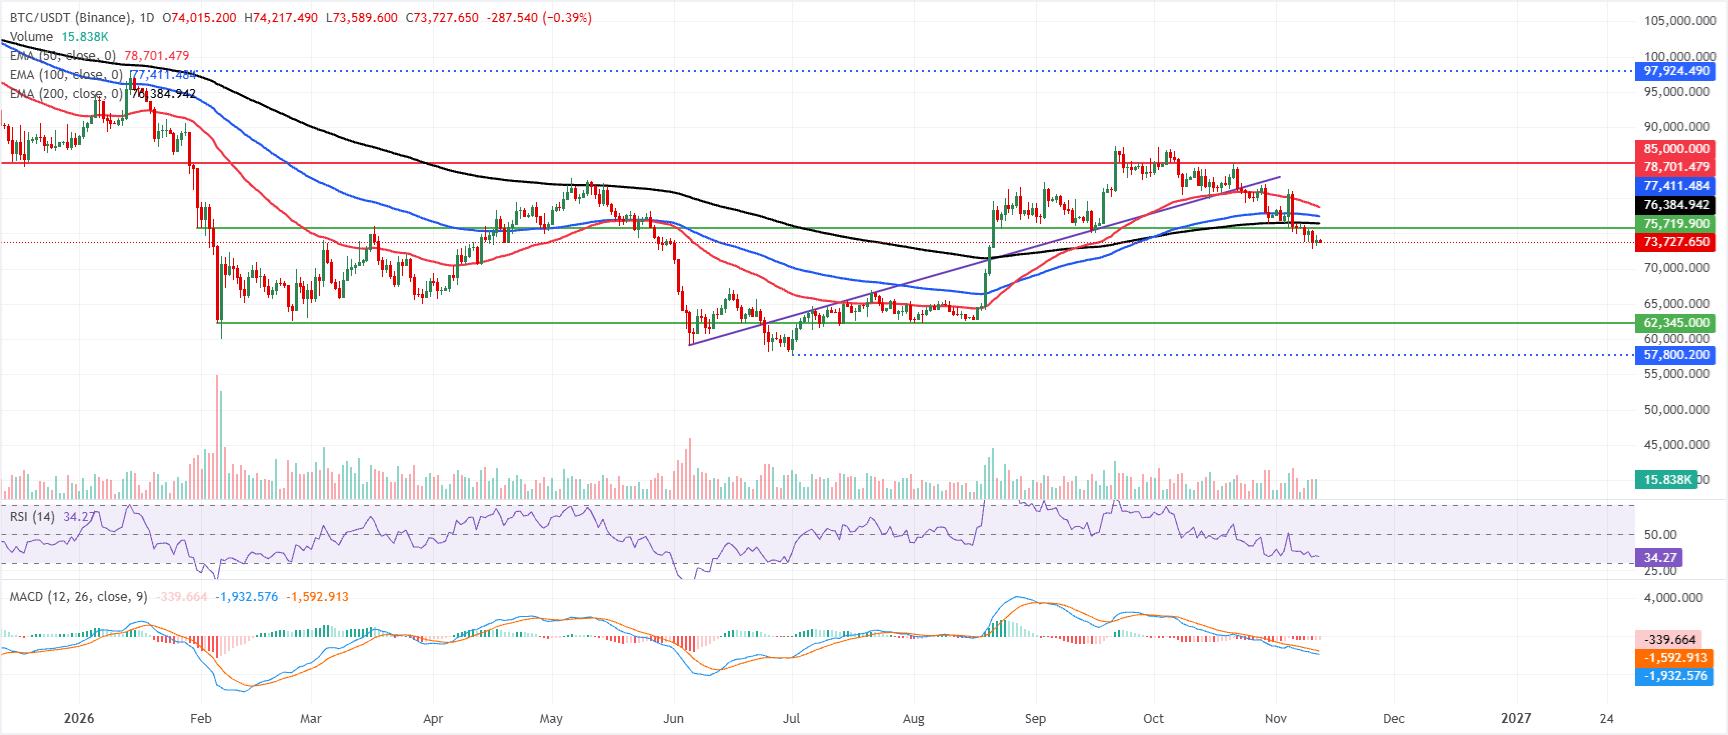
Trading at $73,727 on Thursday, Bitcoin retains a bearish near-term outlook below its key Exponential Moving Averages. Above the price sit the 200-day EMA at $76,384, the 100-day EMA at $77,411 and the 50-day EMA at $78,701. Their positioning suggests that the recent rebound is still constrained within a broader corrective phase.
Momentum indicators also favour sellers despite occasional bounces. The Relative Strength Index (RSI) is hovering near 34, while the Moving Average Convergence Divergence (MACD) indicator remains in negative territory, reinforcing the bearish picture.
For any upside move, the first resistance is the 200-day EMA around $76,384. Beyond that lie the 100-day EMA near $77,411 and the 50-day EMA at about $78,701. Together, these levels present a closely packed barrier that bulls would have to reclaim to reduce downside pressure. Further ahead, horizontal resistance at $85,000 poses a more significant challenge, as supply seen previously could re-emerge there.
With no nearby support mapped on the downside, a break below current levels would point BTC towards the psychological support zone around $70,000 before the price stabilises.
(The technical analysis of this story was written with the help of an AI tool. Know more.)
FAQs on Bitcoin, altcoins and stablecoins
Designed to function as money, Bitcoin is a virtual currency and the largest cryptocurrency by market capitalisation. No single person, group or entity can control this payment method, removing the need for third parties to participate in financial transactions.
Any cryptocurrency other than Bitcoin is considered an altcoin. Some, however, also exclude Ethereum from this category, since forking takes place from these two cryptocurrencies. Under that interpretation, Litecoin is the first altcoin: it was forked from the Bitcoin protocol and is therefore an “improved” version of it.
To keep their prices stable, stablecoins are designed with values backed by reserves of the assets they represent. Each stablecoin is pegged to a commodity or financial instrument, such as the US Dollar (USD), while an algorithm or demand regulates its supply. Their primary purpose is to give investors a way into and out of cryptocurrencies for trading and investment. Since cryptocurrencies are generally volatile, stablecoins also offer investors a means of storing value.
The ratio of Bitcoin’s market capitalisation to the combined market capitalisation of all cryptocurrencies is known as Bitcoin dominance. This measure offers a clear indication of investor interest in Bitcoin. BTC dominance is typically high before and during a bull run, when investors turn to relatively stable cryptocurrencies with large market capitalisations, such as Bitcoin. Falling BTC dominance usually signals that investors are shifting capital and/or profits into altcoins in pursuit of higher returns, a move that generally sparks a surge in altcoin rallies.
POPULAR ARTICLES
1US Dollar Index Price Forecast: Further gains towards 104.00 appear likely2USD/CAD Price Forecast: Positive bias holds above 100-day SMA as pair climbs beyond 1.42503Injective Price Forecast: Can long-term trendline support withstand intensifying selling pressure?4Can WTI Recover After Falling Below $85.00 Amid Ukraine Peace Talk Hopes and Oversupply Concerns?5Bitcoin Price Forecast: Can BTC withstand pressure as MSCI removes Strategy from global indices, putting billions in fund flows at risk?6With consumption lacking momentum, BoJ's Asada warns rate hikes could lower underlying inflation7Why is the Swiss Franc retaining gains against the US Dollar despite a hawkish Fed outlook?8USD/JPY Price Forecast: Consolidation Breakout Sets a Fresh Upside Leg in Motion9GBP/USD Price Forecast: Is the Pair Vulnerable Below 1.3300 Amid a Bullish USD Ahead of UK GDP?


Get Started!
Sign up and access the Global Markets in less than 3 minutes

Connect With Us












The information provided on this website is of a general nature only and does not constitute personal financial advice. Before acting on any information on this website, you should consider the suitability of the information in relation to your objectives, financial situation and needs. Investing in CFDs and FX Margin Contracts carries significant risks and is not suitable for all investors. You may lose more than your initial deposit. You do not own, or have, any interest in the underlying asset. We recommend that you seek independent advice and ensure you fully understand the risks involved before trading. It is important that you read and consider the disclosure document before you acquire any product listed on the website. The information and advertisements offered on this website are not intended for use by any person in any country or jurisdiction where such use would be contrary to local laws and regulations. The Products and Services offered on this website are not intended for residents of the United States, Malaysia and Thailand.
TMGM is authorized and regulated in various jurisdictions.
Trademax Australia Limited, trading as TMGM, is regulated by the Australian Securities and Investments Commission (ASIC), AFSL no. 436416 and is located at Level 28, One International Tower, 100 Barangaroo Avenue, 2000 Sydney, NSW Australia.
Email: support@tmgm.com.au
Trademax Global Limited, trading as TMGM, is authorized and regulated by the Vanuatu Financial Services Commission (VFSC), registration number 40356 and registered at 1276, Kumul Highway, Port Vila, Vanuatu, Republic of Vanuatu.
Email: support@tmgm.com
Trademax Global Markets (SE) Limited, trading as TMGM, is authorized and regulated by the Financial Services Authority (FSA) of Seychelles, with license number SD224. The company is registered at Office No 13, Providence Estate ABIS Centre, Mahe, Seychelles.
Email: support@tmgm.com
Trademax Global Markets (International) Pty Ltd, trading as TMGM, is authorized and regulated by the Financial Services Commission, Mauritius (FSC) with license no. GB22201012, and registered at 33, Edith Cavell Street C/o IQ EQ Fund Services (Mauritius) Ltd Port Louis, 11324 Mauritius.
Email: support@tmgm.com
Copyright © TMGM. All rights reserved