

Trading
Explore a wide range of markets with competitive pricing, deep liquidity, and advanced trading tools.
Learn More 
Platform
Trade seamlessly with TMGM's powerful platform, built for speed, precision, and a superior trading experience.
Learn More Trading Platform
Academy
Learn the fundamentals of trading with beginner-friendly resources, including guides, webinars, and market insights.
Learn More News & Analysis
Get real-time market updates and expert analysis to stay ahead of trading opportunities
Learn More News & Analysis
About
Learn what sets TMGM apart — our global presence, regulatory strength, and commitment to innovation in trading.
Learn More Why Choose TMGM
Sponsorship
Dogecoin Price Forecast: Can DOGE defend its three-year low as selling pressure intensifies?
- Selling pressure continues to weigh on Dogecoin, pushing the meme coin back to levels last recorded in October 2023.
- Despite a sustained fall in futures Open Interest, traders are increasingly choosing to retain their long positions.
- Sellers retain the near-term advantage as Dogecoin remains oversold, although a resurgence in buying could shift the balance in favour of the bulls.
Bears are strengthening their hold on Dogecoin (DOGE), which is trading lower near $0.0650 on Thursday. Downside remains the path of least resistance for the largest meme coin by market capitalisation, as well as for major cryptocurrencies Bitcoin (BTC), Ethereum (ETH) and Ripple (XRP).

A loss of about 2.6% on the day has brought DOGE back to levels last recorded in October 2023. Weak momentum indicators and falling moving averages reflect the sustained technical deterioration underpinning this bearish outlook.
Risk appetite across the wider crypto market has also suffered, with interest in crypto-related investment products taking a substantial hit recently as the $6.3 billion Binance hack weighs on prices. On Thursday, the crypto Fear and Greed Index stood at 28 in Fear territory, only marginally below the previous day's 29, further dampening appetite for risk.
Can a positive weighted funding rate ease pressure on Dogecoin derivatives?
A sharp deterioration in Dogecoin derivatives activity saw perpetual futures Open Interest (OI) average $888 million on Thursday, compared with $923 million a day earlier.
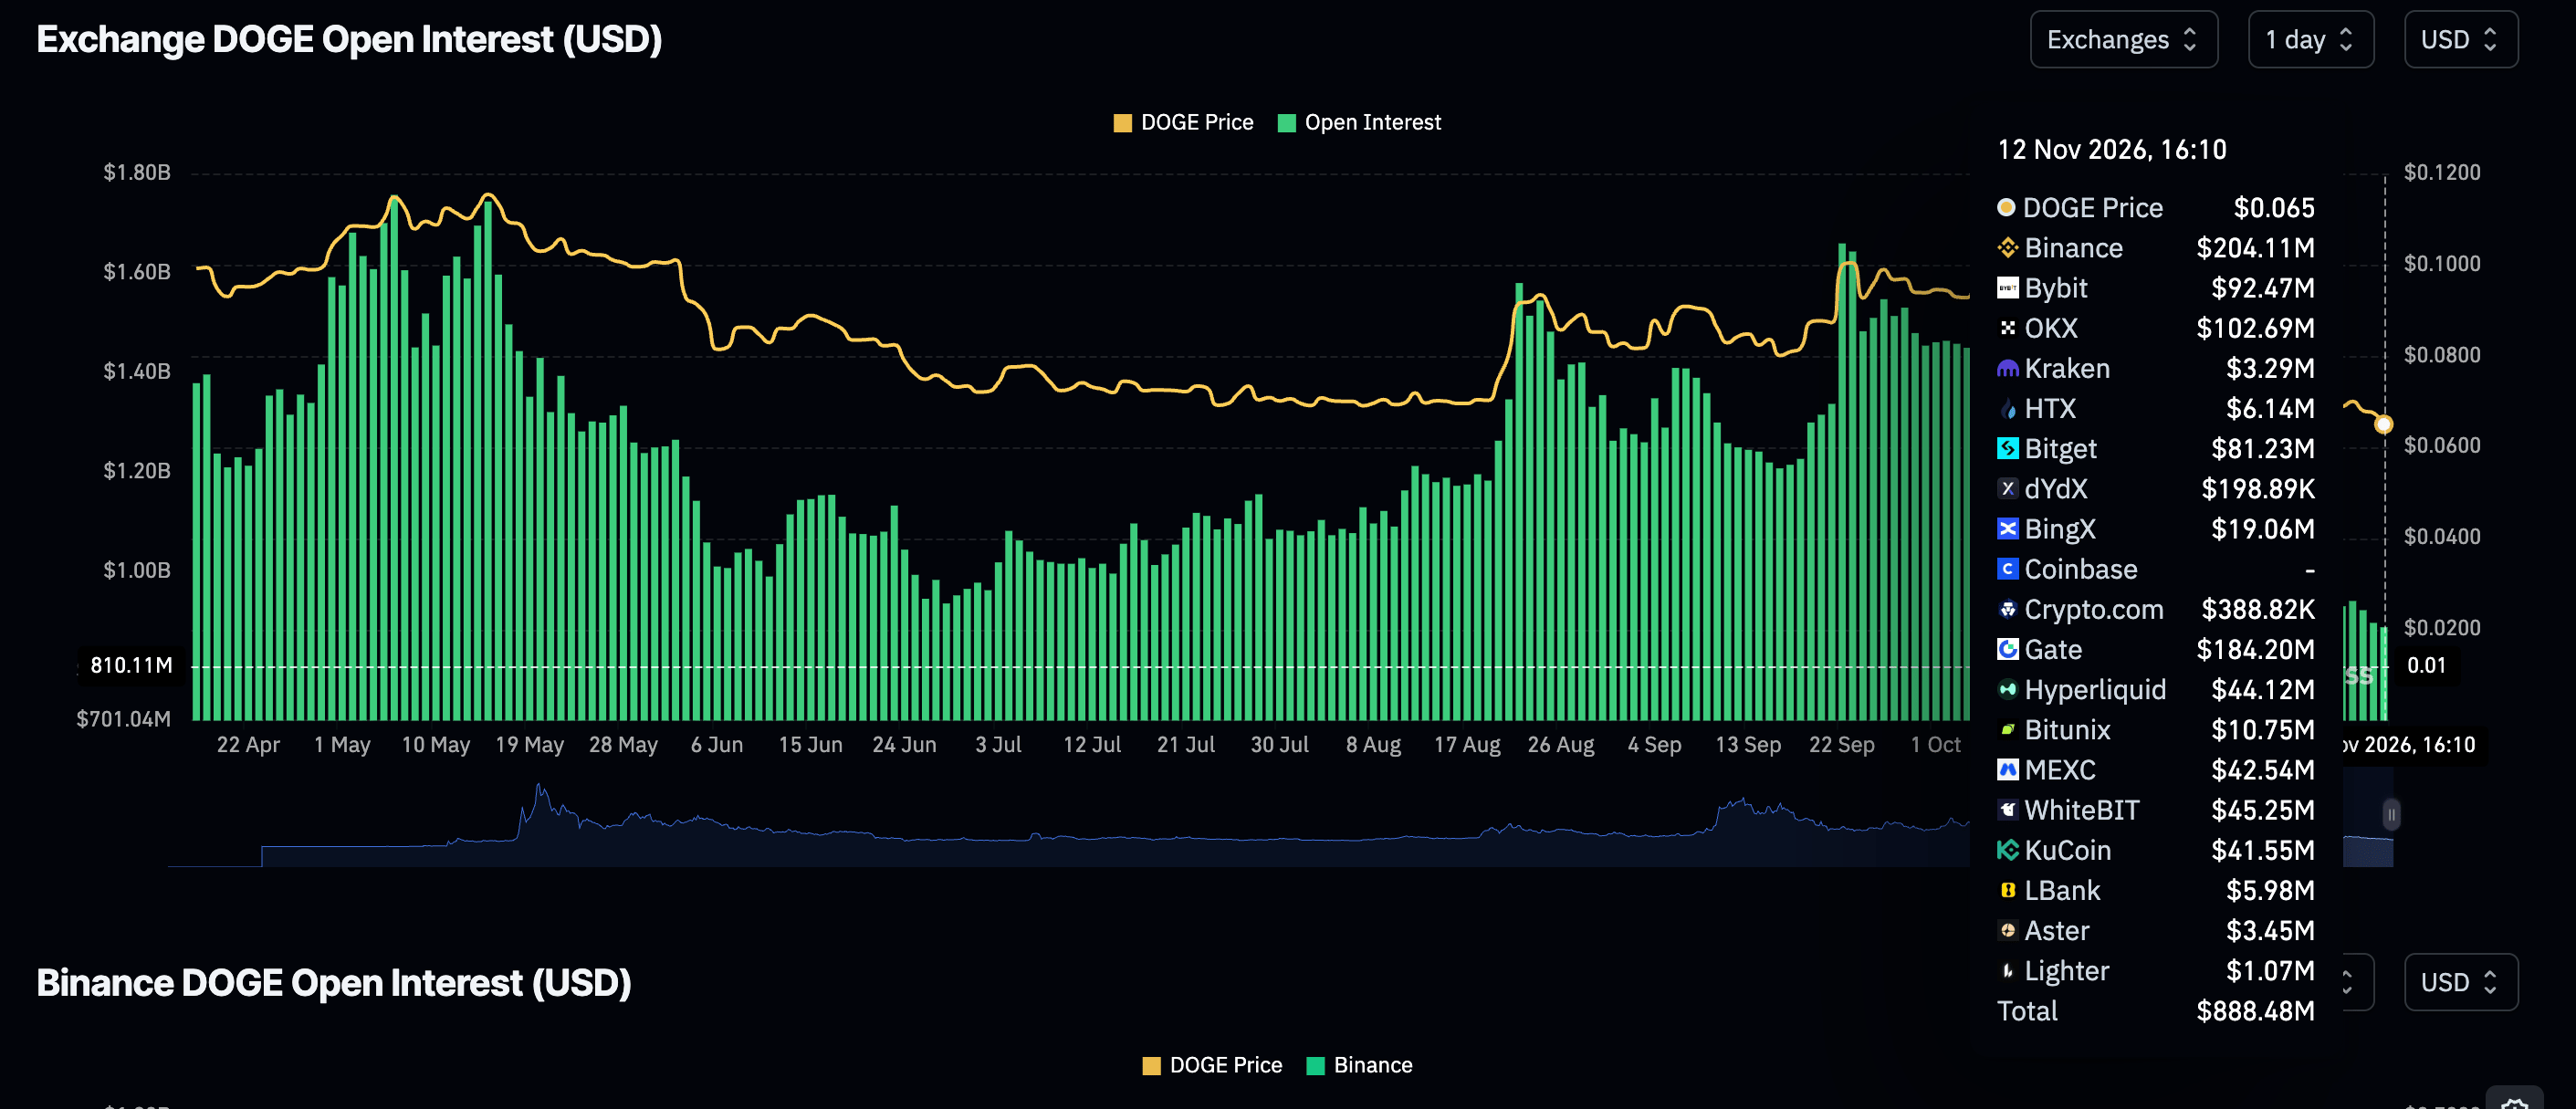
The measure, which captures the notional value of unsettled futures contracts, was $1 billion on November 1 and $1.5 billion on October 1. Its steady decline alongside Dogecoin's falling price suggests a persistent loss of investor interest.
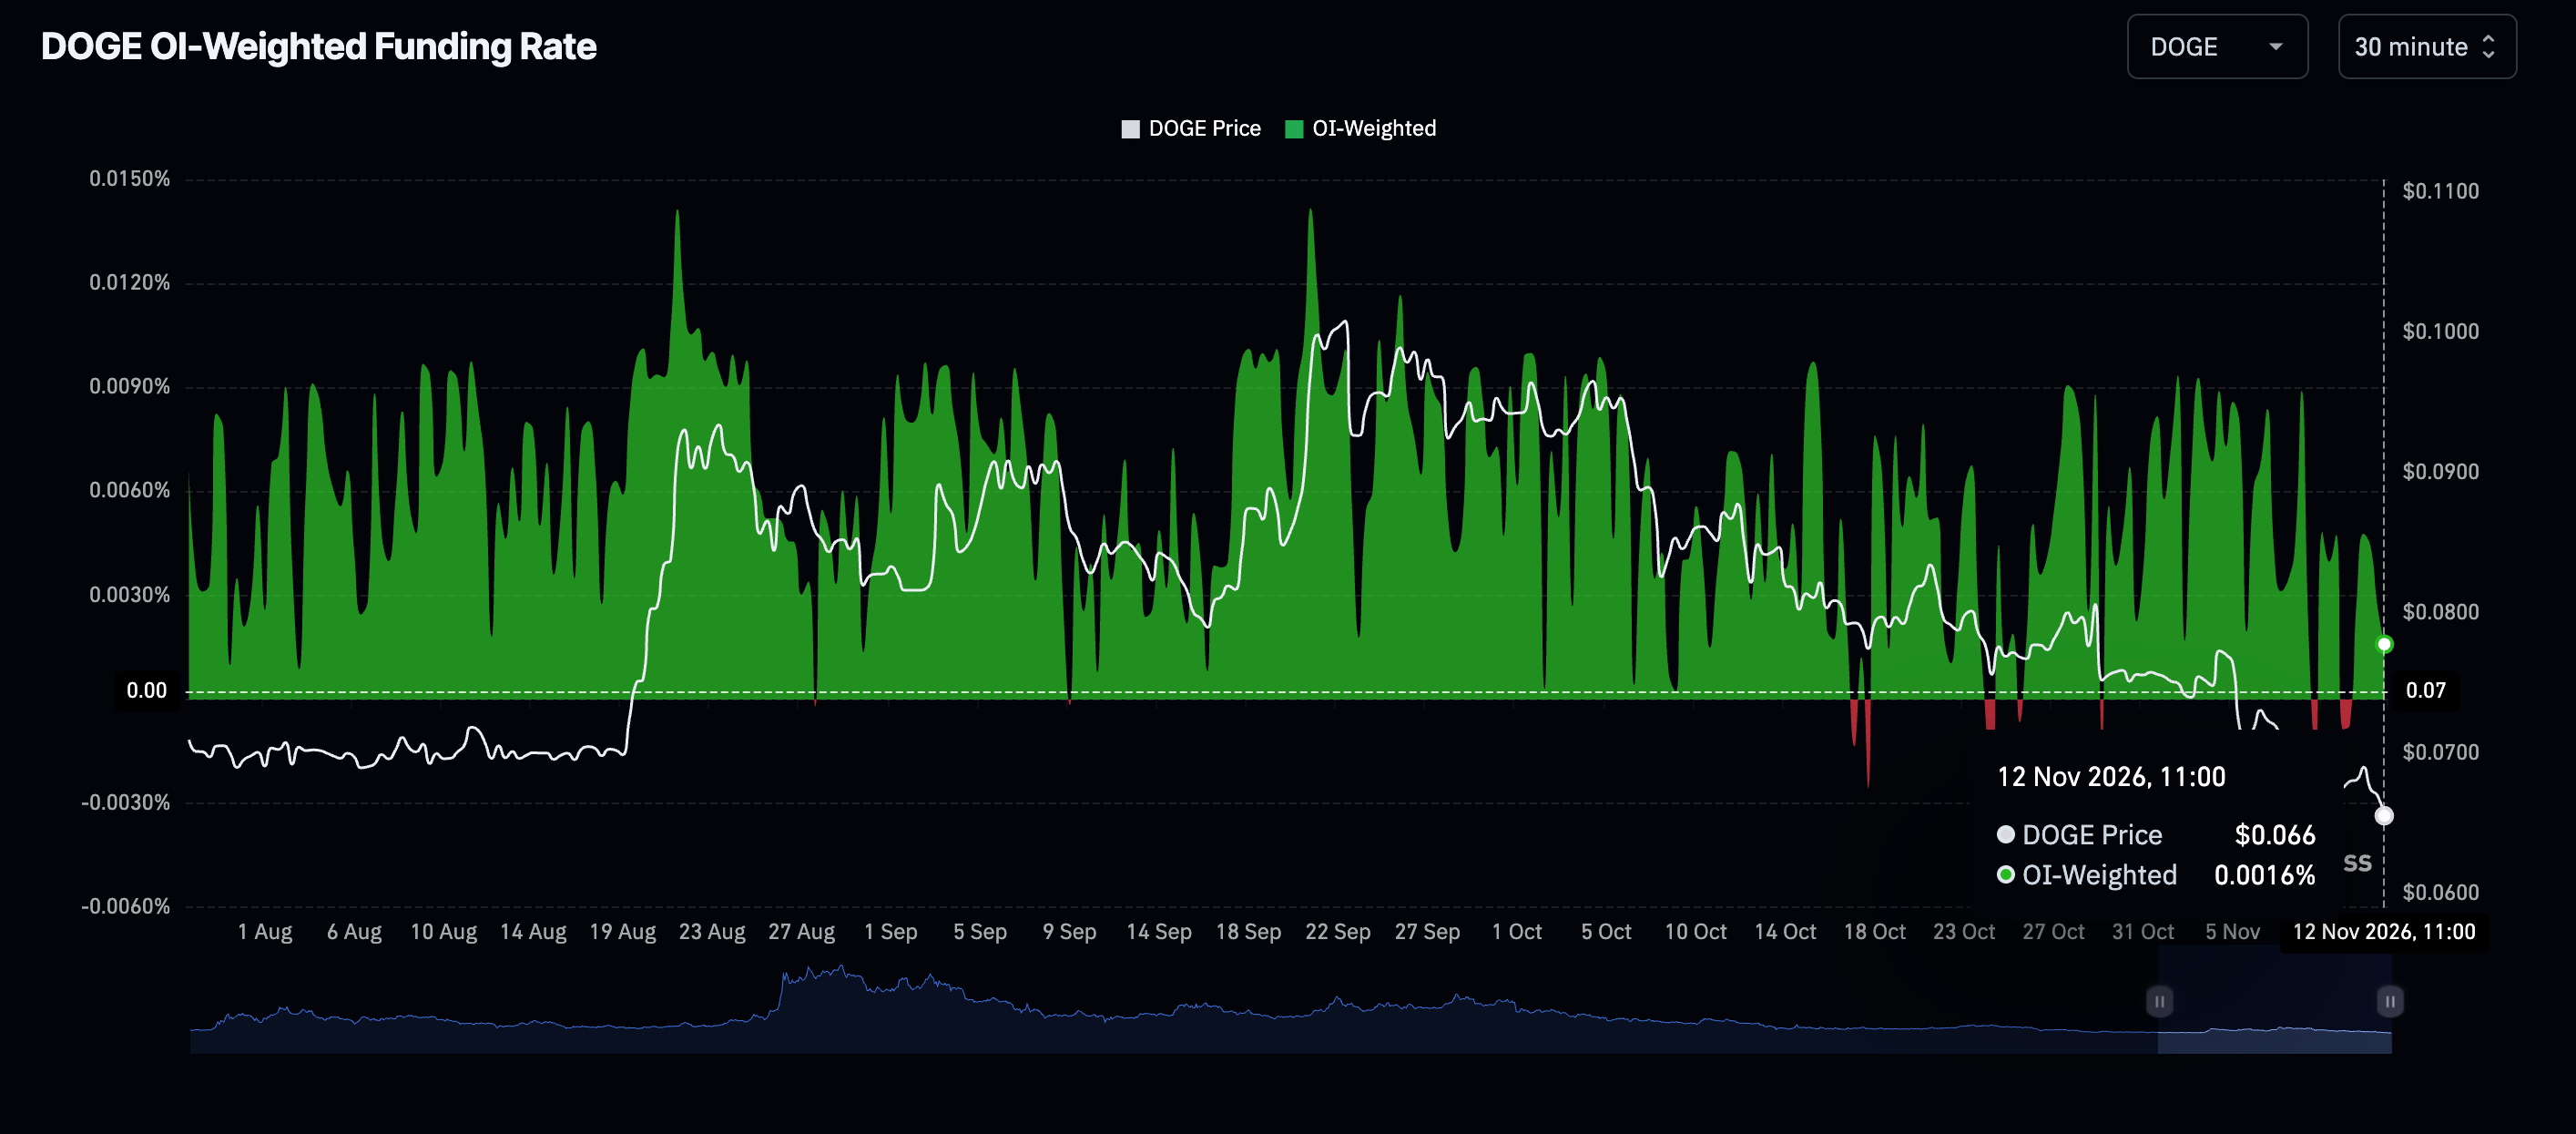
In contrast, a positive OI-weighted funding rate of 0.0016% indicates that Dogecoin long traders remain willing to pay a premium to maintain their positions. Holding above short-term support at $0.0640 could therefore encourage traders to add exposure, improving the prospects of a recovery.
Technical analysis: Can Dogecoin find support at multi-year lows?
At $0.0648, Dogecoin continues to slide well below all key Exponential Moving Averages (EMAs), strengthening the near-term bearish outlook. Overhead resistance is layered at the 50-day EMA of $0.0784, the 100-day EMA of $0.0812 and the 200-day EMA of $0.0885. Meanwhile, the SuperTrend at $0.0769 limits attempts at a recovery.
An oversold Relative Strength Index (RSI) reading of 27 highlights the weak momentum. The Moving Average Convergence Divergence (MACD) is also below zero with a negative crossover, pointing to continued selling pressure, although the pair remains susceptible to brief corrective rebounds.
Any rebound would first encounter the SuperTrend resistance near $0.0769, before reaching the 50-day EMA at $0.0784 and the 100-day EMA at $0.0812, where further progress would likely prove difficult. Beyond these levels, the 200-day EMA around $0.0885 presents a more substantial barrier; reclaiming it would be necessary to ease the broader bearish structure.
Immediate structural support sits in the current trading zone near $0.0648, with a decisive break below opening the door to further losses. The oversold RSI and negative MACD suggest that any relief rally from this zone could be limited for as long as prices remain below the cluster of EMA and SuperTrend resistance levels.
(An AI tool assisted in writing the technical analysis for this article. Learn more.)
FAQs on Open Interest and funding rates
Rising Open Interest is linked to greater liquidity and fresh capital entering the market. This is viewed as an improvement in market efficiency, with the prevailing trend continuing. A fall in Open Interest, by contrast, is regarded as a signal of market liquidation: investors are exiting and overall demand for the asset is weakening, encouraging bearish sentiment.
By increasing the liquidation risks traders face, funding fees narrow the gap between an asset's spot price and its futures contract prices. When funding rates remain consistently high and positive, they signal bullish sentiment among market participants and expectations of a price increase. Persistently negative funding rates, on the other hand, indicate bearish sentiment: traders anticipate a fall in the cryptocurrency's price, and a bearish trend reversal is likely.
POPULAR ARTICLES
1Dogecoin Price Forecast: Can DOGE defend its three-year low as selling pressure intensifies?2Can Euro Escape Pressure Near May 2025 Lows as Fed Hawks Bolster Dollar?3Fed’s Hammack favours gradual rate hikes as she says inflation is getting worse4“We don’t need a deal with Iran”, says US President Donald Trump on Truth Social5Last week’s US Initial Jobless Claims increased to 200K6USD/JPY: Upside constrained by intervention risk – BBH7USD/CAD Price Forecast: Strong buying interest evident as RSI hovers near 668Can the US Dollar Index Extend Gains After Hitting a Fresh Year-to-Date High of 103.08 as Fed Rate Hike Bets Rise?9New Zealand Dollar holds near 0.5550 amid a pause by US Dollar bulls


Get Started!
Sign up and access the Global Markets in less than 3 minutes

Connect With Us












The information provided on this website is of a general nature only and does not constitute personal financial advice. Before acting on any information on this website, you should consider the suitability of the information in relation to your objectives, financial situation and needs. Investing in CFDs and FX Margin Contracts carries significant risks and is not suitable for all investors. You may lose more than your initial deposit. You do not own, or have, any interest in the underlying asset. We recommend that you seek independent advice and ensure you fully understand the risks involved before trading. It is important that you read and consider the disclosure document before you acquire any product listed on the website. The information and advertisements offered on this website are not intended for use by any person in any country or jurisdiction where such use would be contrary to local laws and regulations. The Products and Services offered on this website are not intended for residents of the United States, Malaysia and Thailand.
TMGM is authorized and regulated in various jurisdictions.
Trademax Australia Limited, trading as TMGM, is regulated by the Australian Securities and Investments Commission (ASIC), AFSL no. 436416 and is located at Level 28, One International Tower, 100 Barangaroo Avenue, 2000 Sydney, NSW Australia.
Email: support@tmgm.com.au
Trademax Global Limited, trading as TMGM, is authorized and regulated by the Vanuatu Financial Services Commission (VFSC), registration number 40356 and registered at 1276, Kumul Highway, Port Vila, Vanuatu, Republic of Vanuatu.
Email: support@tmgm.com
Trademax Global Markets (SE) Limited, trading as TMGM, is authorized and regulated by the Financial Services Authority (FSA) of Seychelles, with license number SD224. The company is registered at Office No 13, Providence Estate ABIS Centre, Mahe, Seychelles.
Email: support@tmgm.com
Trademax Global Markets (International) Pty Ltd, trading as TMGM, is authorized and regulated by the Financial Services Commission, Mauritius (FSC) with license no. GB22201012, and registered at 33, Edith Cavell Street C/o IQ EQ Fund Services (Mauritius) Ltd Port Louis, 11324 Mauritius.
Email: support@tmgm.com
Copyright © TMGM. All rights reserved