

Trading
Explore a wide range of markets with competitive pricing, deep liquidity, and advanced trading tools.
Learn More 
Platform
Trade seamlessly with TMGM's powerful platform, built for speed, precision, and a superior trading experience.
Learn More Trading Platform
Academy
Learn the fundamentals of trading with beginner-friendly resources, including guides, webinars, and market insights.
Learn More News & Analysis
Get real-time market updates and expert analysis to stay ahead of trading opportunities
Learn More News & Analysis
About
Learn what sets TMGM apart — our global presence, regulatory strength, and commitment to innovation in trading.
Learn More Why Choose TMGM
Sponsorship
Top Altcoins Price Forecast: What next for Ripple, Cardano and Solana as declines pause amid exhaustion signals?
- Following a decline of roughly 20% over the last seven days, Ripple steadies around $1.05 on Thursday.
- Easing selling pressure allows Cardano to keep defending the key support base near $0.1712.
- With Solana pausing above $83, bearish traders turn their attention to the next support near $77.60.
Selling in leading altcoins pauses on Thursday, with Ripple (XRP), Cardano (ADA), and Solana (SOL) stabilising after a decline associated with elevated US inflation data and the period following the US midterms. This temporary respite suggests markets have factored in October’s hot CPI reading of 0.4%, against expectations of 0.3%.
Attention is now turning to Friday’s release of the October US Producer Price Index (PPI). With US commodity inflation expected to increase by 0.4% month-on-month, a stronger-than-forecast reading could put further pressure on November’s Consumer Price Index (CPI).
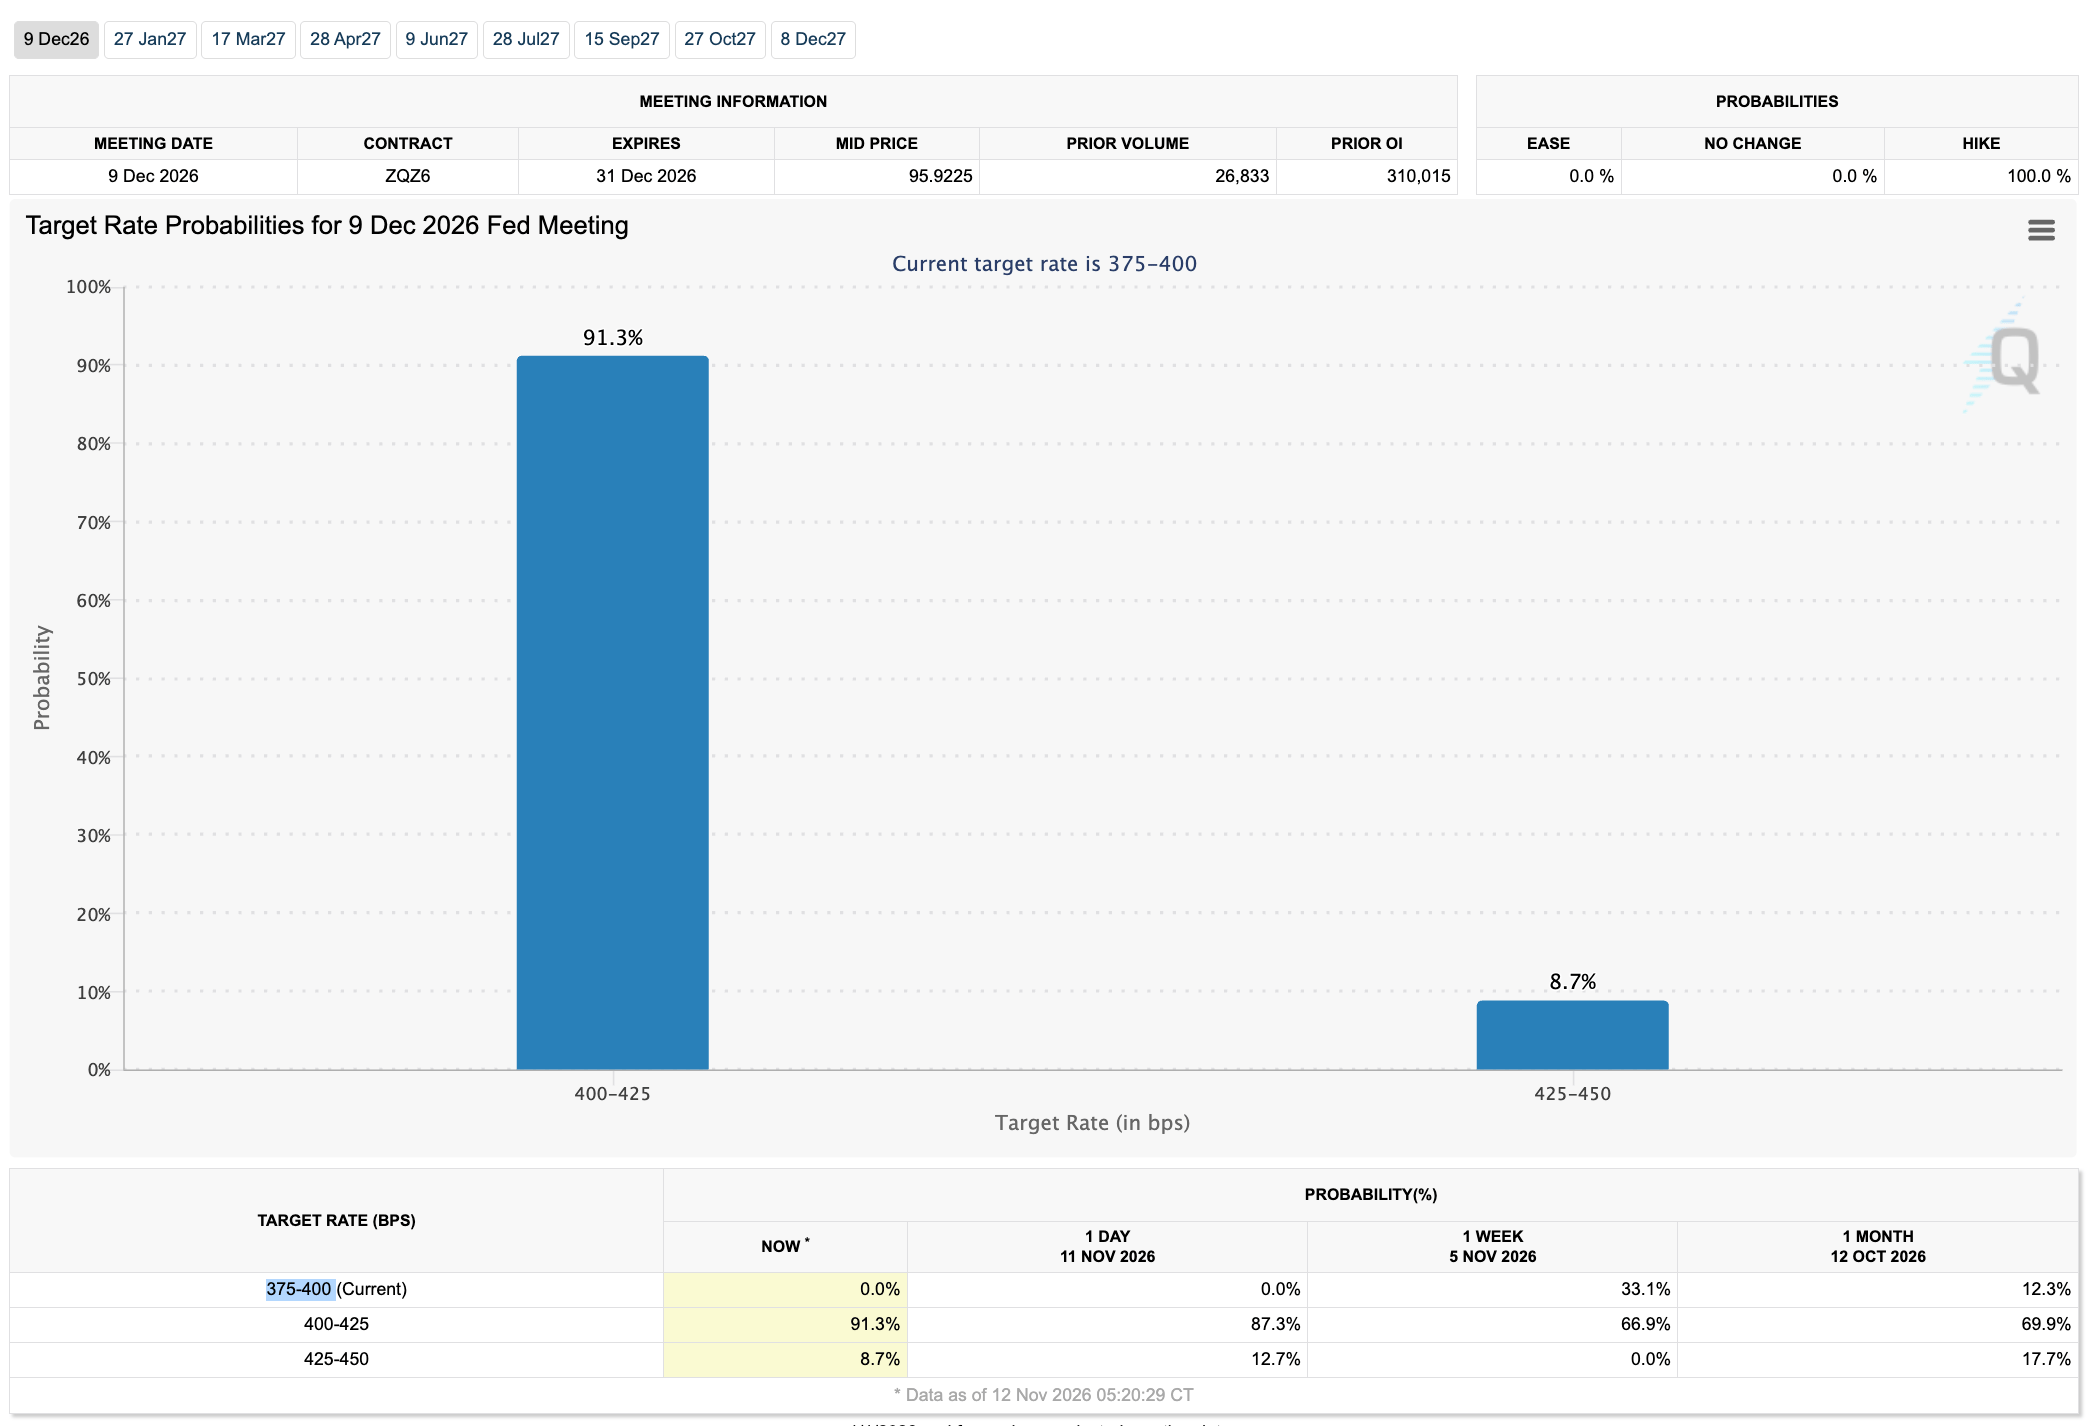
If October’s PPI comes in hot, as US CPI did, crypto markets could face heavier selling and heightened concerns over a 50-basis-point (bps) rate hike. According to the CME FedWatch Tool, the probability of a 25-basis-point rate hike from the current 3.75%-4.00% range stands at 91%.
Nevertheless, technical indicators suggest XRP, ADA, and SOL are consolidating. Should uncertainty across the broader market subside, this could establish a base for a rebound.
XRP Technical Analysis: Will the $1 Level Hold Against Bearish Pressure?
After losing roughly 20% over the last seven days, Ripple pauses above the psychological level of $1.0000. A bearish trend is reinforced by the downward slope of the 50-day and 200-day Exponential Moving Averages (EMAs), positioned at $1.2746 and $1.3421, respectively.
A descending trendline near $1.3313 continues to cap the pair’s broader structure, while horizontal resistance at $1.0692 adds immediate pressure on the upside. An upward trend would require XRP to regain these levels.
With the Relative Strength Index (RSI) near 24 in oversold territory, momentum remains subdued. Meanwhile, the Moving Average Convergence Divergence (MACD) line moves lower into negative territory, pointing to a continued downside bias.
For XRP, the easier path remains lower through $1.0000 towards support at $0.9862, the annual low recorded on 14 August.
Cardano technical outlook: Can near-term support hold as selling eases?
A short-term pause keeps Cardano above support at $0.1712 on Thursday, following losses of roughly 35% over the last six weeks. ADA’s extended decline leaves it well below the 50-day and 200-day EMAs at $0.2054 and $0.2245, respectively. The former rising trendline support has also become a barrier near $0.2069.
Should ADA sustain a break below $0.1712, its decline could reach horizontal support at $0.1537, established by the 27 July low.
Signs of fading momentum are emerging. The RSI is moving sideways around 31, just above the oversold band, while the MACD draws closer to its signal line and the histogram shrinks towards zero, suggesting that downside pressure is easing.
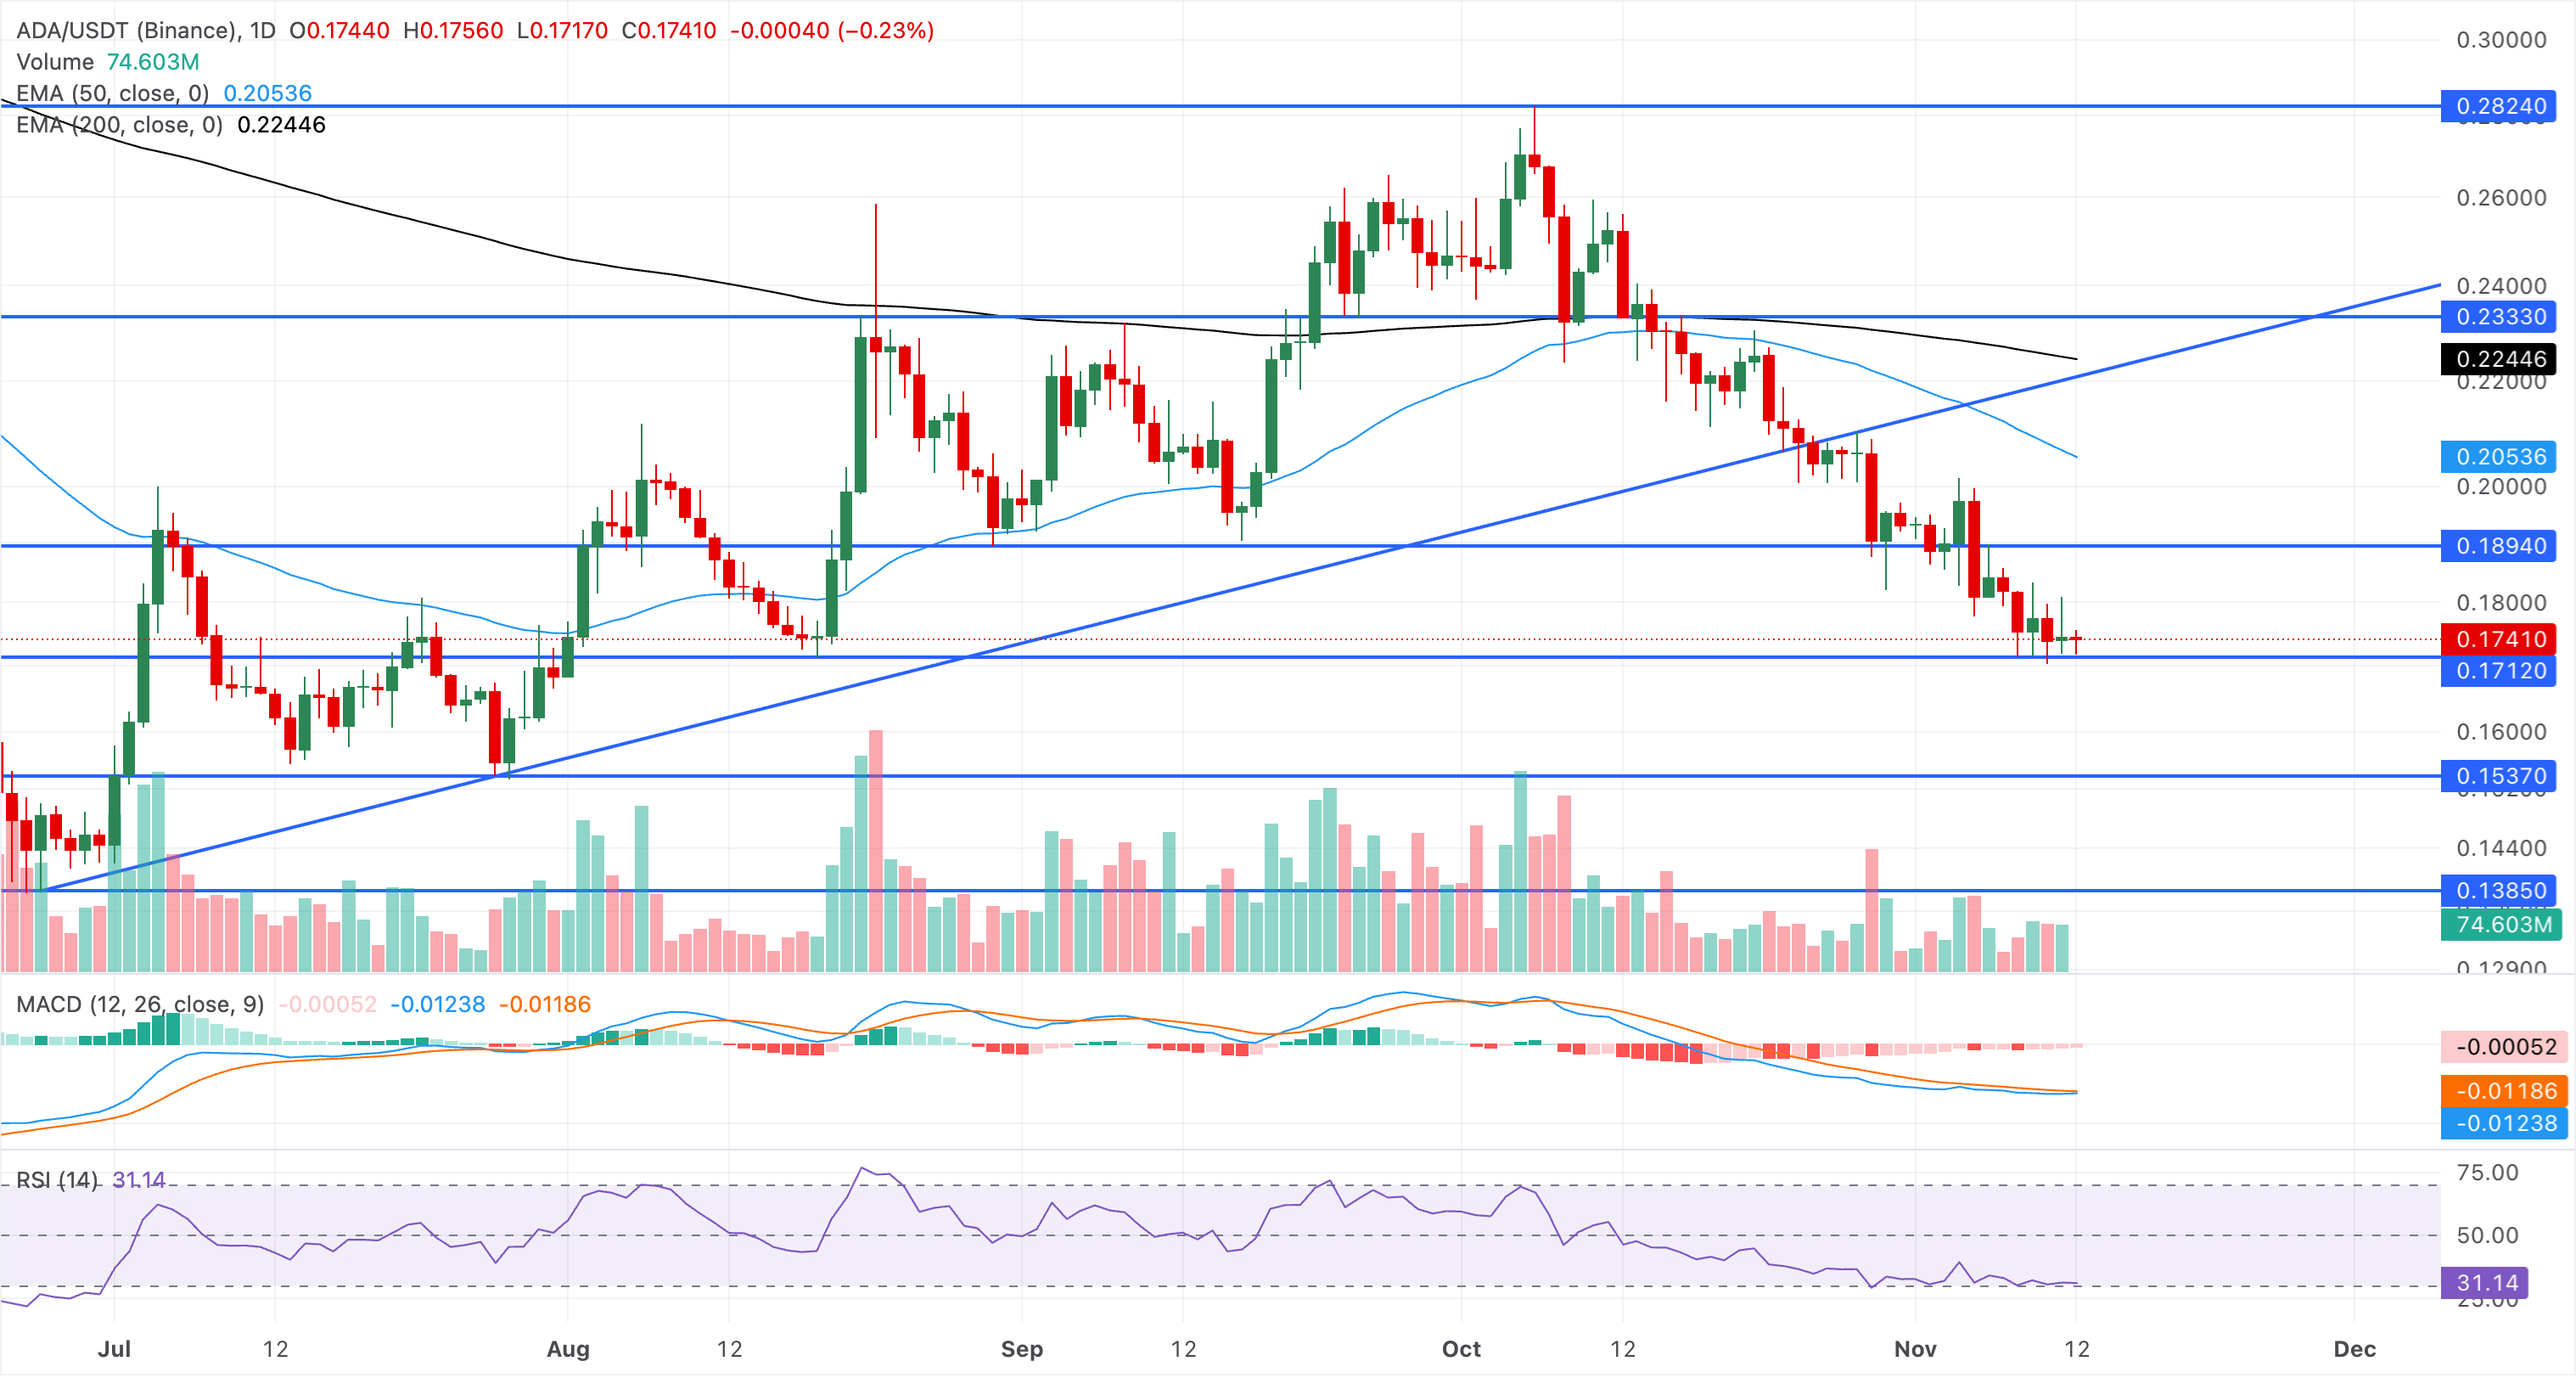
On the upside, horizontal resistance at $0.1894 is the first obstacle. Beyond it lies a more concentrated supply zone, where the 50-day EMA at $0.2054 sits alongside the broken rising trendline near $0.2069.
Solana technical analysis: Where could support emerge?
A bearish phase persists for Solana, which trades at $83.31 at the time of writing on Thursday, below its 50-day and 200-day EMAs. Those averages, near $98.40 and $98.74, respectively, form a tight overhead resistance zone. The 50-day EMA is also close to moving below the longer-term EMA. This formation, commonly known as a Death Cross, could confirm a bearish trend reversal.
Although the downtrend is stretched, bearish momentum continues to dominate, with the MACD below zero. An RSI reading of 23 also signals oversold conditions.
SOL’s first support lies at the horizontal base near $77.60. A confirmed break below this level could push the decline towards lower support levels at $67.50 and $60.13.
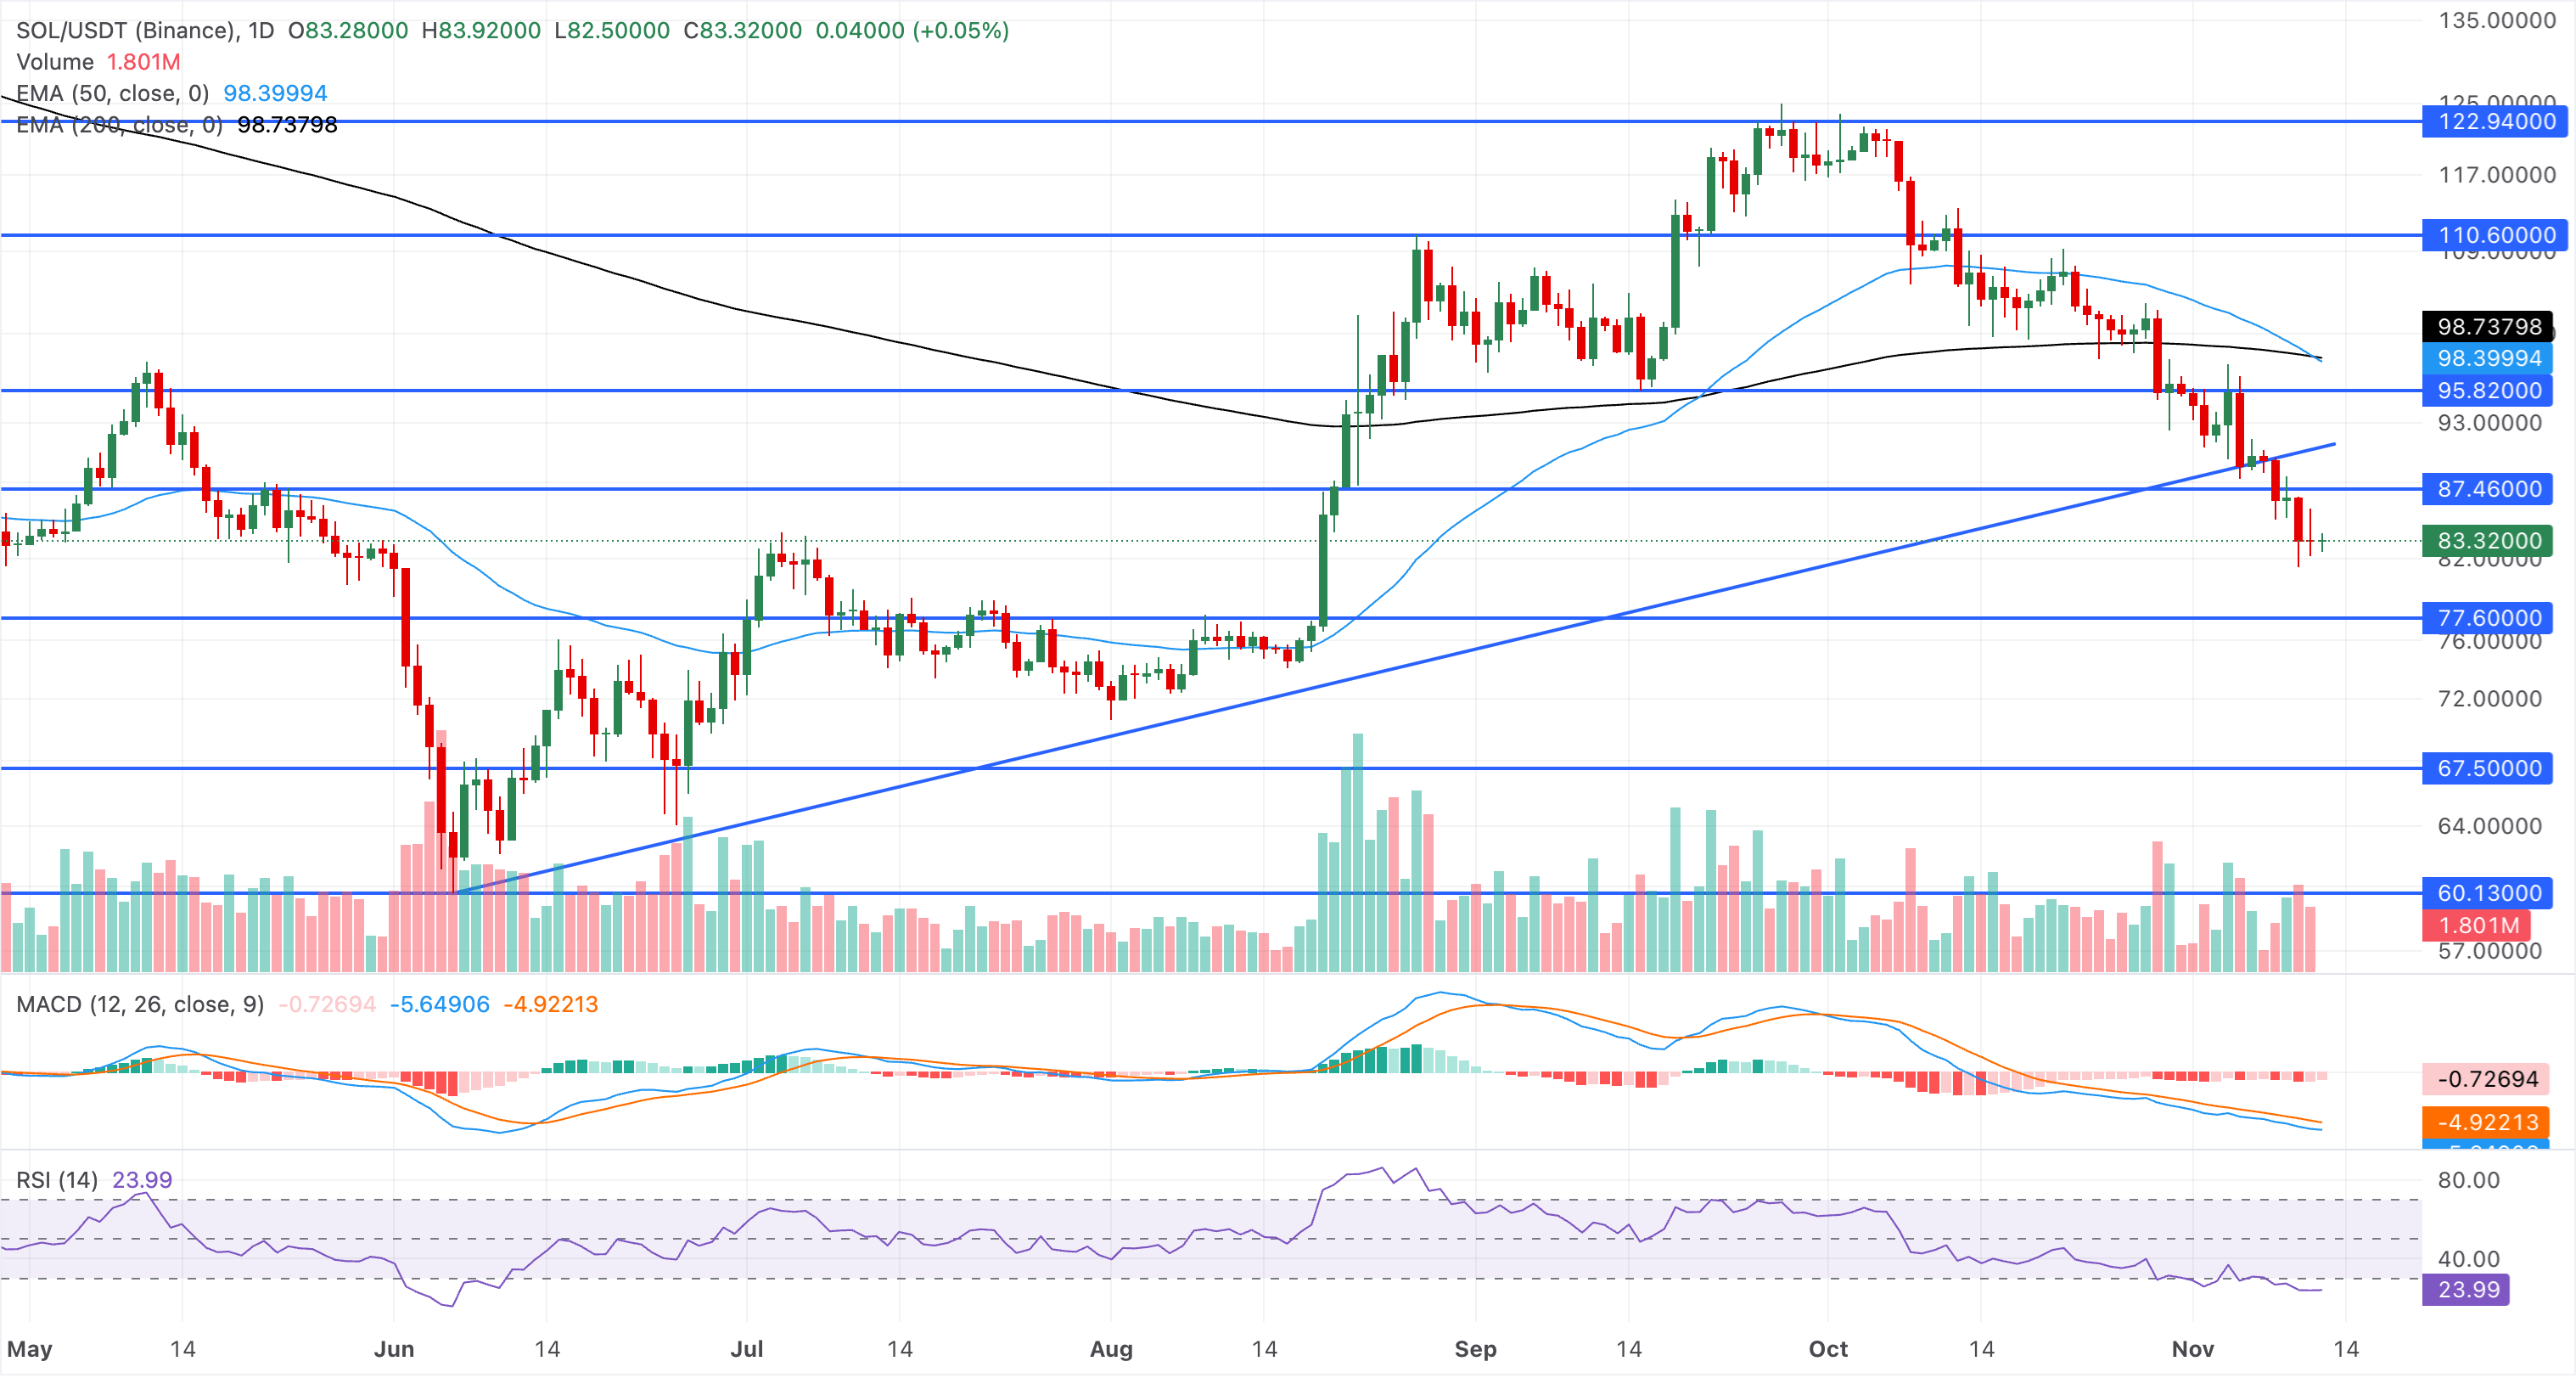
Any upward move would first encounter resistance at $87.46. Subsequent barriers lie at the broken trendline near $91.05 and the horizontal resistance level of $95.82.
(The technical analysis of this story was written with the help of an AI tool. Know more.)
POPULAR ARTICLES
1USD/CAD Price Forecast: Strong buying interest evident as RSI hovers near 662Can the US Dollar Index Extend Gains After Hitting a Fresh Year-to-Date High of 103.08 as Fed Rate Hike Bets Rise?3New Zealand Dollar holds near 0.5550 amid a pause by US Dollar bulls4US Dollar: Rally loses steam with Fed commentary in focus – BBH5Reuters poll: Economists agree ECB will raise rates to 2.75% in December6Top Altcoins Price Forecast: What next for Ripple, Cardano and Solana as declines pause amid exhaustion signals?7British Pound: Why do resilient data bolster the case for BoE hikes? – BBH8Can Official Warnings Against Rapid Currency Moves Sustain the Japanese Yen’s Relief?9EUR/GBP Price Forecast: Can the pair sustain consolidation above 0.8350 after rejection at 0.8370?

Get Started!
Sign up and access the Global Markets in less than 3 minutes

Connect With Us












The information provided on this website is of a general nature only and does not constitute personal financial advice. Before acting on any information on this website, you should consider the suitability of the information in relation to your objectives, financial situation and needs. Investing in CFDs and FX Margin Contracts carries significant risks and is not suitable for all investors. You may lose more than your initial deposit. You do not own, or have, any interest in the underlying asset. We recommend that you seek independent advice and ensure you fully understand the risks involved before trading. It is important that you read and consider the disclosure document before you acquire any product listed on the website. The information and advertisements offered on this website are not intended for use by any person in any country or jurisdiction where such use would be contrary to local laws and regulations. The Products and Services offered on this website are not intended for residents of the United States, Malaysia and Thailand.
TMGM is authorized and regulated in various jurisdictions.
Trademax Australia Limited, trading as TMGM, is regulated by the Australian Securities and Investments Commission (ASIC), AFSL no. 436416 and is located at Level 28, One International Tower, 100 Barangaroo Avenue, 2000 Sydney, NSW Australia.
Email: support@tmgm.com.au
Trademax Global Limited, trading as TMGM, is authorized and regulated by the Vanuatu Financial Services Commission (VFSC), registration number 40356 and registered at 1276, Kumul Highway, Port Vila, Vanuatu, Republic of Vanuatu.
Email: support@tmgm.com
Trademax Global Markets (SE) Limited, trading as TMGM, is authorized and regulated by the Financial Services Authority (FSA) of Seychelles, with license number SD224. The company is registered at Office No 13, Providence Estate ABIS Centre, Mahe, Seychelles.
Email: support@tmgm.com
Trademax Global Markets (International) Pty Ltd, trading as TMGM, is authorized and regulated by the Financial Services Commission, Mauritius (FSC) with license no. GB22201012, and registered at 33, Edith Cavell Street C/o IQ EQ Fund Services (Mauritius) Ltd Port Louis, 11324 Mauritius.
Email: support@tmgm.com
Copyright © TMGM. All rights reserved